Download to read offline


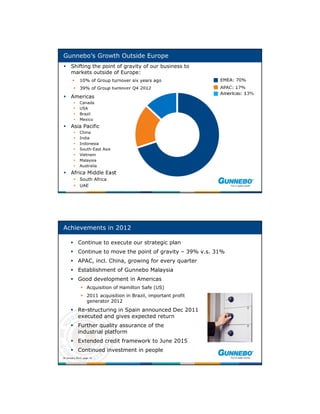
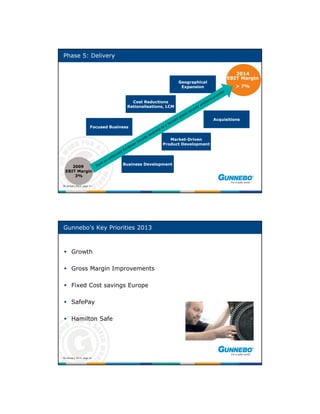


Gunnebo's Q4 2012 order intake and sales grew compared to Q4 2011, driven by strong growth outside of Europe. However, the company faced slower growth in Europe and higher non-recurring expenses that impacted profits. For full year 2012, order intake and sales increased through acquisitions and growth outside of Europe, particularly in Asia and the Americas, but operating profits declined due to weakness in Europe and non-recurring costs. Looking ahead, Gunnebo aims to continue shifting its business focus outside of Europe and improving profitability through cost reductions and growth initiatives.


