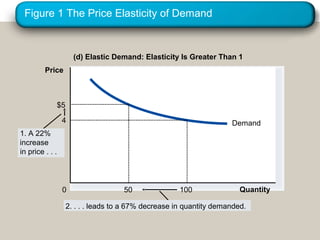
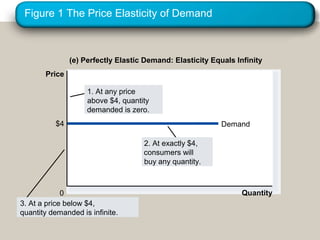
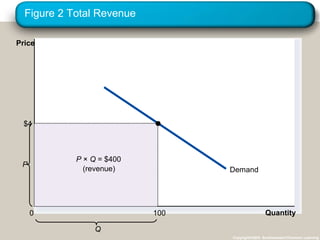
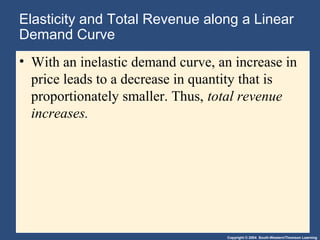
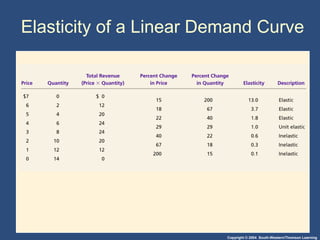
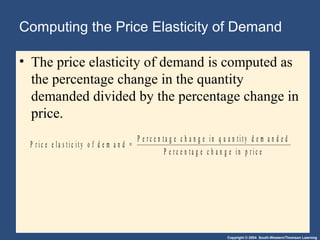
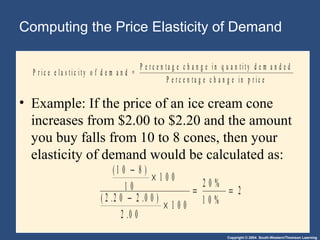
This document discusses elasticity and its applications. It defines price elasticity of demand and supply as the percentage change in quantity demanded or supplied given a percentage change in price. Demand can be elastic, inelastic, or unit elastic depending on how much quantity changes with price. The document also discusses factors that determine elasticity, how to compute elasticity, and how shifts in supply or demand impact equilibrium price and quantity in a market.


![Copyright © 2004 South-Western/Thomson Learning
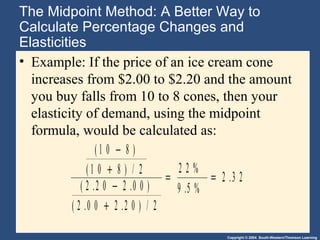
The Midpoint Method: A Better Way to
Calculate Percentage Changes and
Elasticities
• The midpoint formula is preferable when
calculating the price elasticity of demand
because it gives the same answer regardless of
the direction of the change.
P r i c e e l a s t i c i t y o f d e m a n d =
( ) / [ ( ) / ]
( ) / [ ( ) / ]
Q Q Q Q
P P P P
2 1 2 1
2 1 2 1
2
2
− +
− +](https://image.slidesharecdn.com/elasticity-150722181357-lva1-app6891/85/Elasticity-and-Its-Application-8-320.jpg)