Ekg
•
0 likes•280 views
An electrocardiogram (ECG or EKG) records the electrical activity of the heart over time through electrodes placed on the skin. It shows five main components - P wave, QRS complex, and T wave - that represent the spread of electrical impulses through the heart during each heartbeat. Doctors can analyze features of the EKG like interval durations and waveform shapes to detect abnormalities and disorders of the heart's rhythm or muscle tissue. In this experiment, students will record their own EKG, identify the components, calculate heart rate, and observe how the tracing changes when the electrode leads are switched to simulate a myocardial infarction.
Report
Share
Report
Share
Download to read offline

Recommended
Ekg.exp.3
An EKG records the electrical activity of the heart over time. It shows waveforms labeled P, QRS, and T that represent different events in the heart's electrical cycle and natural conduction pathways. Abnormalities in these waveforms can indicate disorders like arrhythmias, injury, or heart attacks. In this experiment, students will record their own EKG, identify the normal waveforms and intervals, calculate their heart rate, and observe how the tracing changes when electrode positions are altered to simulate a myocardial infarction.
Electrocardiography (ecg) - Electrical Signal of Human Heart
Electrocardiography is the process of producing an electrocardiogram, a recording – a graph of voltage versus time – of the electrical activity of the heart using electrodes placed on the skin
Electrocardiogram
An electrocardiogram (ECG) records the electrical activity of the heart over time via electrodes placed on the skin. It displays the P wave, QRS complex, and T wave, which correspond to atrial depolarization and repolarization and ventricular depolarization and repolarization, respectively. The ECG is used clinically to diagnose cardiac conditions by examining intervals, amplitudes, and other characteristics. It provides important diagnostic information but cannot assess heart valves like angiography and echocardiography can.
Electrocardiogram
This power point presentation contains basic information about ECG test, it's components and intervals with respect to heartbeat signals
Vector cardiography
Vector cardiography analyzes the electrical activity of the heart along three axes by obtaining an ECG, displaying the results as a vector cardiogram which produces loop patterns representing the distribution of electrical potential generated by the heart. It examines ECG potentials along three-dimensional x, y, and z axes of the body to determine the direction of atrial and ventricular depolarization and repolarization, detecting each electric heart vector component with equal sensitivity.
Electrocardiogram - Medical Equipment
An electrocardiogram (ECG or EKG) is a test that checks how your heart is functioning by measuring the electrical activity of the heart. With each heartbeat, an electrical impulse (or wave) travels through your heart. This wave causes the muscle to squeeze and pump blood from the heart.
ECG-Electrocardiography
1.Bioelectric signals and their characteristics
2.Structure of heart
3.ECG Lead System Configuration
4.ECG Waveform
5.ECG Recording system – Block diagram
6.Analysis of ECG waveform
topic ECG and heart diseases+treatments
The topic is about heart related diseases and how it can be cured.what are the diseases and what are the treatments and methods. You should view it.it may be helpful to you people.
Vectorial analysis of Electrocardiogram
This document discusses vectorial analysis of electrocardiograms. It explains that the instantaneous mean vector represents the average direction of electrical flow in the heart at a moment in time, which is usually downward. Vector direction is measured in degrees relative to a zero reference point. The mean QRS vector during ventricular depolarization is typically around +59 degrees. Different electrocardiogram leads are analyzed by drawing perpendicular projections of the heart's vector onto the axis of each lead to determine the recorded potential. This vectorial approach is used to analyze the potentials seen in the three standard limb leads during the QRS complex.
Physiology (electrocardiography ecg)
An electrocardiogram (ECG) records the electrical activity of the heart over time using electrodes placed on the skin. An ECG is used to detect abnormalities in heart rhythm and function by measuring the heart's electrical signals through 12 leads that include 6 chest leads and 6 limb leads. The heart rate can be calculated from an ECG by counting the number of big squares between two R waves in a cycle and dividing 300 by that number.
Basic Electrocardiography
History of Electrocardiography, Einthoven law, Einthoven triangle, additional leads,vectorcardiography
ECG (easy explanation)
The document provides an overview of electrocardiograms (ECGs) including:
- An ECG records the electrical activity of the heart during each heartbeat through electrodes placed on the skin.
- A 12-lead ECG examines the heart's electrical activity from 12 different angles using 10 electrodes placed in specific locations.
- The ECG paper displays voltage over time to show the P wave, QRS complex, ST segment, T wave, and other components of the heartbeat.
- A normal ECG can help identify conditions like heart attacks, arrhythmias, and electrolyte imbalances while abnormal findings may indicate issues like left ventricular hypertrophy.
Basic electrocardiography and Beyond
This document provides an overview of basic electrocardiography and introduces more advanced concepts. It covers topics such as cardiac anatomy, depolarization and repolarization, the placement of electrodes, the 12-lead ECG system, and vectorcardiography. The document aims to explain electrocardiography fundamentals and relationships between bipolar and unipolar limb leads, as well as discuss additional leads and their clinical significance. It concludes by emphasizing the importance of understanding electrocardiography principles.
Ecg (electrocardiogram)
This document provides an overview of electrocardiography (ECG). It defines ECG as the technique used to study the electrical activity of the heart. The document discusses the history and inventor of ECG, the uses of ECG to diagnose various heart conditions, the electrocardiographic grid and its components, the different ECG leads, the normal waves of an ECG, and the significance of ECG in accurately assessing the function of the heart's auricles and ventricles.
What is electrocardiogram (ECG)
An ECG (electrocardiogram) records the electrical activity of your heart at rest. It provides information about your heart rate and rhythm and shows if there is an enlargement of the heart due to high blood pressure (hypertension) or evidence of a previous heart attack (myocardial infarction).
Questions and Answers related to ECG and illustration. Short assignment with diagram and images
Presentation on Cardiac monitoring
Cardiac monitoring generally refers to continuous or intermittent monitoring of heart activity, generally by electrocardiography, with assessment of the patient's condition relative to their cardiac rhythm.
ECG
This document provides an overview of electrocardiography (ECG). It defines ECG as the study of the electrical activity of the heart muscles using an electrocardiograph. It describes the anatomy of the heart including its four chambers, four valves, three layers, blood vessels, and dual circulation systems. It also explains the different ECG lead systems including standard bipolar limb leads, augmented unipolar limb leads, and chest leads. Finally, it outlines the basic components of an ECG recording setup including defibrillator protection, lead selection logic, calibration, pre-amplification, power amplification, feedback, and output display.
12 lead electrocardiogram
learn how to obtain an ECG, anyone can do it:
This presentation aims to show the clinical process of obtaining an ECG and features some tips and suggestions to troubleshoot and improve the quality of the tracing.
Please note that you're welcome to use any slides as long as you reference my post when you do so to maintain the integrity of authorship
If interested in detailed answers, please email: aamirdash@yahoo.com
Thanks, Ahmad
Ecg ppt
Electrocardiography (ECG or EKG) is the process of recording the electrical activity of the heart over time using electrodes placed on a patient's body. These electrodes detect tiny electrical changes on the skin arising from the heart muscle during each heartbeat. The ECG traces the heart's electrical activity through the various conduction pathways and different deflections in the tracing correspond to atrial and ventricular depolarization and repolarization. A normal ECG tracing shows the P wave, QRS complex and T wave and time intervals can provide information on heart rate and conduction delays.
Electrical activity in the heart
An electrocardiogram (EKG/ECG) is a test that uses electrodes placed on the chest to detect and record the electrical activity of the heart. The EKG can show the heart's chambers, the pacemaker that initiates heartbeats, and the depolarization wave that causes the heart muscles to contract by removing the normal electrical distribution of cells before they recover to their resting state.
Electrocardiography
Electrocardiography (ECG or EKG) is a process that records and analyzes the electrical activity of the heart over time using electrodes placed on the skin. It was invented in 1903 by Dutch physician Willem Einthoven, who received the Nobel Prize for his creation. A standard ECG uses 10 electrodes placed in specific locations on the limbs and chest to detect electrical signals produced during each heartbeat. The signals are interpreted by an ECG machine to analyze heart rate, rhythms, and for signs of conditions like heart attacks, damage, or defects. An ECG can provide important information about the structure and function of the heart.
Ecg123
An ECG records the electrical activity of the heart to check for problems with heart rhythm, conduction, or damage. It uses electrodes to detect tiny voltage changes on the skin caused by heart muscle depolarization during each heartbeat. The signals are very small so they must be amplified and filtered to remove noise. Differential amplifiers are used to amplify the signal without amplifying common mode noise. Band stop filters then remove power line interference and other noise. An ECG can provide information on heart rate, rhythm, and prior damage to assess heart health and the effects of medications.
Ecg basics electric activity within heart
The document discusses the basics of electrocardiograms (ECGs) including:
1) It describes how electrical signals are conducted through the heart starting from the sinoatrial node and traveling to the atria and ventricles.
2) It explains the phases of the cardiac action potential including depolarization, repolarization, and how this generates the ECG.
3) It shows diagrams of how electrode placements on the body affect the amplitude and direction of deflections recorded on an ECG.
Denoising of ECG -- A discrete time approach using DWT
This paper is about denoising of ECG signal using DWT transform. In this paper, ECG signals are denoised using DWT transform.Ecg signals are taken and noise at different frequencies are generated which are superimposed on this original ecg signal.High frequency noise is of 4000 hertz and power line interference is of 50 hertz.Decomposition of noisy signal is achieved through wavelet packet .wavelet packets are reconstructed and appropriate wavelet packets are combined to obtain a signal, very similar to original ecg signal.This technique results in the minimization of mean square error in the filtered signals.
Procedure of Recording ECG
It's procedure of recording ECG for Nursing Students.
It is helpful content for GNM 2nd Year & B.Sc.N. 2nd Year Students.
Ecg made easy ppt
The document provides guidance on performing and interpreting 12-lead electrocardiograms (ECGs). It outlines the proper procedure for applying electrodes, including skin preparation and placement of limb and chest leads. Key aspects that must be checked include verifying the leads are attached correctly, the ECG is free of artifact, and identifying any critical findings such as arrhythmias or ST segment changes. Interpreting the ECG requires evaluating the rhythm, measuring the heart rate, identifying normal and abnormal waveforms, and relating findings to the patient's condition.
4.ecg
This document provides an overview of electrocardiograms (ECGs). It discusses the conduction system of the heart and electrophysiology. It then covers the basics of ECGs, including definitions, electrodes, leads, and waves/intervals. It explains how to interpret and analyze ECG papers by examining rate, rhythm, axis, P wave, PR interval, QRS complex, ST segment, T wave, and QT interval. Finally, it lists some common abnormalities that can be identified, such as issues with rate, rhythm, axis, conduction, and signs of ischemia.
Muscular physiology
Muscle physiology studies muscle function including development, structure, contraction and strength building. A muscle is a bundle of fibers that contract to produce movement, posture and heat. Muscle contractions are caused by nerve impulses that cause calcium ions to be released, activating cross bridges between actin and myosin fibers and causing the muscle to shorten. The sliding filament theory explains muscle contraction through the overlapping and sliding of the actin and myosin filaments.
Muscular Physiology
Skeletal muscles provide movement through contractions, generate heat through catabolism, and maintain posture through partial contractions. Muscles are excitable through nerve signals and use structures like myofibrils, sarcomeres, and troponin to generate force through the sliding filament theory when calcium ions bind during excitation and relax when calcium ions unbind. Different fiber types allow for specialized functions in sprinters versus marathon runners.
More Related Content
What's hot
Vectorial analysis of Electrocardiogram
This document discusses vectorial analysis of electrocardiograms. It explains that the instantaneous mean vector represents the average direction of electrical flow in the heart at a moment in time, which is usually downward. Vector direction is measured in degrees relative to a zero reference point. The mean QRS vector during ventricular depolarization is typically around +59 degrees. Different electrocardiogram leads are analyzed by drawing perpendicular projections of the heart's vector onto the axis of each lead to determine the recorded potential. This vectorial approach is used to analyze the potentials seen in the three standard limb leads during the QRS complex.
Physiology (electrocardiography ecg)
An electrocardiogram (ECG) records the electrical activity of the heart over time using electrodes placed on the skin. An ECG is used to detect abnormalities in heart rhythm and function by measuring the heart's electrical signals through 12 leads that include 6 chest leads and 6 limb leads. The heart rate can be calculated from an ECG by counting the number of big squares between two R waves in a cycle and dividing 300 by that number.
Basic Electrocardiography
History of Electrocardiography, Einthoven law, Einthoven triangle, additional leads,vectorcardiography
ECG (easy explanation)
The document provides an overview of electrocardiograms (ECGs) including:
- An ECG records the electrical activity of the heart during each heartbeat through electrodes placed on the skin.
- A 12-lead ECG examines the heart's electrical activity from 12 different angles using 10 electrodes placed in specific locations.
- The ECG paper displays voltage over time to show the P wave, QRS complex, ST segment, T wave, and other components of the heartbeat.
- A normal ECG can help identify conditions like heart attacks, arrhythmias, and electrolyte imbalances while abnormal findings may indicate issues like left ventricular hypertrophy.
Basic electrocardiography and Beyond
This document provides an overview of basic electrocardiography and introduces more advanced concepts. It covers topics such as cardiac anatomy, depolarization and repolarization, the placement of electrodes, the 12-lead ECG system, and vectorcardiography. The document aims to explain electrocardiography fundamentals and relationships between bipolar and unipolar limb leads, as well as discuss additional leads and their clinical significance. It concludes by emphasizing the importance of understanding electrocardiography principles.
Ecg (electrocardiogram)
This document provides an overview of electrocardiography (ECG). It defines ECG as the technique used to study the electrical activity of the heart. The document discusses the history and inventor of ECG, the uses of ECG to diagnose various heart conditions, the electrocardiographic grid and its components, the different ECG leads, the normal waves of an ECG, and the significance of ECG in accurately assessing the function of the heart's auricles and ventricles.
What is electrocardiogram (ECG)
An ECG (electrocardiogram) records the electrical activity of your heart at rest. It provides information about your heart rate and rhythm and shows if there is an enlargement of the heart due to high blood pressure (hypertension) or evidence of a previous heart attack (myocardial infarction).
Questions and Answers related to ECG and illustration. Short assignment with diagram and images
Presentation on Cardiac monitoring
Cardiac monitoring generally refers to continuous or intermittent monitoring of heart activity, generally by electrocardiography, with assessment of the patient's condition relative to their cardiac rhythm.
ECG
This document provides an overview of electrocardiography (ECG). It defines ECG as the study of the electrical activity of the heart muscles using an electrocardiograph. It describes the anatomy of the heart including its four chambers, four valves, three layers, blood vessels, and dual circulation systems. It also explains the different ECG lead systems including standard bipolar limb leads, augmented unipolar limb leads, and chest leads. Finally, it outlines the basic components of an ECG recording setup including defibrillator protection, lead selection logic, calibration, pre-amplification, power amplification, feedback, and output display.
12 lead electrocardiogram
learn how to obtain an ECG, anyone can do it:
This presentation aims to show the clinical process of obtaining an ECG and features some tips and suggestions to troubleshoot and improve the quality of the tracing.
Please note that you're welcome to use any slides as long as you reference my post when you do so to maintain the integrity of authorship
If interested in detailed answers, please email: aamirdash@yahoo.com
Thanks, Ahmad
Ecg ppt
Electrocardiography (ECG or EKG) is the process of recording the electrical activity of the heart over time using electrodes placed on a patient's body. These electrodes detect tiny electrical changes on the skin arising from the heart muscle during each heartbeat. The ECG traces the heart's electrical activity through the various conduction pathways and different deflections in the tracing correspond to atrial and ventricular depolarization and repolarization. A normal ECG tracing shows the P wave, QRS complex and T wave and time intervals can provide information on heart rate and conduction delays.
Electrical activity in the heart
An electrocardiogram (EKG/ECG) is a test that uses electrodes placed on the chest to detect and record the electrical activity of the heart. The EKG can show the heart's chambers, the pacemaker that initiates heartbeats, and the depolarization wave that causes the heart muscles to contract by removing the normal electrical distribution of cells before they recover to their resting state.
Electrocardiography
Electrocardiography (ECG or EKG) is a process that records and analyzes the electrical activity of the heart over time using electrodes placed on the skin. It was invented in 1903 by Dutch physician Willem Einthoven, who received the Nobel Prize for his creation. A standard ECG uses 10 electrodes placed in specific locations on the limbs and chest to detect electrical signals produced during each heartbeat. The signals are interpreted by an ECG machine to analyze heart rate, rhythms, and for signs of conditions like heart attacks, damage, or defects. An ECG can provide important information about the structure and function of the heart.
Ecg123
An ECG records the electrical activity of the heart to check for problems with heart rhythm, conduction, or damage. It uses electrodes to detect tiny voltage changes on the skin caused by heart muscle depolarization during each heartbeat. The signals are very small so they must be amplified and filtered to remove noise. Differential amplifiers are used to amplify the signal without amplifying common mode noise. Band stop filters then remove power line interference and other noise. An ECG can provide information on heart rate, rhythm, and prior damage to assess heart health and the effects of medications.
Ecg basics electric activity within heart
The document discusses the basics of electrocardiograms (ECGs) including:
1) It describes how electrical signals are conducted through the heart starting from the sinoatrial node and traveling to the atria and ventricles.
2) It explains the phases of the cardiac action potential including depolarization, repolarization, and how this generates the ECG.
3) It shows diagrams of how electrode placements on the body affect the amplitude and direction of deflections recorded on an ECG.
Denoising of ECG -- A discrete time approach using DWT
This paper is about denoising of ECG signal using DWT transform. In this paper, ECG signals are denoised using DWT transform.Ecg signals are taken and noise at different frequencies are generated which are superimposed on this original ecg signal.High frequency noise is of 4000 hertz and power line interference is of 50 hertz.Decomposition of noisy signal is achieved through wavelet packet .wavelet packets are reconstructed and appropriate wavelet packets are combined to obtain a signal, very similar to original ecg signal.This technique results in the minimization of mean square error in the filtered signals.
Procedure of Recording ECG
It's procedure of recording ECG for Nursing Students.
It is helpful content for GNM 2nd Year & B.Sc.N. 2nd Year Students.
Ecg made easy ppt
The document provides guidance on performing and interpreting 12-lead electrocardiograms (ECGs). It outlines the proper procedure for applying electrodes, including skin preparation and placement of limb and chest leads. Key aspects that must be checked include verifying the leads are attached correctly, the ECG is free of artifact, and identifying any critical findings such as arrhythmias or ST segment changes. Interpreting the ECG requires evaluating the rhythm, measuring the heart rate, identifying normal and abnormal waveforms, and relating findings to the patient's condition.
4.ecg
This document provides an overview of electrocardiograms (ECGs). It discusses the conduction system of the heart and electrophysiology. It then covers the basics of ECGs, including definitions, electrodes, leads, and waves/intervals. It explains how to interpret and analyze ECG papers by examining rate, rhythm, axis, P wave, PR interval, QRS complex, ST segment, T wave, and QT interval. Finally, it lists some common abnormalities that can be identified, such as issues with rate, rhythm, axis, conduction, and signs of ischemia.
What's hot (19)
Denoising of ECG -- A discrete time approach using DWT
Denoising of ECG -- A discrete time approach using DWT
Viewers also liked
Muscular physiology
Muscle physiology studies muscle function including development, structure, contraction and strength building. A muscle is a bundle of fibers that contract to produce movement, posture and heat. Muscle contractions are caused by nerve impulses that cause calcium ions to be released, activating cross bridges between actin and myosin fibers and causing the muscle to shorten. The sliding filament theory explains muscle contraction through the overlapping and sliding of the actin and myosin filaments.
Muscular Physiology
Skeletal muscles provide movement through contractions, generate heat through catabolism, and maintain posture through partial contractions. Muscles are excitable through nerve signals and use structures like myofibrils, sarcomeres, and troponin to generate force through the sliding filament theory when calcium ions bind during excitation and relax when calcium ions unbind. Different fiber types allow for specialized functions in sprinters versus marathon runners.
Muscular physiology (2)
1) Muscle physiology studies the physical, mechanical, and biochemical aspects of muscles in development, fiber structure, muscle structure, contraction, and strength-building.
2) Skeletal muscles provide movement by contracting in response to nerve signals, prevent unwanted movement through posture, and generate heat as a byproduct of the chemical reactions of muscle contraction.
3) The structure of the myofilaments, which are the force-generating actin and myosin proteins, allows for their function in muscle contraction. The overlapping actin and myosin filaments form hexagonal networks that slide inward upon one another, pulling the muscle fibers shorter.
The lower extremity1
The upper and lower extremities of humans are homologous, having a common evolutionary origin and basic plan, but profound changes in function have led to significant differences between them. The lower extremity includes bones like the pelvis, femur, tibia, fibula, tarsals, metatarsals, and phalanges, while the upper extremity contains analogous bones like the shoulder girdle, humerus, radius, ulna, carpals, metacarpals and finger phalanges.
Blood typing analysis
This document analyzes blood typing results from 4 patients (Mrs. Smith, Mr. Jones, Mr. Green, and Ms. Brown). It provides their results for testing with anti-A serum, anti-B serum, and anti-Rh serum. It then asks questions about determining blood types from the results and situations involving blood typing and transfusions. Key points covered include blood type O being a universal donor and the potential benefits of an Rh vaccination to prevent erythroblastosis fetalis in newborns.
Jhnhh
This 3 sentence summary provides the essential information from the document:
The document discusses blood typing labs 1 through 5. It lists 4 students - Megan corradino, Joanna smith, Zach Searle, and Nathan tisch - who are working on the labs along with a 5th student, Katherine Garcia. The document serves as an introduction to blood typing labs being conducted by these 5 students.
The lower extremity1
The upper and lower extremities of humans are homologous, having a common evolutionary origin and basic plan, but their functions have diverged considerably over time. The lower extremity includes bones such as the pelvis (ilium, ischium, pubis), femur, patella, tibia, fibula, tarsals, metatarsals, and phalanges. Differences in the shapes of male and female pelvises allow anthropologists to determine the sex of skeletal remains.
Muscular physiology
This document discusses various topics related to muscle physiology, including:
- The three types of muscle tissue and their differences
- How calcium ions trigger muscle contraction and relaxation
- The "sliding filament" theory of muscle contraction
- Aerobic vs. anaerobic metabolism in muscle during exercise
- Motor units and their role in fine vs. gross muscle movements
- Factors that influence muscle strength
- Phases of a muscle twitch contraction
- Rigor mortis and the Treppe effect on athlete warmups
Muscle physiology in orthodontics/certified fixed orthodontic courses by Ind...
Muscle physiology in orthodontics/certified fixed orthodontic courses by Ind...Indian dental academy
The Indian Dental Academy is the Leader in continuing dental education , training dentists in all aspects of dentistry and
offering a wide range of dental certified courses in different formats.for more details please visit
www.indiandentalacademy.comMuscle physiology /certified fixed orthodontic courses by Indian dental acad...
Muscle physiology /certified fixed orthodontic courses by Indian dental acad...Indian dental academy
Welcome to Indian Dental Academy
The Indian Dental Academy is the Leader in continuing dental education , training dentists in all aspects of dentistry and offering a wide range of dental certified courses in different formats.
Indian dental academy has a unique training program & curriculum that provides students with exceptional clinical skills and enabling them to return to their office with high level confidence and start treating patients
State of the art comprehensive training-Faculty of world wide repute &Very affordable.Muscle physiology in orthodontics
The Indian Dental Academy is the Leader in continuing dental education , training dentists in all aspects of dentistry and
offering a wide range of dental certified courses in different formats.for more details please visit
www.indiandentalacademy.com
Ch1 (3 18)
The document discusses muscle physiology, including the sliding filament theory of muscle contraction. It explains that calcium released from the sarcoplasmic reticulum upon neural stimulation causes myofibril tension development. Muscle contraction occurs through calcium-dependent myosin cross-bridge cycling with actin filaments. Fast-twitch muscle fibers can produce higher forces than slow-twitch fibers, especially at higher velocities. Force production is determined by the number of attached cross-bridges between actin and myosin filaments.
Orofacial development
1. The cranial end of the embryo folds first due to the rapid growth of the brain, forming the primitive oral cavity and stomatodeum.
2. The face develops from five mesodermal elevations called processes that are augmented by neural crest cells and lined with ectoderm. These include the frontonasal process, two maxillary processes, and two mandibular processes.
3. The frontonasal process forms the forehead and nose. The maxillary processes form parts of the upper lip, cheek, and palate. The mandibular processes merge to form the lower lip and chin.
Relationship between orofacial muscles function and malocclusion
This document discusses the relationship between muscle function and malocclusion. It states that malocclusion results from an imbalance or disequilibrium between genetic, developmental, functional and environmental factors. Certain muscle functions like tongue thrust swallowing, mouth breathing, thumb sucking, lip biting and neurological conditions can directly cause malocclusions or the muscles change in a compensatory way. Different malocclusions like class II div 1 and 2, and class III have characteristic muscle pathologies. Treatment involves addressing the underlying muscle imbalances through myofunctional therapy or orthodontics to restore the dental equilibrium.
Muscle Physiology Primer
This document provides an overview of muscle and neural physiology, covering topics such as gross muscle structure, microstructure, muscle contractions, and factors that affect force production. It describes the layers that make up muscle tissue from the epimysium on the outside to the endomysium surrounding each muscle fiber. On the microscopic level, it details the components of the sarcomere including actin, myosin, and proteins involved in muscle contraction. It explains the sliding filament theory of muscle contraction and types of contractions. Factors discussed that can influence force production include cross-sectional area, velocity of shortening, angle of pennation, sarcomere length, and muscle fiber type. The document also reviews research on muscle fiber
Muscles classification
This document summarizes the key properties and functions of the three main types of muscle tissue: skeletal, cardiac, and smooth muscle. It describes their locations, structures, contraction mechanisms, and functions. Skeletal muscle is striated and voluntary, attaching to bones via tendons to enable movement. Cardiac muscle is also striated and pumps blood throughout the body. Smooth muscle is non-striated and involuntary, found in organs to enable processes like digestion. The document provides detailed descriptions of muscle fibers, sarcomeres, calcium handling, and more.
Nerve Muscle Physiology
This document provides information on nerve muscle physiology. It discusses the structure and function of nerves, neurons, and muscles. It explains how nerve signals trigger action potentials in muscles, causing contraction. It describes the sliding filament theory of muscle contraction and different types of muscle fibers. Stimulation methods like strength duration curves are discussed to assess denervated and healthy muscles. Electrical stimulation can aid tissue repair by mimicking the body's natural current of injury.
Viewers also liked (18)
Muscle physiology in orthodontics/certified fixed orthodontic courses by Ind...
Muscle physiology in orthodontics/certified fixed orthodontic courses by Ind...
Muscle physiology /certified fixed orthodontic courses by Indian dental acad...
Muscle physiology /certified fixed orthodontic courses by Indian dental acad...
Relationship between orofacial muscles function and malocclusion
Relationship between orofacial muscles function and malocclusion
Similar to Ekg
Ekg
An electrocardiogram (EKG or ECG) records the electrical activity of the heart over time. The main components of a heartbeat are labeled P, Q, R, S, and T waves. The P wave represents electrical activity spreading through the atria, while the QRS complex represents ventricular activation. The T wave occurs as the ventricles recover. By examining intervals between these waves, as well as their presence, shape, and consistency, doctors can detect disorders like abnormal heart rhythms or damage to heart muscle tissue. In this experiment, students will record their own EKG, identify the wave components, and calculate their heart rate. They will also compare EKGs recorded from different electrode placements on the arms
Experiment 3
An electrocardiogram (EKG or ECG) records the electrical activity of the heart over time. It shows different wave components including the P wave, QRS complex, and T wave that are associated with different events in the cardiac cycle. By analyzing the timing and appearance of these waves, healthcare professionals can detect abnormalities that may indicate disorders like arrhythmias, heart attacks, or damage to heart muscle tissue. This experiment uses an EKG sensor to record a subject's heartbeat and analyze the timing of waves to determine heart rate and the direction of electrical conduction in the ventricles.
Ekg lab
The document discusses electrocardiograms (EKGs) and how they are used to analyze the electrical activity of the heart. It provides the following key points:
- An EKG records the electrical events in the heart as it beats, showing the natural conduction pathways and contractions of the atria and ventricles.
- The different waves in an EKG (P, QRS, T) represent different stages of the heartbeat and electrical conduction through the heart.
- Doctors can examine an EKG to check for abnormalities that may indicate heart conditions like arrhythmias, damage to heart muscle tissue, or heart attacks.
- In this experiment, students will record their own EKG, identify
Lab 3
An electrocardiogram (EKG or ECG) records the electrical activity of the heart over time. It shows different wave components including the P wave, QRS complex, and T wave that represent the spread of electrical impulses through the heart's chambers and their contraction and relaxation. By analyzing the timing and appearance of these waves, doctors can detect abnormalities that may indicate heart conditions. In this experiment, students will use an EKG sensor to record their own heart activity, identify the wave components, and calculate their heart rate. They will also compare recordings from standard and alternate lead placements.
Ekg lab 3
This document discusses electrocardiograms (EKGs) and how they are used to analyze the electrical activity of the heart. It provides the following key points:
1. An EKG records the electrical signals produced by the heart during each beat and can be used to determine heart rate and identify any abnormalities.
2. The main components of an EKG waveform are labeled P, Q, R, S, and T and correspond to different stages of electrical conduction through the heart.
3. Doctors can examine EKG tracings to diagnose conditions like arrhythmias, heart attacks, or damage to heart muscle based on changes in waveforms and timing of intervals between components.
Ekg experiment 3
The document discusses electrocardiograms (EKGs) and how they are used to analyze the electrical activity of the heart. It provides the following key points:
- An EKG records the electrical events in the heart as it beats, showing the natural conduction pathways and contractions of the atria and ventricles.
- The different waves in an EKG (P, QRS, T) represent different stages of the heartbeat and can indicate heart conditions if abnormal.
- By placing electrodes in different positions, additional information can be gleaned from EKG tracings about the direction of electrical activity in the heart.
- Doctors can analyze EKG tracings for abnormalities that may indicate conditions like
Ekg
The document discusses electrocardiograms (EKGs) and how they are used to analyze the electrical activity of the heart. It provides the following key points:
1. An EKG records the electrical signals produced by the heart during each beat and can be used to identify components like the P, QRS, and T waves that correspond to different phases of the heartbeat.
2. Abnormalities in the shape, timing, or presence of these components can provide clues about potential heart conditions like arrhythmias, damage to heart muscle, or blockages.
3. The experiment involves using EKG sensors to record a subject's heartbeat over time, identifying the normal waveform components and calculating heart rate,
Ekg
The document discusses electrocardiograms (EKGs) and how they are used to analyze the electrical activity of the heart. It provides the following key points:
1) An EKG records the electrical signals produced by the heart during each beat and can be used to identify components like the P, QRS, and T waves that correspond to different phases of the heartbeat.
2) Abnormalities in the shape, timing, or presence of these components can provide clues about potential heart conditions like arrhythmias, damage to heart muscle, or blockages.
3) The experiment involves using EKG sensors to record a subject's heartbeat over time, identifying the normal waveform components and calculating heart rate,
Ekg lab exp 3
The document discusses electrocardiograms (EKGs) and how they are used to analyze the electrical activity of the heart. It provides the following key points:
- An EKG records the electrical signals produced by the heart during each beat and can be used to detect disorders.
- The main components of a heart beat seen on an EKG are labeled P, Q, R, S, and T waves. Each component represents a different stage of the heartbeat.
- By analyzing the timing and shapes of these components, doctors can identify issues like abnormal heart rhythms, damage to heart muscle, or blockages in the heart's electrical pathways.
- The document describes procedures for students to record their
ecg machine
An electrocardiogram (ECG) records the electrical activity of the heart. Small metal electrodes are attached to the skin on the arms, legs, and chest to detect electrical impulses from the heart. The ECG machine amplifies and records these impulses, showing normal and abnormal heart rhythms and any signs of heart damage or disease. A normal ECG tracing shows the P wave, QRS complex, and T wave representing atrial and ventricular contractions and repolarizations. The ECG test takes about five minutes and is painless.
ECG - Definition and Measurement techniques .pdf
Electrocardiogram
-Introduction
-Need for measurement
-How to be measured
-Principle of Measurement
-Lead Placements
-Reduce Art
ECG is used to record the electrical activity of the heart from different angles to both identify and locate pathology. Electrodes are placed on different parts of a patient’s limbs and chest to record the electrical activity.
#ECG
#Electrocardiogram
#Electrocardiograph
#Biomeical
#Cardiac
#Cardiac Monitoring
#12 lead system
#ECG Measurement
#Online
#Study material
#Concept
Ieeepro techno solutions ieee 2013 embedded project a review on design of ...
LATEST IEEE PROJECTS, 2016 IEEE PROJECTS, IEEE Projects in Chennai, Engineering Projects, Engineering IEEE Projects, Final Year Projects, Final Year IEEE Projects, IEEE Projects 2015 - 2016. 2016 IEEE projects, 2016 IEEE java projects, 2016 IEEE Dotnet projects, 2016 IEEE .net projects,IEEE Projects, IEEE Projects 2016 ,IEEE Academic Projects, IEEE 2016 Projects, IEEE, IEEE Projects, IEEE Software Projects, Latest IEEE Projects,IEEE Student Projects, IEEE Final year Student Projects,Final Year Projects, final year IEEE 2016 projects, final year 2016 projects,ENGINEERING PROJECTS, MCA projects, BE projects, Embedded Projects, JAVA projects, J2EE projects, .NET projects, Students projects,BE projects, B.Tech. projects, ME projects, M.Tech. projects, M.Phil Projects.
ECG interpretation: Echocardiography and Cardiac Catherization.pptx
The document provides an overview of three cardiac diagnostic tests:
1) Electrocardiography (ECG) which records heart electrical activity and can detect issues like ischemia. Key components of the ECG like the P wave, QRS complex, and T wave are explained.
2) Echocardiography which uses ultrasound to image heart structures and function. Doppler echocardiography evaluates blood flow. Stress echocardiography combines the test with exercise or drugs.
3) Cardiac catheterization involves threading a catheter into the heart to measure pressures and perform angiograms by injecting contrast dye to image arteries. It is used to assess coronary artery disease.
Ecg recording basic interpretation e learning 2
1. The document provides instructions on how to navigate an online learning module on electrocardiogram (ECG) recording and interpretation. It explains how to access the test, maximize or minimize the sidebar menu, and save progress by clicking the home icon.
2. The document then covers the basics of ECGs, including how they work, the electrical pathways in the heart, normal ECG wave patterns, electrode placement for recording, and examples of normal and some abnormal ECG readings.
3. Finally, it reminds the learner to click the home icon after finishing the test to save results and complete the learning module.
ANALYSIS OF ECG SIGNAL USING SELF ORGANISING MAP
ANALYSIS OF ECG SIGNAL USING SELF ORGANISING MAP and result of ANALYSIS OF ECG SIGNAL USING SELF ORGANISING MAP
Cardiac monitoring.pdf
The cardiac monitor displays cardiovascular waveforms and measurements at a patient's bedside. It continuously monitors the electrocardiogram and can also show oxygen saturation, blood pressure, and other parameters. Electrodes are attached to the patient's skin to detect electrical signals. The monitor allows for prompt treatment in response to any changes outside normal ranges. It is commonly used in emergency rooms and critical care units to continuously observe multiple patients.
Shortcut to ECG
Salient features of the book are -
- The book provides a shortcut to understand and remember certain specific formulae and points you require to interpret the 12-lead ECG.
- Treatment protocols (in green boxes) for most of the important conditions are also included.
- View sample ECGs as you read along the topics.
- The content is explained in a very simple language to provide good conceptions, written from a student’s point of view.
- People can gain their belief in the book after going through sample ECGs which would be available at www.themedicalpost.net/ecg
- The book competes with the other books available in the market in simplicity, summaries, treatment protocols, live diagrams and regularly updated sample ECGs on the website.
Ppt recording on ecocardiogram
ecg a graphical recording of electrical activity oof the heart detected by means of surface electrode measured by using a galvanometer.
Designing a 3-Lead Cost Effective ECG Recording Glove for Home Monitoring
The EKG Glove is a wearable glove-based device on which all the necessary electrodes are pre-positioned hence the patient simply inserts his right hand into the glove and properly position the glove his chest to
record a standard ECG. It is the first, lead wire free, simultaneous, and fully diagnostic ECG recording
system in Pakistan with easy, natural and almost automatic placement of the electrodes, hence eliminating the difficulty of lead wire entanglement and electrode misplacement.
DESIGNING A 3-LEAD COST EFFECTIVE ECG RECORDING GLOVE FOR HOME MONITORING
The EKG Glove is a wearable glove-based device on which all the necessary electrodes are pre-positioned hence the patient simply inserts his right hand into the glove and properly position the glove his chest to ecord a standard ECG. It is the first, lead wire free, simultaneous, and fully diagnostic ECG recording
system in Pakistan with easy, natural and almost automatic placement of the electrodes, hence eliminating the difficulty of lead wire entanglement and electrode misplacement.
Similar to Ekg (20)
Ieeepro techno solutions ieee 2013 embedded project a review on design of ...
Ieeepro techno solutions ieee 2013 embedded project a review on design of ...
ECG interpretation: Echocardiography and Cardiac Catherization.pptx
ECG interpretation: Echocardiography and Cardiac Catherization.pptx
Designing a 3-Lead Cost Effective ECG Recording Glove for Home Monitoring
Designing a 3-Lead Cost Effective ECG Recording Glove for Home Monitoring
DESIGNING A 3-LEAD COST EFFECTIVE ECG RECORDING GLOVE FOR HOME MONITORING
DESIGNING A 3-LEAD COST EFFECTIVE ECG RECORDING GLOVE FOR HOME MONITORING
More from mc1726bn
Thriiive
The document outlines the topics and lessons to be covered over 4 weeks in an equipping class for girls. Week 1 introduces thriving and what it means to blossom and flourish. Weeks 2-3 focus on the importance of knowing the truth and distinguishing it from lies. Common lies people believe about themselves will be addressed, along with scriptural truths that counter each lie. Girls will share lies they have believed and receive prayer and encouragement. Week 4 will wrap up the topic of identity in Christ and how to apply what they have learned in their daily lives.
Skelphysll
Cartilage is a specialized connective tissue containing cells called chondrocytes that secrete an extracellular matrix. There are three main types of cartilage - hyaline, elastic, and fibrocartilage - each with different compositions and locations in the body. Growth plate fractures often result from sprains and strains in growing children and involve the growth plates located at the ends of long bones.
Hartifact
The document discusses the endocrine and nervous systems. It provides information on 16 different endocrine glands and their hormone productions. Key endocrine glands discussed include the pituitary gland, thyroid gland, parathyroid gland, adrenal gland, pancreas, testes, ovaries, placenta, thymus, and heart. The endocrine system works through chemical messengers called hormones to help regulate processes in the body like growth, metabolism, sexual function, stress response, and fluid balance. The nervous system works faster than the endocrine system through nerve impulses to control behaviors and homeostasis.
Intro
This document outlines four categories to help understand different parts of the body: Where is it? presented as a newsletter, What are you made of? as a story book, How does it work? as a Jeopardy game, and What can I see? as a trivia game. All categories aim to help learn more about location, composition, and functioning of different body parts.
Table of contents
This document discusses 4 artifacts across multiple pages. Artifact 1 is discussed on pages 3-7 and focuses on the location of the artifact. Artifact 2 is examined on pages 8-12 and describes what the artifact is. Artifact 3 is analyzed on pages 13-66 and explores how the artifact works. Finally, artifact 4 is covered on pages 67-79 and looks at what can be seen with the artifact.
What is it made offinal1
The document lists and describes the main organelles found in cells including the nucleus, mitochondria, cell membrane, chloroplasts, and vacuoles. It also explains that the cell membrane is made of lipids with hydrophilic heads and hydrophobic tails that can self-repair, and contains integral membrane proteins that function in roles like cell signaling, enzymes, and transport. Additionally, it defines organic molecules as chemicals containing carbon and hydrogen while inorganic molecules do not contain carbon and are not of biological origin, providing examples such as ammonia and carbon dioxide.
Table of contents
This document discusses 4 artifacts across multiple pages. Artifact 1 is discussed on pages 3-7 and focuses on the location of the artifact. Artifact 2 is analyzed on pages 8-12 and describes what the artifact is. Artifact 3 is examined in depth on pages 13-66 by explaining how it works. Finally, artifact 4 is covered on pages 67-79 and explores what can be seen with the artifact.
Works cited1
The document lists 16 sources used in 4 artifacts related to anatomy and physiology. The sources include online articles, textbooks, and websites providing information on directional terms, organelles, epithelial and muscle tissues, and nervous tissue.
Into
This document outlines four categories for exploring what objects in the body are made of: where they are located described in a newsletter, their composition told as a storybook, how they work explained as a jeopardy game, and visible parts presented as a trivia game. All categories aim to help understand an object's location, materials, and functioning.
Jeopardy
This document contains a series of questions and answers about biological concepts related to cellular transport, metabolism, and reproduction. Some key topics covered include diffusion, osmosis, active transport, catabolism, anabolism, enzymes, transcription, translation, and the cell cycle phases of interphase and mitosis.
Tissue artifact
This document provides information about various tissues in the human body through matching exercises, puzzles, pictures and descriptions. It includes skeletal muscle tissue which moves and supports bones and is voluntarily controlled. Nervous tissue allows for rapid communication through the nervous system and neurons are its basic unit. Cardiac muscle tissue makes up the heart and contracts involuntarily under autonomic nervous system control.
Anatomy introduction newsletter13
The document discusses directional terms used to describe locations in the body. It states that directional terms describe one body structure's position relative to another, assuming the anatomical position. Superior means towards the upper part, inferior means towards the lower part, anterior means towards the front, posterior means towards the back, medial means towards the midline, and lateral means away from the midline. It provides an image showing examples of the different terms.
What is it made offinal
The document lists and describes the major organelles found in eukaryotic cells including the nucleus, mitochondria, chloroplasts, cell membrane, and cell wall. It then provides more detail on the cell membrane, describing its lipid bilayer structure and various protein components that span or are embedded within the membrane to carry out important functions. The document also defines organic molecules as chemicals containing carbon and hydrogen while inorganic molecules do not contain carbon and are not of biological origin, providing examples of each.
Tissue artifact
This document provides information about various tissues in the human body through matching exercises, puzzles, pictures and descriptions. It includes skeletal muscle tissue which moves and supports bones and is voluntarily controlled. Nervous tissue allows for rapid communication through the nervous system and neurons are its basic unit. Cardiac muscle tissue makes up the heart wall and contracts involuntarily under autonomic nervous system control.
Jeopardy
This document contains a series of questions and answers about biological concepts related to cellular transport, metabolism, and reproduction. Some key topics covered include diffusion, osmosis, active transport, catabolism, anabolism, enzymes, transcription, translation, and the cell cycle phases of interphase and mitosis.
What is it made offinal
The document discusses several key organelles found in cells including the nucleus, mitochondria, cell membrane, chloroplasts, and ribosomes. It also mentions several other organelles found in plant and animal cells like vacuoles, the endoplasmic reticulum, Golgi complex, and lysosomes. The cell membrane is composed of phospholipids with hydrophilic heads and hydrophobic tails that can self-repair. Membrane proteins have hydrophilic and hydrophobic regions to anchor in the membrane and carry out functions like transport and signaling. Organic molecules contain carbon and are involved in metabolism, ranging from small molecules to large macromolecules made of building blocks like amino acids and glucose. Inorganic molecules do not contain carbon and
Anatomy introduction newsletter12
The document discusses anatomical directional terms used to describe locations and positions of structures in the body. Superior means towards the upper part, inferior means towards the lower part, anterior means towards the front, posterior means towards the back, medial means towards the midline of the body, and lateral means away from the midline. Directional terms assume the body is standing with palms facing forward, which is called the anatomical position.
What is it made offinalwhat is it made of
The document lists and describes the major organelles found in eukaryotic cells including the nucleus, mitochondria, chloroplasts, cell membrane, and cell wall. It then provides more detail on the cell membrane, describing its lipid bilayer structure and various membrane-associated proteins that serve functions like cell surface receptors, enzymes, and transporters. Next, it defines organic molecules as chemicals containing carbon and hydrogen while macromolecules are large organic molecules composed of building blocks like glucose or amino acids. Finally, it defines inorganic molecules as any molecule not containing carbon that are not of biological origin, providing examples like ammonia, carbon dioxide, and sulphuric acid.
Anatomy introduction newsletter13
The document discusses directional terms used to describe locations of structures in the body. It defines eight directional terms - superior, inferior, anterior, posterior, medial, lateral, proximal, and distal - and provides examples of where each term refers to on a picture of a body. It also compares directional terms to a compass rose as a way to explain how the terms describe locations in relation to other structures.
More from mc1726bn (20)
Ekg
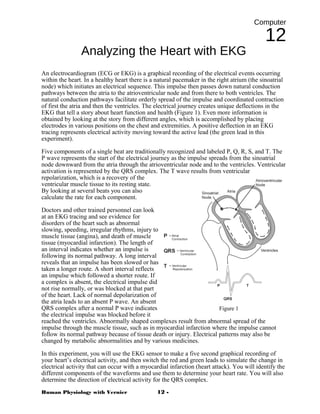
- 1. Computer 12 Analyzing the Heart with EKG An electrocardiogram (ECG or EKG) is a graphical recording of the electrical events occurring within the heart. In a healthy heart there is a natural pacemaker in the right atrium (the sinoatrial node) which initiates an electrical sequence. This impulse then passes down natural conduction pathways between the atria to the atrioventricular node and from there to both ventricles. The natural conduction pathways facilitate orderly spread of the impulse and coordinated contraction of first the atria and then the ventricles. The electrical journey creates unique deflections in the EKG that tell a story about heart function and health (Figure 1). Even more information is obtained by looking at the story from different angles, which is accomplished by placing electrodes in various positions on the chest and extremities. A positive deflection in an EKG tracing represents electrical activity moving toward the active lead (the green lead in this experiment). Five components of a single beat are traditionally recognized and labeled P, Q, R, S, and T. The P wave represents the start of the electrical journey as the impulse spreads from the sinoatrial node downward from the atria through the atrioventricular node and to the ventricles. Ventricular activation is represented by the QRS complex. The T wave results from ventricular repolarization, which is a recovery of the ventricular muscle tissue to its resting state. By looking at several beats you can also calculate the rate for each component. Doctors and other trained personnel can look at an EKG tracing and see evidence for disorders of the heart such as abnormal slowing, speeding, irregular rhythms, injury to muscle tissue (angina), and death of muscle tissue (myocardial infarction). The length of an interval indicates whether an impulse is following its normal pathway. A long interval reveals that an impulse has been slowed or has taken a longer route. A short interval reflects an impulse which followed a shorter route. If a complex is absent, the electrical impulse did not rise normally, or was blocked at that part of the heart. Lack of normal depolarization of the atria leads to an absent P wave. An absent QRS complex after a normal P wave indicates the electrical impulse was blocked before it reached the ventricles. Abnormally shaped complexes result from abnormal spread of the impulse through the muscle tissue, such as in myocardial infarction where the impulse cannot follow its normal pathway because of tissue death or injury. Electrical patterns may also be changed by metabolic abnormalities and by various medicines. In this experiment, you will use the EKG sensor to make a five second graphical recording of your heart’s electrical activity, and then switch the red and green leads to simulate the change in electrical activity that can occur with a myocardial infarction (heart attack). You will identify the different components of the waveforms and use them to determine your heart rate. You will also determine the direction of electrical activity for the QRS complex. Human Physiology with Vernier 12 - Figure 1
- 2. Analyzing the Heart with EKG OBJECTIVES In this experiment, you will ·1 Obtain graphical representation of the electrical activity of the heart over a period of time. ·1 Learn to recognize the different wave forms seen in an EKG, and associate these wave forms with activity of the heart. ·2 Determine the heart rate by determining the rate of individual wave forms in the EKG. ·1 Compare wave forms generated by alternate EKG lead placements. MATERIALS computer Vernier EKG Sensor Vernier computer interface electrode tabs Logger Pro PROCEDURE Part I Standard limb lead EKG 1. Connect the EKG Sensor to the Vernier computer interface. Open the file “12 Analyzing Heart EKG” from the Human Physiology with Vernier folder. 2. Attach three electrode tabs to your arms, as shown in Figure 2. Place a single patch on the inside of the right wrist, on the inside of the right upper forearm (distal to the elbow), and on the inside of the left upper forearm (distal to elbow). 3. Connect the EKG clips to the electrode tabs as shown in Figure 2. Sit in a relaxed position in a chair, with your forearms resting on your legs or on the arms of the chair. When you are properly positioned, have someone click to begin data collection. 4. Once data collection is finished, click and drag to highlight each interval listed in Table 1. Human Physiology with Vernier 12 - Figure 2
- 3. Analyzing the Heart with EKG Use Figure 3 as your guide when determining these intervals. Enter the Δx value of each highlighted area to the nearest 0.01 s in Table 1. This value can be found in the lower left corner of the graph. 5. Calculate the heart rate in beats/min using the EKG data. Record the heart rate to the nearest whole number in Table 1. 6. Store this run by choosing Store Latest Run from the Experiment menu. Part II Alternate limb lead EKG 7. Exchange the red and green EKG clips so that the green clip is now attached to the electrode tab on the left arm and the red clip is on the right arm. Sit in a relaxed position in a chair, with your forearms resting on your legs or on the arms of the chair. When you are properly positioned, have someone click to begin data collection. 8. Print or sketch the tracing for alternate limb lead placement only. Figure 3 ·P-R interval: time from the beginning of P wave to the start of the QRS complex ·QRS complex: time from Q deflection to S deflection ·Q-T interval: time from Q deflection to the end of the T ***The graph simply inverted along the X-axis Human Physiology with Vernier 12 -