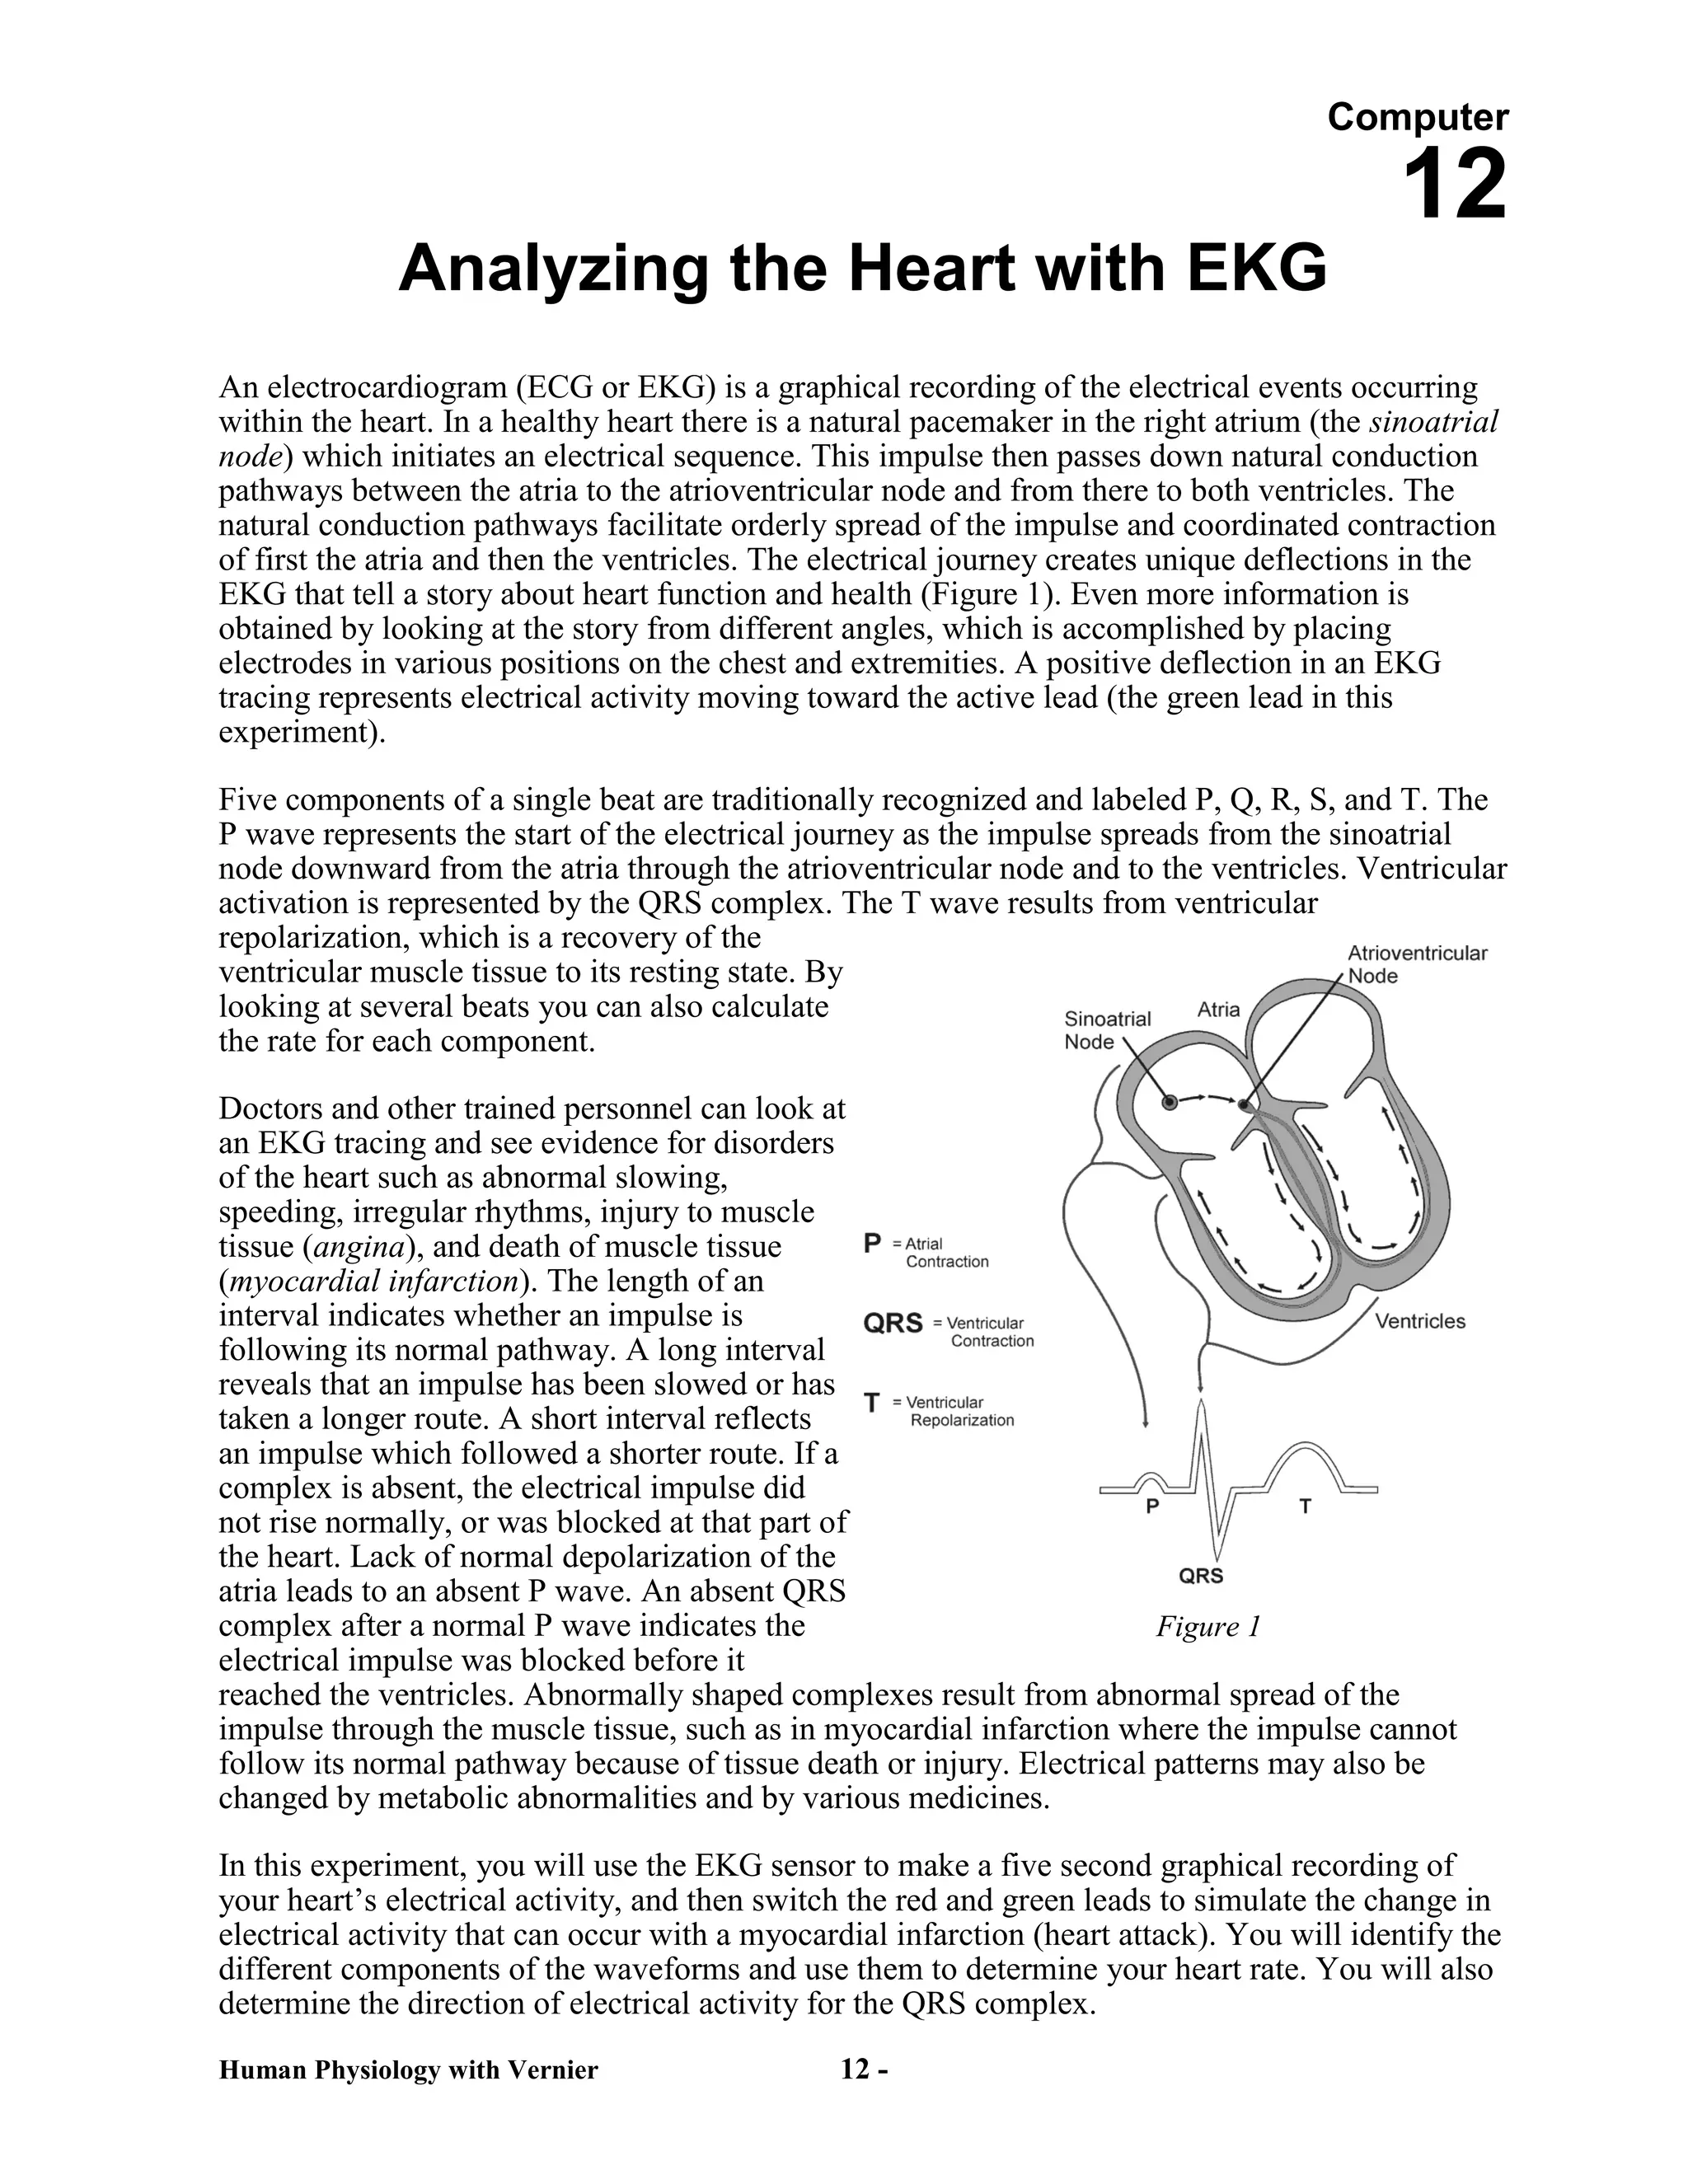
SlideShare a Scribd company logo
1 of 6
Download to read offline
Computer

                                                                                             12
              Analyzing the Heart with EKG
An electrocardiogram (ECG or EKG) is a graphical recording of the electrical events occurring
within the heart. In a healthy heart there is a natural pacemaker in the right atrium (the sinoatrial
node) which initiates an electrical sequence. This impulse then passes down natural conduction
pathways between the atria to the atrioventricular node and from there to both ventricles. The
natural conduction pathways facilitate orderly spread of the impulse and coordinated contraction
of first the atria and then the ventricles. The electrical journey creates unique deflections in the
EKG that tell a story about heart function and health (Figure 1). Even more information is
obtained by looking at the story from different angles, which is accomplished by placing
electrodes in various positions on the chest and extremities. A positive deflection in an EKG
tracing represents electrical activity moving toward the active lead (the green lead in this
experiment).

Five components of a single beat are traditionally recognized and labeled P, Q, R, S, and T. The
P wave represents the start of the electrical journey as the impulse spreads from the sinoatrial
node downward from the atria through the atrioventricular node and to the ventricles. Ventricular
activation is represented by the QRS complex. The T wave results from ventricular
repolarization, which is a recovery of the
ventricular muscle tissue to its resting state. By
looking at several beats you can also calculate
the rate for each component.

Doctors and other trained personnel can look at
an EKG tracing and see evidence for disorders
of the heart such as abnormal slowing,
speeding, irregular rhythms, injury to muscle
tissue (angina), and death of muscle tissue
(myocardial infarction). The length of an
interval indicates whether an impulse is
following its normal pathway. A long interval
reveals that an impulse has been slowed or has
taken a longer route. A short interval reflects
an impulse which followed a shorter route. If a
complex is absent, the electrical impulse did
not rise normally, or was blocked at that part of
the heart. Lack of normal depolarization of the
atria leads to an absent P wave. An absent QRS
complex after a normal P wave indicates the                             Figure 1
electrical impulse was blocked before it
reached the ventricles. Abnormally shaped complexes result from abnormal spread of the
impulse through the muscle tissue, such as in myocardial infarction where the impulse cannot
follow its normal pathway because of tissue death or injury. Electrical patterns may also be
changed by metabolic abnormalities and by various medicines.

In this experiment, you will use the EKG sensor to make a five second graphical recording of
your heart’s electrical activity, and then switch the red and green leads to simulate the change in
electrical activity that can occur with a myocardial infarction (heart attack). You will identify the
different components of the waveforms and use them to determine your heart rate. You will also
determine the direction of electrical activity for the QRS complex.
Human Physiology with Vernier                    12 -
Analyzing the Heart with EKG

OBJECTIVES
In this experiment, you will
    Obtain graphical representation of the electrical activity of the heart over a period of time.
    Learn to recognize the different wave forms seen in an EKG, and associate these wave
     forms with activity of the heart.
    Determine the heart rate by determining the rate of individual wave forms in the EKG.
    Compare wave forms generated by alternate EKG lead placements.


MATERIALS
       computer                                          Vernier EKG Sensor
       Vernier computer interface                        electrode tabs
       Logger Pro


PROCEDURE
Part I Standard limb lead EKG

1. Connect the EKG Sensor to the Vernier computer interface. Open the file “12 Analyzing
   Heart EKG” from the Human Physiology with Vernier folder.
2. Attach three electrode tabs to your arms, as shown in Figure 2. Place a single patch on the


                                                                            Figure 2

   inside of the right wrist, on the inside of the right upper forearm (distal to the elbow), and on
   the inside of the left upper forearm (distal to elbow).
3. Connect the EKG clips to the electrode tabs as shown in Figure 2. Sit in a relaxed position in
   a chair, with your forearms resting on your legs or on the arms of the chair. When you are
   properly positioned, have someone click          to begin data collection.
Human Physiology with Vernier                                                                    12 -
Analyzing the Heart with EKG

4. Once data collection is finished, click and drag to highlight each interval listed in Table 1.
   Use Figure 3 as your guide when determining these intervals. Enter the x value of each
   highlighted area to the nearest 0.01 s in Table 1. This value can be found in the lower left
   corner of the graph.
5. Calculate the heart rate in beats/min using the EKG data. Record the heart rate to the nearest
   whole number in Table 1.
6. Store this run by choosing Store Latest Run from the Experiment menu.
Part II Alternate limb lead EKG
7. Exchange the red and green EKG clips so that the green clip is now attached to the electrode
   tab on the left arm and the red clip is on the right arm. Sit in a relaxed position in a chair,
   with your forearms resting on your legs or on the arms of the chair. When you are properly
   positioned, have someone click            to begin data collection.
8. Print or sketch the tracing for alternate limb lead placement only.


                                             Figure 3
   P-R interval:           time from the beginning of P wave to the start of the QRS complex
   QRS complex:            time from Q deflection to S deflection
   Q-T interval:           time from Q deflection to the end of the T


***The graph simply inverted along the X-axis


Human Physiology with Vernier                                                                   12 -
Analyzing the Heart with EKG


DATA
                                             Table 1

                       Interval                              Time (s)

                        P–R                                    0.15

                        QRS                                    0.1

                        Q–T                                    0.36

                        R–R                                    0.66


                  Heart Rate (bpm)                             96


                                             Table 2

                         Standard Resting Electrocardiogram Interval Times

                    P–R interval                  0.12 to 0.20 s

                    QRS interval                 less than 0.12 s

                    Q–T interval                  0.30 to 0.40 s


DATA ANALYSIS
1. Remember that a positive deflection indicates electrical activity moving toward the green
   EKG lead. Examine the two major deflections of a single QRS complex (R wave and S
   wave) in your EKG tracing from Part I of this experiment. According to this data, does
   ventricular depolarization proceed from right to left or left to right? How does your tracing
   from Part II confirm your answer?

By changing the placement of the positive and negative leads, the graph inverted along the x-
   axis, indication the current flow is the same as before, but it shows as being opposite

Human Physiology with Vernier                                                                   12 -
Analyzing the Heart with EKG


2. Health-care professionals ask the following questions when interpreting an EKG:

       Can all components be identified in each beat?
       Are the intervals between each component and each complex consistent?
       Are there clear abnormalities of any of the wave components?

      Using these questions as guides, analyze each of the following three-beat EKG tracings and
      record your conclusions in Table 3 (indicate presence or absence of the P wave, and whether
      other intervals and/or shapes are normal or abnormal). The first analysis (a) is done for you.

 a.                                                b.


 c.                                                d.


 e.                                                f.


 g.                                                h.


Human Physiology with Vernier                                                                    12 -
Analyzing the Heart with EKG

                                                Table 3

                   P Wave         PR Interval       QRS Interval      QRS Shape     T Wave Shape

  ECG     Beat   Pres.   Abs.   Nml.   Abs./Abn.   Nml.   Abs./Abn.   Nml.   Abn.   Nml.   Abs./Abn.

           1      X              X                  X                  X             X

    a      2      X              X                  X                  X             X
           3      X                       X                  X                X               X
           1       x             x                  x                         x      x

    b      2       x             x                  x                         x      x
           3       x             x                  x                         x      x
           1              x               x         x                         x      x

    c      2              x               x         x                         x      x
           3              x               x         x                         x      x
           1       x             x                  x                  x             x

    d      2       x             x                  x                  x             x
           3       x             x                           x                x               x
           1              x               x         x                         x      x

    e      2       x             x                  x                         x      x
           3       x             x                  x                         x      x
           1       x             x                           x                x               x

    f      2       x             x                           x                x               x
           3       x             x                           x                x               x
           1       x             x                  x                  x             x

    g      2       x             x                  x                  x             x
           3              x               x                  x                x               x
           1              x      x                  x                  x             x

    h      2              x      x                  x                  x             x
           3              x      x                  x                  x             x


Human Physiology with Vernier                                                                     12 -

More Related Content

Similar to Ekg

ECG analysis part (1) \ Mohammad Al-me`ani. , MSN, RN.
ECG analysis part (1) \ Mohammad  Al-me`ani. , MSN, RN. ECG analysis part (1) \ Mohammad  Al-me`ani. , MSN, RN.
ECG analysis part (1) \ Mohammad Al-me`ani. , MSN, RN. almaani
 
topic ECG and heart diseases+treatments
topic ECG and heart diseases+treatmentstopic ECG and heart diseases+treatments
topic ECG and heart diseases+treatmentsmariarani2
 
ECG - Definition and Measurement techniques .pdf
ECG - Definition and Measurement techniques .pdfECG - Definition and Measurement techniques .pdf
ECG - Definition and Measurement techniques .pdfSathish M
 
Ecg interpretations
Ecg interpretationsEcg interpretations
Ecg interpretationsHari Nagar
 
ELECTROCARDIOGRAM BASIC
ELECTROCARDIOGRAM BASICELECTROCARDIOGRAM BASIC
ELECTROCARDIOGRAM BASICDr Nilesh Kate
 
Electrocardiography
ElectrocardiographyElectrocardiography
ElectrocardiographyRupesh Kumar
 
Electrocardiogram (ECG) / ECG interpretation
Electrocardiogram (ECG) / ECG interpretationElectrocardiogram (ECG) / ECG interpretation
Electrocardiogram (ECG) / ECG interpretationRahul Jaga
 

Similar to Ekg (20)

Lab 3
Lab 3Lab 3
Lab 3
 
Experiment 3
Experiment 3Experiment 3
Experiment 3
 
Ekg
EkgEkg
Ekg
 
Ekg
EkgEkg
Ekg
 
Ekg.exp.3
Ekg.exp.3Ekg.exp.3
Ekg.exp.3
 
Ekg
EkgEkg
Ekg
 
ECG analysis part (1) \ Mohammad Al-me`ani. , MSN, RN.
ECG analysis part (1) \ Mohammad  Al-me`ani. , MSN, RN. ECG analysis part (1) \ Mohammad  Al-me`ani. , MSN, RN.
ECG analysis part (1) \ Mohammad Al-me`ani. , MSN, RN.
 
topic ECG and heart diseases+treatments
topic ECG and heart diseases+treatmentstopic ECG and heart diseases+treatments
topic ECG and heart diseases+treatments
 
ecg machine
ecg machineecg machine
ecg machine
 
Ecg part i
Ecg part iEcg part i
Ecg part i
 
Ecg ppp.pptx 2
Ecg ppp.pptx 2Ecg ppp.pptx 2
Ecg ppp.pptx 2
 
ECG - Definition and Measurement techniques .pdf
ECG - Definition and Measurement techniques .pdfECG - Definition and Measurement techniques .pdf
ECG - Definition and Measurement techniques .pdf
 
Ecg interpretation
Ecg interpretation Ecg interpretation
Ecg interpretation
 
Interpreting ecg
Interpreting ecgInterpreting ecg
Interpreting ecg
 
Ecg interpretations
Ecg interpretationsEcg interpretations
Ecg interpretations
 
ECG
ECGECG
ECG
 
ELECTROCARDIOGRAM BASIC
ELECTROCARDIOGRAM BASICELECTROCARDIOGRAM BASIC
ELECTROCARDIOGRAM BASIC
 
Electrocardiography
ElectrocardiographyElectrocardiography
Electrocardiography
 
8101222.ppt
8101222.ppt8101222.ppt
8101222.ppt
 
Electrocardiogram (ECG) / ECG interpretation
Electrocardiogram (ECG) / ECG interpretationElectrocardiogram (ECG) / ECG interpretation
Electrocardiogram (ECG) / ECG interpretation
 

More from zs4033bn

Lungs volumes and capacities
Lungs volumes and capacitiesLungs volumes and capacities
Lungs volumes and capacitieszs4033bn
 
Blood typing analysis
Blood typing analysisBlood typing analysis
Blood typing analysiszs4033bn
 
Muscular physiology artifact
Muscular physiology artifactMuscular physiology artifact
Muscular physiology artifactzs4033bn
 
Virtual disection artifact
Virtual disection artifactVirtual disection artifact
Virtual disection artifactzs4033bn
 
Hormones artifact!
Hormones artifact!Hormones artifact!
Hormones artifact!zs4033bn
 
Hormones artifact!
Hormones artifact!Hormones artifact!
Hormones artifact!zs4033bn
 
Balance for artifact
Balance for artifactBalance for artifact
Balance for artifactzs4033bn
 
Fight or flee artifact
Fight or flee artifactFight or flee artifact
Fight or flee artifactzs4033bn
 
Nervous system Magazine 1
Nervous system Magazine 1Nervous system Magazine 1
Nervous system Magazine 1zs4033bn
 
What is it made of
What is it made ofWhat is it made of
What is it made ofzs4033bn
 
Newspaper anatomy revised
Newspaper anatomy revisedNewspaper anatomy revised
Newspaper anatomy revisedzs4033bn
 
Anatomy powerpoint 1
Anatomy powerpoint 1Anatomy powerpoint 1
Anatomy powerpoint 1zs4033bn
 
Anatomy powerpoint 2
Anatomy powerpoint 2Anatomy powerpoint 2
Anatomy powerpoint 2zs4033bn
 
What is it made of? Artifact
What is it made of? ArtifactWhat is it made of? Artifact
What is it made of? Artifactzs4033bn
 
What is it made of? Artifact
What is it made of? ArtifactWhat is it made of? Artifact
What is it made of? Artifactzs4033bn
 
Where is it? Artifact
Where is it? ArtifactWhere is it? Artifact
Where is it? Artifactzs4033bn
 

More from zs4033bn (16)

Lungs volumes and capacities
Lungs volumes and capacitiesLungs volumes and capacities
Lungs volumes and capacities
 
Blood typing analysis
Blood typing analysisBlood typing analysis
Blood typing analysis
 
Muscular physiology artifact
Muscular physiology artifactMuscular physiology artifact
Muscular physiology artifact
 
Virtual disection artifact
Virtual disection artifactVirtual disection artifact
Virtual disection artifact
 
Hormones artifact!
Hormones artifact!Hormones artifact!
Hormones artifact!
 
Hormones artifact!
Hormones artifact!Hormones artifact!
Hormones artifact!
 
Balance for artifact
Balance for artifactBalance for artifact
Balance for artifact
 
Fight or flee artifact
Fight or flee artifactFight or flee artifact
Fight or flee artifact
 
Nervous system Magazine 1
Nervous system Magazine 1Nervous system Magazine 1
Nervous system Magazine 1
 
What is it made of
What is it made ofWhat is it made of
What is it made of
 
Newspaper anatomy revised
Newspaper anatomy revisedNewspaper anatomy revised
Newspaper anatomy revised
 
Anatomy powerpoint 1
Anatomy powerpoint 1Anatomy powerpoint 1
Anatomy powerpoint 1
 
Anatomy powerpoint 2
Anatomy powerpoint 2Anatomy powerpoint 2
Anatomy powerpoint 2
 
What is it made of? Artifact
What is it made of? ArtifactWhat is it made of? Artifact
What is it made of? Artifact
 
What is it made of? Artifact
What is it made of? ArtifactWhat is it made of? Artifact
What is it made of? Artifact
 
Where is it? Artifact
Where is it? ArtifactWhere is it? Artifact
Where is it? Artifact
 

Ekg

  • 1. Computer 12 Analyzing the Heart with EKG An electrocardiogram (ECG or EKG) is a graphical recording of the electrical events occurring within the heart. In a healthy heart there is a natural pacemaker in the right atrium (the sinoatrial node) which initiates an electrical sequence. This impulse then passes down natural conduction pathways between the atria to the atrioventricular node and from there to both ventricles. The natural conduction pathways facilitate orderly spread of the impulse and coordinated contraction of first the atria and then the ventricles. The electrical journey creates unique deflections in the EKG that tell a story about heart function and health (Figure 1). Even more information is obtained by looking at the story from different angles, which is accomplished by placing electrodes in various positions on the chest and extremities. A positive deflection in an EKG tracing represents electrical activity moving toward the active lead (the green lead in this experiment). Five components of a single beat are traditionally recognized and labeled P, Q, R, S, and T. The P wave represents the start of the electrical journey as the impulse spreads from the sinoatrial node downward from the atria through the atrioventricular node and to the ventricles. Ventricular activation is represented by the QRS complex. The T wave results from ventricular repolarization, which is a recovery of the ventricular muscle tissue to its resting state. By looking at several beats you can also calculate the rate for each component. Doctors and other trained personnel can look at an EKG tracing and see evidence for disorders of the heart such as abnormal slowing, speeding, irregular rhythms, injury to muscle tissue (angina), and death of muscle tissue (myocardial infarction). The length of an interval indicates whether an impulse is following its normal pathway. A long interval reveals that an impulse has been slowed or has taken a longer route. A short interval reflects an impulse which followed a shorter route. If a complex is absent, the electrical impulse did not rise normally, or was blocked at that part of the heart. Lack of normal depolarization of the atria leads to an absent P wave. An absent QRS complex after a normal P wave indicates the Figure 1 electrical impulse was blocked before it reached the ventricles. Abnormally shaped complexes result from abnormal spread of the impulse through the muscle tissue, such as in myocardial infarction where the impulse cannot follow its normal pathway because of tissue death or injury. Electrical patterns may also be changed by metabolic abnormalities and by various medicines. In this experiment, you will use the EKG sensor to make a five second graphical recording of your heart’s electrical activity, and then switch the red and green leads to simulate the change in electrical activity that can occur with a myocardial infarction (heart attack). You will identify the different components of the waveforms and use them to determine your heart rate. You will also determine the direction of electrical activity for the QRS complex. Human Physiology with Vernier 12 -
  • 2. Analyzing the Heart with EKG OBJECTIVES In this experiment, you will  Obtain graphical representation of the electrical activity of the heart over a period of time.  Learn to recognize the different wave forms seen in an EKG, and associate these wave forms with activity of the heart.  Determine the heart rate by determining the rate of individual wave forms in the EKG.  Compare wave forms generated by alternate EKG lead placements. MATERIALS computer Vernier EKG Sensor Vernier computer interface electrode tabs Logger Pro PROCEDURE Part I Standard limb lead EKG 1. Connect the EKG Sensor to the Vernier computer interface. Open the file “12 Analyzing Heart EKG” from the Human Physiology with Vernier folder. 2. Attach three electrode tabs to your arms, as shown in Figure 2. Place a single patch on the Figure 2 inside of the right wrist, on the inside of the right upper forearm (distal to the elbow), and on the inside of the left upper forearm (distal to elbow). 3. Connect the EKG clips to the electrode tabs as shown in Figure 2. Sit in a relaxed position in a chair, with your forearms resting on your legs or on the arms of the chair. When you are properly positioned, have someone click to begin data collection. Human Physiology with Vernier 12 -
  • 3. Analyzing the Heart with EKG 4. Once data collection is finished, click and drag to highlight each interval listed in Table 1. Use Figure 3 as your guide when determining these intervals. Enter the x value of each highlighted area to the nearest 0.01 s in Table 1. This value can be found in the lower left corner of the graph. 5. Calculate the heart rate in beats/min using the EKG data. Record the heart rate to the nearest whole number in Table 1. 6. Store this run by choosing Store Latest Run from the Experiment menu. Part II Alternate limb lead EKG 7. Exchange the red and green EKG clips so that the green clip is now attached to the electrode tab on the left arm and the red clip is on the right arm. Sit in a relaxed position in a chair, with your forearms resting on your legs or on the arms of the chair. When you are properly positioned, have someone click to begin data collection. 8. Print or sketch the tracing for alternate limb lead placement only. Figure 3 P-R interval: time from the beginning of P wave to the start of the QRS complex QRS complex: time from Q deflection to S deflection Q-T interval: time from Q deflection to the end of the T ***The graph simply inverted along the X-axis Human Physiology with Vernier 12 -
  • 4. Analyzing the Heart with EKG DATA Table 1 Interval Time (s) P–R 0.15 QRS 0.1 Q–T 0.36 R–R 0.66 Heart Rate (bpm) 96 Table 2 Standard Resting Electrocardiogram Interval Times P–R interval 0.12 to 0.20 s QRS interval less than 0.12 s Q–T interval 0.30 to 0.40 s DATA ANALYSIS 1. Remember that a positive deflection indicates electrical activity moving toward the green EKG lead. Examine the two major deflections of a single QRS complex (R wave and S wave) in your EKG tracing from Part I of this experiment. According to this data, does ventricular depolarization proceed from right to left or left to right? How does your tracing from Part II confirm your answer? By changing the placement of the positive and negative leads, the graph inverted along the x- axis, indication the current flow is the same as before, but it shows as being opposite Human Physiology with Vernier 12 -
  • 5. Analyzing the Heart with EKG 2. Health-care professionals ask the following questions when interpreting an EKG:  Can all components be identified in each beat?  Are the intervals between each component and each complex consistent?  Are there clear abnormalities of any of the wave components? Using these questions as guides, analyze each of the following three-beat EKG tracings and record your conclusions in Table 3 (indicate presence or absence of the P wave, and whether other intervals and/or shapes are normal or abnormal). The first analysis (a) is done for you. a. b. c. d. e. f. g. h. Human Physiology with Vernier 12 -
  • 6. Analyzing the Heart with EKG Table 3 P Wave PR Interval QRS Interval QRS Shape T Wave Shape ECG Beat Pres. Abs. Nml. Abs./Abn. Nml. Abs./Abn. Nml. Abn. Nml. Abs./Abn. 1 X X X X X a 2 X X X X X 3 X X X X X 1 x x x x x b 2 x x x x x 3 x x x x x 1 x x x x x c 2 x x x x x 3 x x x x x 1 x x x x x d 2 x x x x x 3 x x x x x 1 x x x x x e 2 x x x x x 3 x x x x x 1 x x x x x f 2 x x x x x 3 x x x x x 1 x x x x x g 2 x x x x x 3 x x x x x 1 x x x x x h 2 x x x x x 3 x x x x x Human Physiology with Vernier 12 -