The document discusses budgeting and expense management in nursing care settings. It covers:
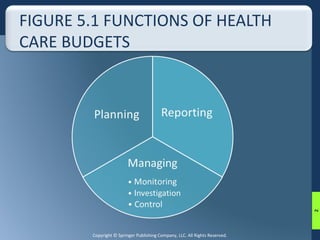
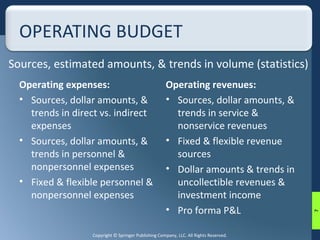
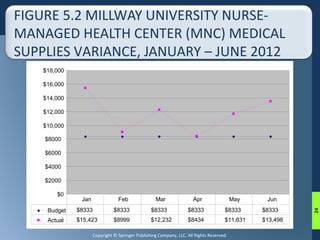
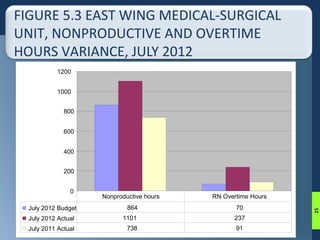
1) The importance of operating budgets for monitoring expenses, investigating variances, and controlling costs.
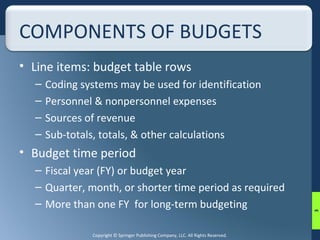
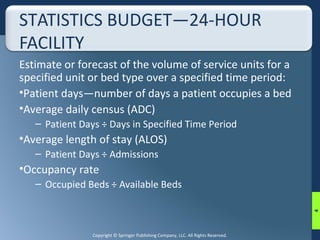
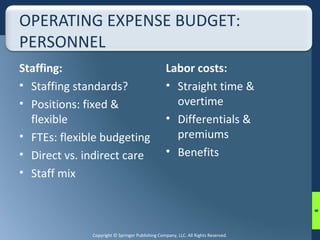
2) Components of budgets including line items, time periods, and statistics for estimating patient volume.
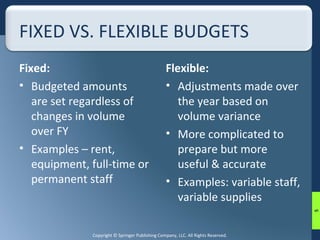
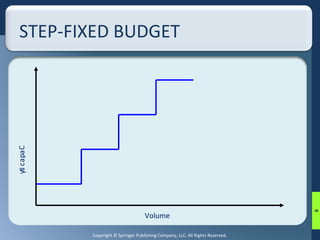
3) Types of budgets like fixed, flexible, and step-fixed budgets and how they adjust for changes in volume.
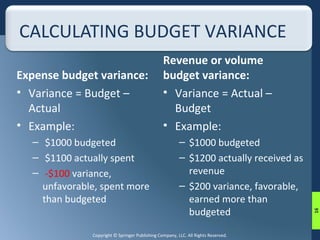
4) Calculating and analyzing variances to identify problems and ensure budgets are balanced.