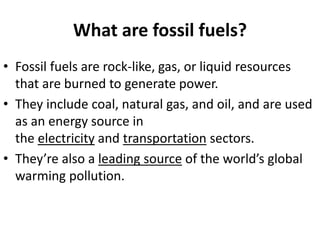
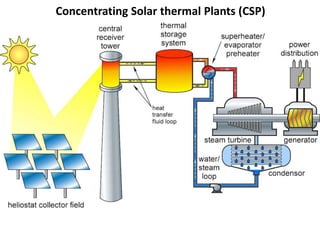
The document outlines the objectives, outcomes, and content of a course on renewable energy sources and technologies. The objectives are to impart knowledge about renewable energy sources and issues related to harnessing renewable energy. The outcomes include the ability to create awareness and understand the current and future roles of renewable energy. The course content covers 5 units - renewable energy sources, wind energy, solar PV and thermal systems, biomass energy, and other sources like tidal, wave, and hydrogen energy. It provides details on the technologies, principles, and applications of various renewable energy resources.


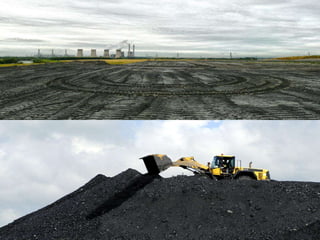
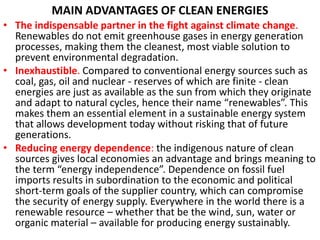
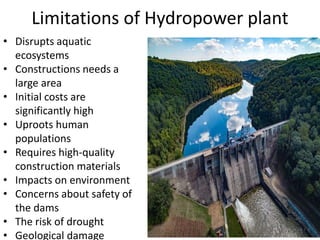
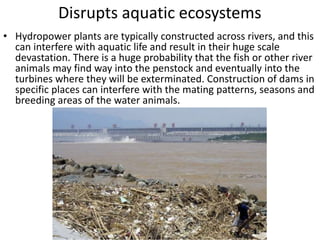
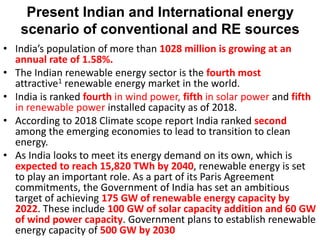
![Water impact
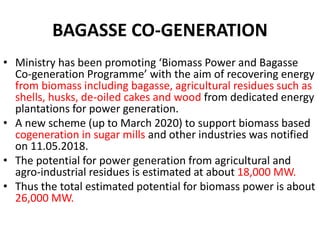
• When oil and gas are extracted, water that had been trapped
in the geologic formation is brought to the surface. This
“produced water” can carry with it naturally-occurring
dissolved solids, heavy metals, hydrocarbons, and radioactive
materials in concentrations that make it unsuitable for
human consumption and difficult to dispose of safely.
• When hydraulic fracturing methods are used, the total
amount of waste water is amplified by the large volume of
water and chemicals involved in the process. Drilling and
fracking shale gas formations (like the Marcellus Shale)
typically requires 3 to 6 million gallons of water per well, and
an additional 15,000-60,000 gallons of chemicals, many of
which are undisclosed to Federal regulators.
• Researchers could track only 353 chemicals from that larger
list and found that 25 percent of those chemicals cause
cancer or other mutations, and about half could severely
damage neurological, cardiovascular, endocrine, and immune
systems [13].](https://image.slidesharecdn.com/ee-8703unit-1-230614094658-221b3d8a/85/EE-8703-Unit-1-pptx-10-320.jpg)
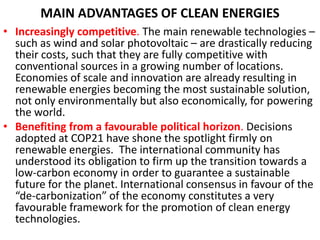
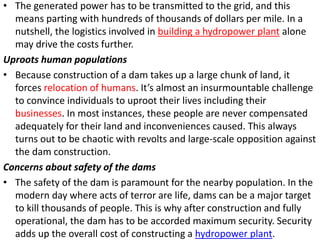
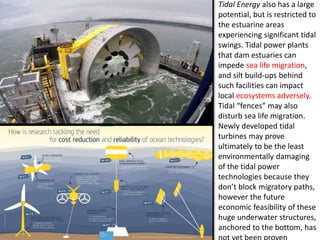
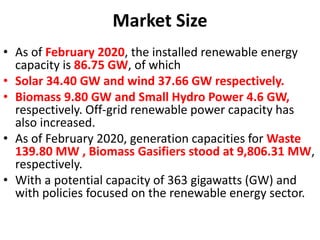
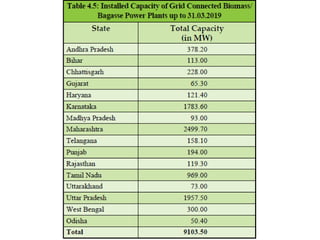
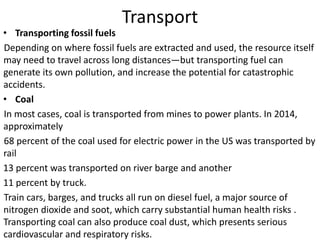
![Global warming emissions
• Natural gas’s climate emissions are not only generated when it’s burned as a fuel at
power plants or in our homes. The full global warming impact of natural gas also
includes methane emissions from drilling wells and pipeline transportation.
• Methane, the main component of natural gas, is a much more potent greenhouse
gas than carbon dioxide—some 34 times more effective at trapping heat over a
100-year timescale and 86 times more effective over a 20-year timescale.
Preliminary studies and field measurements show that these so-called “fugitive”
emissions range from 1 to 9 percent of total natural gas lifecycle emissions.
Methane losses must be kept below 3.2 percent for natural gas power plants to
have lower lifecycle greenhouse gas emissions than coal.
• Oil drilling can also produce methane. Although it can be captured and used as an
energy source, the gas is often either vented (released) or flared (burned). Vented
methane contributes greatly to global warming, and poses a serious safety hazard.
Flaring the gas converts it from methane to carbon dioxide, which reduces its
impact but still releases additional greenhouse gases to into the atmosphere.
• The World Bank estimates that 5.3 trillion cubic feet of natural gas, the equivalent
of 25 percent of total US consumption, is flared annually worldwide, generating
some 400 million tons of unnecessary carbon dioxide emissions [18].](https://image.slidesharecdn.com/ee-8703unit-1-230614094658-221b3d8a/85/EE-8703-Unit-1-pptx-11-320.jpg)


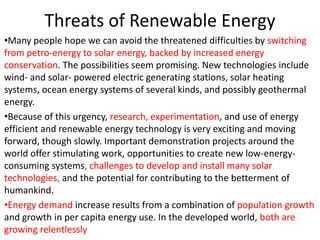
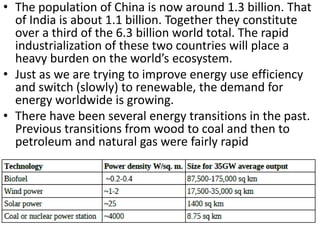
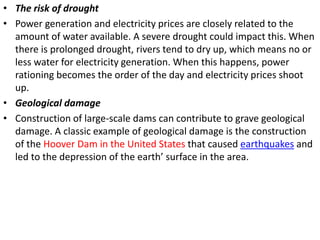
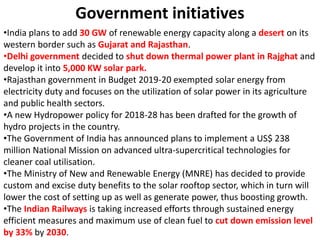
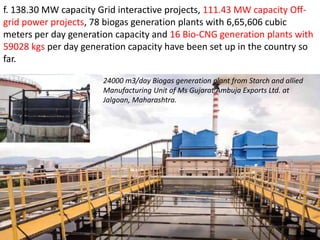
![Wind Power Plant[WPP]](https://image.slidesharecdn.com/ee-8703unit-1-230614094658-221b3d8a/85/EE-8703-Unit-1-pptx-31-320.jpg)