Download as PDF, PPTX

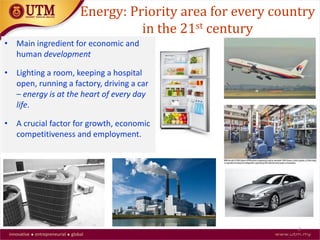
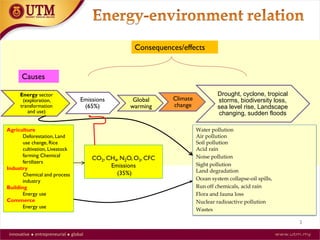
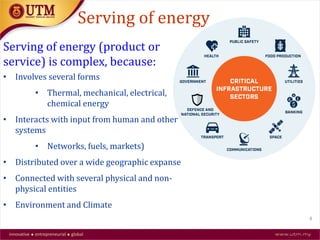
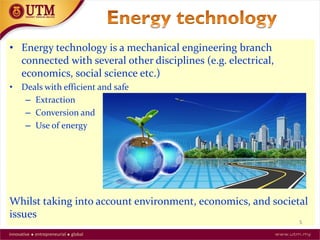
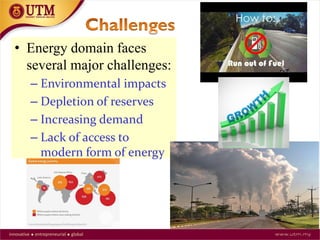

1. The document discusses energy and its relationship to the environment, sustainability, and engineering challenges. 2. It notes that energy is crucial for development but current production relies heavily on fossil fuels, which causes environmental issues like pollution and climate change as reserves are depleted. 3. The document advocates for more sustainable energy solutions like efficiency improvements and renewable resources to develop energy in ways that consider environmental, social, and economic impacts for current and future generations.


