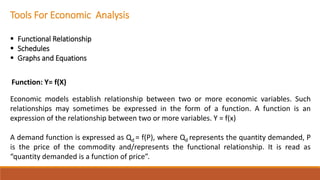
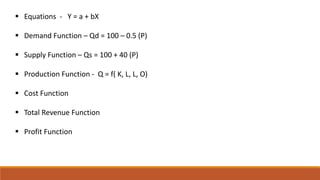
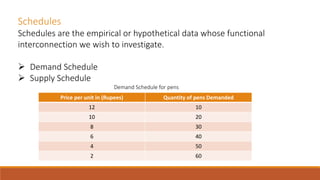
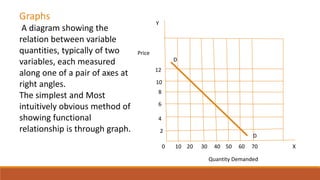
Economic models establish relationships between variables in the form of functions. Tools for analyzing these relationships include equations, schedules, and graphs. Equations express relationships mathematically as Y=f(X). Schedules provide hypothetical data on how variables are interconnected. Graphs visually show functional relationships between variables on different axes. These tools are used to analyze relationships in economic concepts like demand, supply, production, costs, and profits at the level of households, consumers, firms, industries, and the economy.