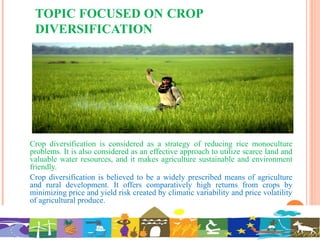
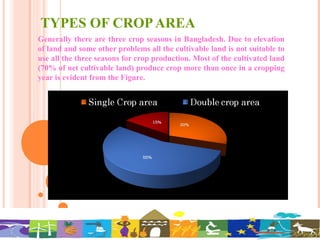
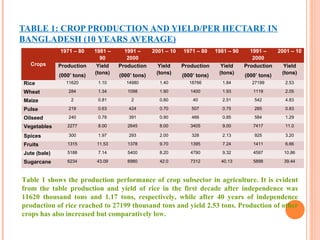
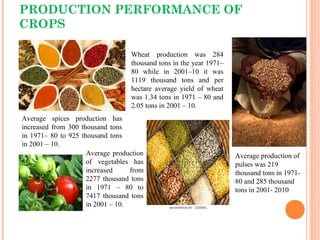
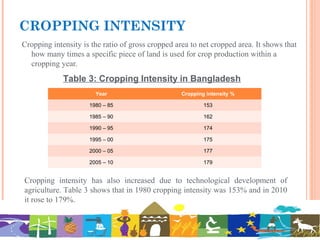
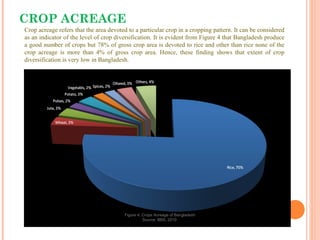
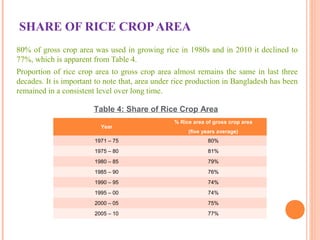
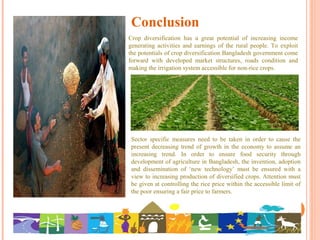
CROP DIVERSIFICATION AND
AGRICULTURAL EXPANSION
Hamina Humaira
TOPIC FOCUSED ON CROP
DIVERSIFICATION
Crop diversification is considered as a strategy of reducing rice monoculture
problems. It is also considered as an effective approach to utilize scarce land and
valuable water resources, and it makes agriculture sustainable and environment
friendly.
Crop diversification is believed to be a widely prescribed means of agriculture
and rural development. It offers comparatively high returns from crops by
minimizing price and yield risk created by climatic variability and price volatility
of agricultural produce.
CROP DIVERSIFICATION
CAN…
World Bank, believe that crop diversification is a very important
instrument for food and nutrition security, income growth, poverty
alleviation and employment generation.
It also helps to use the land, water and other resources judiciously.
Crop diversification as a socially beneficial policy can be
complimented by extensive infrastructural facilities, financial and
technological support, etc. especially for the localized micro
enterprises that are engaged in processing, storing, grading and
packaging activities.
Crop diversification is a contemporary issue in the field of
agriculture, especially in the context of Bangladesh.
TYPES OF CROPAREA
Generally there are three crop seasons in Bangladesh. Due to elevation
of land and some other problems all the cultivable land is not suitable to
use all the three seasons for crop production. Most of the cultivated land
(70% of net cultivable land) produce crop more than once in a cropping
year is evident from the Figure.
MAJOR CROPS OF BANGLADESH
Major crops in Bangladesh are cereals, sugarcane, fruits, vegetables, oilseeds etc.
Major industrial crops are jute, tea, tobacco etc.
Rice jute Wheat
Pulses
oilseeds vegetables
Cotton Tea
Timber
TABLE 1: CROP PRODUCTION AND YIELD/PER HECTARE IN
BANGLADESH (10 YEARS AVERAGE)
Crops
1971 – 80 1981 –
90
1991 –
2000
2001 – 10 1971 – 80 1981 – 90 1991 –
2000
2001 – 10
Production
(000’ tons)
Yield
(tons)
Production
(000’ tons)
Yield
(tons)
Production
(000’ tons)
Yield
(tons)
Production
(000’ tons)
Yield
(tons)
Rice 11620 1.10 14980 1.40 18766 1.84 27199 2.53
Wheat 284 1.34 1098 1.90 1400 1.93 1119 2.05
Maize 2 0.81 2 0.80 40 2.51 542 4.83
Pulse 219 0.63 424 0.70 507 0.75 285 0.83
Oilseed 240 0.78 391 0.90 466 0.85 584 1.29
Vegetables 2277 8.00 2645 8.00 3405 9.00 7417 11.0
Spices 300 1.97 293 2.00 328 2.13 925 3.20
Fruits 1315 11.53 1378 9.70 1395 7.24 1411 6.66
Jute (bale) 5188 7.14 5400 8.20 4790 9.32 4597 10.86
Sugarcane 6234 43.09 6980 42.0 7312 40.13 5898 39.44
Table 1 shows the production performance of crop subsector in agriculture. It is evident
from the table production and yield of rice in the first decade after independence was
11620 thousand tons and 1.17 tons, respectively, while after 40 years of independence
production of rice reached to 27199 thousand tons and yield 2.53 tons. Production of other
crops has also increased but comparatively low.
SECTOR WISE CONTRIBUTION TO
GDP
Figure 2: Sector-wise Contribution to GDP
Source: GoB, 2014
Figure 3: Composition of Agricultural GDP
Source: GoB, 2014
Some years back, agriculture was a dominant sector in Bangladesh economy and its
contribution to the GDP was more than two thirds. Now-a-days its contribution declined to
only 17% to the GDP is evident from Figure 2. Presently contribution of service sector
dominant the Bangladesh economy and its contribution is more than half of the total GDP.
Similarly Figure 3 shows that among the subsectors of agriculture crops’ contribution is the
highest followed by fisheries, livestock and forestry.
TABLE 2: CONTRIBUTION OF CROPS TO GDP AND
AGRICULTURE (%)
Year Contribution to GDP Contribution to Agriculture
1995 – 96 14.42 58.52
2000 – 01 14.70 58.73
2005 – 06 12.28 56.23
2010 – 11 11.32 56.32
Table 2 depicts that crop sector contribution to GDP and in agriculture is
high but it is decreasing over the years. In agriculture sector, though crop
sub-sector’s contribution is being declined but yet it is more than 50% of
total agriculture
PRODUCTION PERFORMANCE OF
CROPS
Average spices production has
increased from 300 thousand tons
in 1971– 80 to 925 thousand tons
in 2001 – 10.
Wheat production was 284
thousand tons in the year 1971–
80 while in 2001–10 it was
1119 thousand tons and per
hectare average yield of wheat
was 1.34 tons in 1971 – 80 and
2.05 tons in 2001 – 10.
Average production
of vegetables has
increased from
2277 thousand tons
in 1971 – 80 to
7417 thousand tons
in 2001 – 10.
Average production of
pulses was 219
thousand tons in 1971-
80 and 285 thousand
tons in 2001- 2010
CROPPING INTENSITY
Cropping intensity is the ratio of gross cropped area to net cropped area. It shows that
how many times a specific piece of land is used for crop production within a
cropping year.
Table 3: Cropping Intensity in Bangladesh
Year Cropping intensity %
1980 – 85 153
1985 – 90 162
1990 – 95 174
1995 – 00 175
2000 – 05 177
2005 – 10 179
Cropping intensity has also increased due to technological development of
agriculture. Table 3 shows that in 1980 cropping intensity was 153% and in 2010
it rose to 179%.
CROP ACREAGE
Figure 4: Crops Acreage of Bangladesh
Source: BBS, 2010
Crop acreage refers that the area devoted to a particular crop in a cropping pattern. It can be considered
as an indicator of the level of crop diversification. It is evident from Figure 4 that Bangladesh produce
a good number of crops but 78% of gross crop area is devoted to rice and other than rice none of the
crop acreage is more than 4% of gross crop area. Hence, these finding shows that extent of crop
diversification is very low in Bangladesh.
SHARE OF RICE CROPAREA
80% of gross crop area was used in growing rice in 1980s and in 2010 it declined to
77%, which is apparent from Table 4.
Proportion of rice crop area to gross crop area almost remains the same in last three
decades. It is important to note that, area under rice production in Bangladesh has been
remained in a consistent level over long time.
Table 4: Share of Rice Crop Area
Year
% Rice area of gross crop area
(five years average)
1971 – 75 80%
1975 – 80 81%
1980 – 85 79%
1985 – 90 76%
1990 – 95 74%
1995 – 00 74%
2000 – 05 75%
2005 – 10 77%
FARMER-WISE CROP
DIVERSIFICATION
Objectives of farming are different in different farmers. Some farmers produce crop
for their subsistence whereas some other produce only for cash needs and some
cultivate land for subsistence as well as cash needs.
Figure 5: Value of Simpson Index
Source: BBS, 2010
Figure 5: Rice Share Index
Source: BBS, 2010
Figure 5 and Figure 6 show the value of Simpson index and Rice share index of
crop diversification. It is found from the figures that small farmer practices crop
diversification more than that of medium and large farmers.
AGRICULTURAL EXPANSION
According to the HIES (2010) 35.2% and
21.1% of the population in rural areas lives
below upper and lower poverty line
respectively. During the fiscal year 2012-13,
the broad agriculture sector1 contributed
16.77% to the total GDP.
Agriculture is the source of food for people through crops, livestock, fisheries; the source
of raw materials for industry, of timber for construction; and a generator of foreign
exchange for the country through the export of agricultural commodities, whether raw or
processed.
The contributions of crop, fishery, livestock and
forestry subsectors in GDP were 9.49%, 3.68%,
1.84% and 1.76%. The provisional estimates show
that contribution of the broad agriculture sector to
GDP in 2013-14 would be 16.33%. Nearly 3/5th of
the agricultural GDP comes from the crop sub-
sector.
AGRICULTURE : GROWTH AND SHARE IN GDP
The rate of growth in agriculture was 5.24 percent in FY2009- 10, whereas in FY2010-11, FY2011-12
and FY2012-13 the ratewas5.13 percent, 3.11 percent and 2.17 percent respectively. This falling growth
in agriculture has been causing the share of agriculture in GDP to decline over the recent years.
For instance, in FY2009-10, the share of agriculture in GDP was 20.29 percent, whereas in FY2010-11,
FY2011-12 and FY2012- 13the share was 20.01 percent, 19.42 percent and 18.70 percent respectively.
Figure 1: Rate of Growth in Agriculture
Sector
Figure 2: Share of Agriculture in GDP
PERFORMANCEOFBANGLADESH
AGRICULTURE
Following independence
in 1971, agricultural
production in Bangladesh
increased at around the
rate of 2% per year. The
growth rate accelerated
during the 1990s and
early 2000s to around 4%
per year. The Sixth Five
Year Plan sought to build
on the success of such
rapid agricultural growth,
targeting average growth
of 4.5 % during the plan
period and a remarkable
5.1% growth was
achieved in 2010-11.
However, this momentum
could not be sustained
subsequently and the
growth rate fell sharply in
2011-12 to 2.7%, and
weakened further to only
2.2% in 2012-13.
AGRICULTURE: GROWTH IN
SUBSECTORS
Sector/
Subsector
FY
2007-08
FY
2008-09
FY
2009-10
FY
2010-11
FY
2011-12
FY
2012-13 (P)
Agriculture
and
Forestry (%)
2.93 4.10 5.56 5.09 2.46 1.18
Crop (%) 2.67 4.02 6.13 5.65 1.95 0.15
Livestock (%) 2.44 3.48 3.38 3.48 3.39 3.49
Forestry (%) 5.47 5.69 5.23 3.90 4.42 4.47
Fisheries (%) 4.18 4.16 4.15 5.25 5.39 5.52
Table 1 shows that crop with a growth rate of 2.67 percent comprises 11.64 percent share
of GDP in FY2007-08, while the share came down to 10.25 percent with 0.15 percent rate
of growth in FY2012-13.
Consequently, increasing trend in the growth of livestock and forestry does not compensate
the decline of growth in crop production. Meanwhile, contribution of fisheries to GDP is
declining, although the trend of growth assumes an increasing trend.
Table 1: Rate of Growth in Different Subsectors of Agriculture
AGRICULTURE: PATTERN OF USE OF
CULTIVABLE LAND
Figure 3 shows the decreasing trend of
availability of net agricultural land. Per
available net agricultural land came
down to 8.78 hectare in 2011 from 8.50
hectare in 1961.
Figure 4 shows the decreasing trend
of per capita agricultural land. Per
capita agricultural land came down to
0.056 hectare in 2011 from 0.17
hectare in 1961.
Source: Ministry of Agriculture, 2013
Figure 3: Trend of Loss in the Availability of
Net Cultivable Land
Figure 4: Trend of Loss in Per Capita
Cultivable Land
Source: Authors’ calculation based on Ministry of
Agriculture, 2013 and World Bank 2013
USE OF VARIOUS FERTILIZERS IN
AGRICULTURAL LAND
The use of fertilizer has been increasing in crop production in Bangladesh. Governments of
Bangladesh have been allocating a good number of subsidies for with a view to making the
farmers avail themselves of purchasing fertilizers at an affordable price.
However, since 2008 the rise in fertilizer prices, especially the price of urea, has been
exerting pressure on the poor and marginal farmers leaving them unable to procure fertilizer
sufficiently.
Some
agricultural
machineries
that are
used in
different
stage of
crop
cultivation
Conclusion
Crop diversification has a great potential of increasing income
generating activities and earnings of the rural people. To exploit
the potentials of crop diversification Bangladesh government come
forward with developed market structures, roads condition and
making the irrigation system accessible for non-rice crops.
Sector specific measures need to be taken in order to cause the
present decreasing trend of growth in the economy to assume an
increasing trend. In order to ensure food security through
development of agriculture in Bangladesh, the invention, adoption
and dissemination of ‘new technology’ must be ensured with a
view to increasing production of diversified crops. Attention must
be given at controlling the rice price within the accessible limit of
the poor ensuring a fair price to farmers.
Thank You

ecionomics

  • 1.
    CROP DIVERSIFICATION AND AGRICULTURALEXPANSION Hamina Humaira
  • 2.
    TOPIC FOCUSED ONCROP DIVERSIFICATION Crop diversification is considered as a strategy of reducing rice monoculture problems. It is also considered as an effective approach to utilize scarce land and valuable water resources, and it makes agriculture sustainable and environment friendly. Crop diversification is believed to be a widely prescribed means of agriculture and rural development. It offers comparatively high returns from crops by minimizing price and yield risk created by climatic variability and price volatility of agricultural produce.
  • 3.
    CROP DIVERSIFICATION CAN… World Bank,believe that crop diversification is a very important instrument for food and nutrition security, income growth, poverty alleviation and employment generation. It also helps to use the land, water and other resources judiciously. Crop diversification as a socially beneficial policy can be complimented by extensive infrastructural facilities, financial and technological support, etc. especially for the localized micro enterprises that are engaged in processing, storing, grading and packaging activities. Crop diversification is a contemporary issue in the field of agriculture, especially in the context of Bangladesh.
  • 4.
    TYPES OF CROPAREA Generallythere are three crop seasons in Bangladesh. Due to elevation of land and some other problems all the cultivable land is not suitable to use all the three seasons for crop production. Most of the cultivated land (70% of net cultivable land) produce crop more than once in a cropping year is evident from the Figure.
  • 5.
    MAJOR CROPS OFBANGLADESH Major crops in Bangladesh are cereals, sugarcane, fruits, vegetables, oilseeds etc. Major industrial crops are jute, tea, tobacco etc. Rice jute Wheat Pulses oilseeds vegetables Cotton Tea Timber
  • 6.
    TABLE 1: CROPPRODUCTION AND YIELD/PER HECTARE IN BANGLADESH (10 YEARS AVERAGE) Crops 1971 – 80 1981 – 90 1991 – 2000 2001 – 10 1971 – 80 1981 – 90 1991 – 2000 2001 – 10 Production (000’ tons) Yield (tons) Production (000’ tons) Yield (tons) Production (000’ tons) Yield (tons) Production (000’ tons) Yield (tons) Rice 11620 1.10 14980 1.40 18766 1.84 27199 2.53 Wheat 284 1.34 1098 1.90 1400 1.93 1119 2.05 Maize 2 0.81 2 0.80 40 2.51 542 4.83 Pulse 219 0.63 424 0.70 507 0.75 285 0.83 Oilseed 240 0.78 391 0.90 466 0.85 584 1.29 Vegetables 2277 8.00 2645 8.00 3405 9.00 7417 11.0 Spices 300 1.97 293 2.00 328 2.13 925 3.20 Fruits 1315 11.53 1378 9.70 1395 7.24 1411 6.66 Jute (bale) 5188 7.14 5400 8.20 4790 9.32 4597 10.86 Sugarcane 6234 43.09 6980 42.0 7312 40.13 5898 39.44 Table 1 shows the production performance of crop subsector in agriculture. It is evident from the table production and yield of rice in the first decade after independence was 11620 thousand tons and 1.17 tons, respectively, while after 40 years of independence production of rice reached to 27199 thousand tons and yield 2.53 tons. Production of other crops has also increased but comparatively low.
  • 7.
    SECTOR WISE CONTRIBUTIONTO GDP Figure 2: Sector-wise Contribution to GDP Source: GoB, 2014 Figure 3: Composition of Agricultural GDP Source: GoB, 2014 Some years back, agriculture was a dominant sector in Bangladesh economy and its contribution to the GDP was more than two thirds. Now-a-days its contribution declined to only 17% to the GDP is evident from Figure 2. Presently contribution of service sector dominant the Bangladesh economy and its contribution is more than half of the total GDP. Similarly Figure 3 shows that among the subsectors of agriculture crops’ contribution is the highest followed by fisheries, livestock and forestry.
  • 8.
    TABLE 2: CONTRIBUTIONOF CROPS TO GDP AND AGRICULTURE (%) Year Contribution to GDP Contribution to Agriculture 1995 – 96 14.42 58.52 2000 – 01 14.70 58.73 2005 – 06 12.28 56.23 2010 – 11 11.32 56.32 Table 2 depicts that crop sector contribution to GDP and in agriculture is high but it is decreasing over the years. In agriculture sector, though crop sub-sector’s contribution is being declined but yet it is more than 50% of total agriculture
  • 9.
    PRODUCTION PERFORMANCE OF CROPS Averagespices production has increased from 300 thousand tons in 1971– 80 to 925 thousand tons in 2001 – 10. Wheat production was 284 thousand tons in the year 1971– 80 while in 2001–10 it was 1119 thousand tons and per hectare average yield of wheat was 1.34 tons in 1971 – 80 and 2.05 tons in 2001 – 10. Average production of vegetables has increased from 2277 thousand tons in 1971 – 80 to 7417 thousand tons in 2001 – 10. Average production of pulses was 219 thousand tons in 1971- 80 and 285 thousand tons in 2001- 2010
  • 10.
    CROPPING INTENSITY Cropping intensityis the ratio of gross cropped area to net cropped area. It shows that how many times a specific piece of land is used for crop production within a cropping year. Table 3: Cropping Intensity in Bangladesh Year Cropping intensity % 1980 – 85 153 1985 – 90 162 1990 – 95 174 1995 – 00 175 2000 – 05 177 2005 – 10 179 Cropping intensity has also increased due to technological development of agriculture. Table 3 shows that in 1980 cropping intensity was 153% and in 2010 it rose to 179%.
  • 11.
    CROP ACREAGE Figure 4:Crops Acreage of Bangladesh Source: BBS, 2010 Crop acreage refers that the area devoted to a particular crop in a cropping pattern. It can be considered as an indicator of the level of crop diversification. It is evident from Figure 4 that Bangladesh produce a good number of crops but 78% of gross crop area is devoted to rice and other than rice none of the crop acreage is more than 4% of gross crop area. Hence, these finding shows that extent of crop diversification is very low in Bangladesh.
  • 12.
    SHARE OF RICECROPAREA 80% of gross crop area was used in growing rice in 1980s and in 2010 it declined to 77%, which is apparent from Table 4. Proportion of rice crop area to gross crop area almost remains the same in last three decades. It is important to note that, area under rice production in Bangladesh has been remained in a consistent level over long time. Table 4: Share of Rice Crop Area Year % Rice area of gross crop area (five years average) 1971 – 75 80% 1975 – 80 81% 1980 – 85 79% 1985 – 90 76% 1990 – 95 74% 1995 – 00 74% 2000 – 05 75% 2005 – 10 77%
  • 13.
    FARMER-WISE CROP DIVERSIFICATION Objectives offarming are different in different farmers. Some farmers produce crop for their subsistence whereas some other produce only for cash needs and some cultivate land for subsistence as well as cash needs. Figure 5: Value of Simpson Index Source: BBS, 2010 Figure 5: Rice Share Index Source: BBS, 2010 Figure 5 and Figure 6 show the value of Simpson index and Rice share index of crop diversification. It is found from the figures that small farmer practices crop diversification more than that of medium and large farmers.
  • 14.
    AGRICULTURAL EXPANSION According tothe HIES (2010) 35.2% and 21.1% of the population in rural areas lives below upper and lower poverty line respectively. During the fiscal year 2012-13, the broad agriculture sector1 contributed 16.77% to the total GDP. Agriculture is the source of food for people through crops, livestock, fisheries; the source of raw materials for industry, of timber for construction; and a generator of foreign exchange for the country through the export of agricultural commodities, whether raw or processed. The contributions of crop, fishery, livestock and forestry subsectors in GDP were 9.49%, 3.68%, 1.84% and 1.76%. The provisional estimates show that contribution of the broad agriculture sector to GDP in 2013-14 would be 16.33%. Nearly 3/5th of the agricultural GDP comes from the crop sub- sector.
  • 15.
    AGRICULTURE : GROWTHAND SHARE IN GDP The rate of growth in agriculture was 5.24 percent in FY2009- 10, whereas in FY2010-11, FY2011-12 and FY2012-13 the ratewas5.13 percent, 3.11 percent and 2.17 percent respectively. This falling growth in agriculture has been causing the share of agriculture in GDP to decline over the recent years. For instance, in FY2009-10, the share of agriculture in GDP was 20.29 percent, whereas in FY2010-11, FY2011-12 and FY2012- 13the share was 20.01 percent, 19.42 percent and 18.70 percent respectively. Figure 1: Rate of Growth in Agriculture Sector Figure 2: Share of Agriculture in GDP
  • 16.
    PERFORMANCEOFBANGLADESH AGRICULTURE Following independence in 1971,agricultural production in Bangladesh increased at around the rate of 2% per year. The growth rate accelerated during the 1990s and early 2000s to around 4% per year. The Sixth Five Year Plan sought to build on the success of such rapid agricultural growth, targeting average growth of 4.5 % during the plan period and a remarkable 5.1% growth was achieved in 2010-11. However, this momentum could not be sustained subsequently and the growth rate fell sharply in 2011-12 to 2.7%, and weakened further to only 2.2% in 2012-13.
  • 17.
    AGRICULTURE: GROWTH IN SUBSECTORS Sector/ Subsector FY 2007-08 FY 2008-09 FY 2009-10 FY 2010-11 FY 2011-12 FY 2012-13(P) Agriculture and Forestry (%) 2.93 4.10 5.56 5.09 2.46 1.18 Crop (%) 2.67 4.02 6.13 5.65 1.95 0.15 Livestock (%) 2.44 3.48 3.38 3.48 3.39 3.49 Forestry (%) 5.47 5.69 5.23 3.90 4.42 4.47 Fisheries (%) 4.18 4.16 4.15 5.25 5.39 5.52 Table 1 shows that crop with a growth rate of 2.67 percent comprises 11.64 percent share of GDP in FY2007-08, while the share came down to 10.25 percent with 0.15 percent rate of growth in FY2012-13. Consequently, increasing trend in the growth of livestock and forestry does not compensate the decline of growth in crop production. Meanwhile, contribution of fisheries to GDP is declining, although the trend of growth assumes an increasing trend. Table 1: Rate of Growth in Different Subsectors of Agriculture
  • 18.
    AGRICULTURE: PATTERN OFUSE OF CULTIVABLE LAND Figure 3 shows the decreasing trend of availability of net agricultural land. Per available net agricultural land came down to 8.78 hectare in 2011 from 8.50 hectare in 1961. Figure 4 shows the decreasing trend of per capita agricultural land. Per capita agricultural land came down to 0.056 hectare in 2011 from 0.17 hectare in 1961. Source: Ministry of Agriculture, 2013 Figure 3: Trend of Loss in the Availability of Net Cultivable Land Figure 4: Trend of Loss in Per Capita Cultivable Land Source: Authors’ calculation based on Ministry of Agriculture, 2013 and World Bank 2013
  • 19.
    USE OF VARIOUSFERTILIZERS IN AGRICULTURAL LAND The use of fertilizer has been increasing in crop production in Bangladesh. Governments of Bangladesh have been allocating a good number of subsidies for with a view to making the farmers avail themselves of purchasing fertilizers at an affordable price. However, since 2008 the rise in fertilizer prices, especially the price of urea, has been exerting pressure on the poor and marginal farmers leaving them unable to procure fertilizer sufficiently.
  • 20.
  • 21.
    Conclusion Crop diversification hasa great potential of increasing income generating activities and earnings of the rural people. To exploit the potentials of crop diversification Bangladesh government come forward with developed market structures, roads condition and making the irrigation system accessible for non-rice crops. Sector specific measures need to be taken in order to cause the present decreasing trend of growth in the economy to assume an increasing trend. In order to ensure food security through development of agriculture in Bangladesh, the invention, adoption and dissemination of ‘new technology’ must be ensured with a view to increasing production of diversified crops. Attention must be given at controlling the rice price within the accessible limit of the poor ensuring a fair price to farmers.
  • 22.