An earthquake is caused by a sudden release of energy at a focus within the Earth. There are two main types of seismic waves generated: P-waves and S-waves. P-waves travel faster and arrive first, while S-waves oscillate perpendicular to their direction of travel. Surface waves travel along the Earth's surface and can cause significant damage to structures and utilities. Earthquake location can be estimated through triangulation using travel time differences of seismic waves recorded by multiple stations. Earthquake strength is measured by both the Richter scale based on amplitude of seismic waves, and the Modified Mercalli scale based on extent of damage observed.

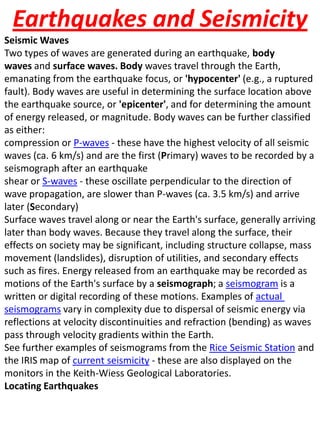
![The surface point above the hypocenter is known as the epicenter. As the distance from an earthquake increases, the arrival time difference between the p-wave and s-waves ('S-P difference') increases proportionately. Thus, epicenter locations can be determined by triangulation using a travel-time curve and data recorded at three or more seismic stations.Hands-on examples of calculating location (as well as Richter magnitude) for real earthquakes can be found at the very cool Virtual Earthquake WWW site. Give it a try, and become a virtual seismologist!Estimating Intensity of EarthquakesStrength of earthquakes (intensity) can be estimated from the maximum amplitude of the P wave, which is proportional to seismic energy released in small to moderate earthquakes. In the Richter scale, the assigned magnitude increases by one unit for every tenfold increase in the recorded amplitude (implicitly, all seismometers must be calibrated to give identical responses). In fact, the energy released by earthquakes increases more rapidly than amplitude of the seismic wave - about a factor of 40 for each magnitude step! Fortunately, the energy of larger earthquakes is more widely distributed in space and time than for smaller ones, such that surface hazards do not increase at this high rate.Strength of earthquakes can also be measured using the Modified Mercalli (MM) Intensity Scale, which is a qualitative scheme based on extent of damage. Because surface damage is most intense near the epicenter and generally decreases with distance, for any given earthquake this scale may vary widely with geographic location. For comparison, see the MM maps for the 1811-1812 New Madrid (MO)and the 1906 San Francisco (CA) earthquakes; the greater extent of MM zones for the former event reflects the greater crustal elasticity in the mid-continent and eastern US.Seismic moment (Mo), defined as the product of [rock shear strength]*[surface area of faults]*[average displacement], is a more consistent measure of earthquake size (energy release) than is magnitude; a magnitude scale based on this parameter (Mw = 2/3*log[Mo] - 10.7) is now used widely as it shows near-linear variation with energy release. This measure can be used to predict such things as size of earthquake for a given fault geometry and displacement.](https://image.slidesharecdn.com/earthquakes-110312143757-phpapp01/85/Earthquakes-3-320.jpg)