Download to read offline
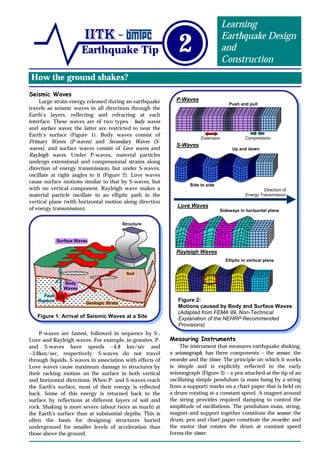


Seismic waves generated by earthquakes travel through the Earth's layers and cause different types of ground shaking at surfaces. Body waves include P-waves and S-waves, while surface waves include Love waves and Rayleigh waves. S-waves and Love waves cause the most damage to structures through their racking horizontal and vertical motions. Ground shaking is measured by seismographs, which contain sensors to detect motion, recorders to document it, and timers to note duration. Strong ground shaking depends on factors like the earthquake's energy release, geology between the fault and measurement point, and local soil conditions. Characteristics of strong shaking include peak ground acceleration values and the frequency and duration of motion.


![EARTHQUAKE Presentation [TIPS 2]](https://cdn.slidesharecdn.com/ss_thumbnails/learningearthquakedesignfinal-140726123358-phpapp02-thumbnail.jpg?width=640&height=640&fit=bounds)


