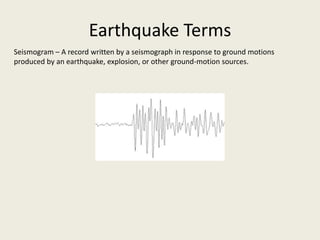
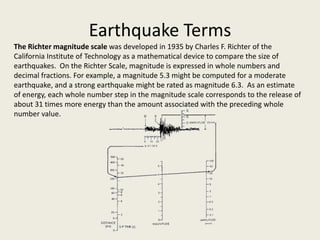
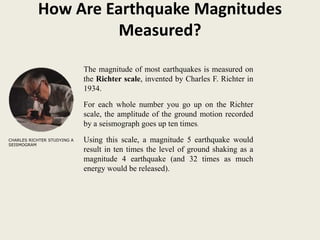
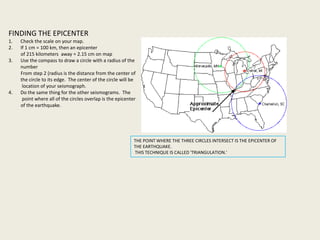
Week 2 Project

   Gib Lucas
    EDU 653
   Dr. Merrill
   6/28/2012
Earthquakes


Earthquake – Sudden slip on a fault, and resulting
ground shaking and radiated seismic energy caused by
the slip, or by volcanic or magmatic activity, or other
sudden stress changes in the earth.
Earthquake Terms
Amplitude – The size of the wiggles on an earthquake recording.


Epicenter – The point on the earth’s surface vertically above the (hypocenter ) focus,
point in the crust where a seismic rupture begins.
Earthquake Terms

Hypocenter – The point within the earth where an earthquake rupture starts.
The epicenter is the point directly above it at the surface of the earth. Also
commonly termed the focus.
Earthquake Terms
Magnitude – A number that characterizes the relative size of an earthquake.
Magnitude is based on measurement of the maximum motion recorded by a
seismograph.

P wave, or compression wave, is a seismic body wave that shakes the ground
back and forth in the same direction and the opposite direction as the direction
the wave is moving.
S wave, or shear wave, is a seismic body wave that shakes the ground back and
forth perpendicular to the direction the wave is moving
Earthquake Terms
Seismogram – A record written by a seismograph in response to ground motions
produced by an earthquake, explosion, or other ground-motion sources.
Earthquake Terms
The Richter magnitude scale was developed in 1935 by Charles F. Richter of the
California Institute of Technology as a mathematical device to compare the size of
earthquakes. On the Richter Scale, magnitude is expressed in whole numbers and
decimal fractions. For example, a magnitude 5.3 might be computed for a moderate
earthquake, and a strong earthquake might be rated as magnitude 6.3. As an estimate
of energy, each whole number step in the magnitude scale corresponds to the release of
about 31 times more energy than the amount associated with the preceding whole
number value.
OBJECTIVES

Reading a Seismogram
Calculating the Magnitude of an Earthquake
Finding the Epicenter of an Earthquake
How Are Earthquake Magnitudes
                    Measured?

                              The magnitude of most earthquakes is measured on
                             .the Richter scale, invented by Charles F. Richter in
                              1934.

                             For each whole number you go up on the Richter
                             scale, the amplitude of the ground motion recorded
                             by a seismograph goes up ten times.
CHARLES RICHTER STUDYING A   Using this scale, a magnitude 5 earthquake would
SEISMOGRAM
                             result in ten times the level of ground shaking as a
                             magnitude 4 earthquake (and 32 times as much
                             energy would be released).
Earthquake Energy Release

   To give you an idea how these numbers can add
   up, think of it in terms of the energy released
   by explosives:

   A magnitude 1 seismic wave releases as much
   energy as blowing up 6 ounces of TNT.

   A magnitude 8 earthquake releases as much
   energy as detonating 6 million tons of TNT.

    Pretty impressive, huh? Fortunately, most of
   the earthquakes that occur each year are
   magnitude 2.5 or less, too small to be felt by
   most people.
A TYPICAL SEISMOGRAM
 When you look at a seismogram, there will be wiggly lines all
across it. These are all the seismic waves that the seismograph has
recorded.

Most of these waves were so small that nobody felt them. They
can be caused by heavy traffic near the seismograph, waves hitting
a beach, the wind, and any number of other ordinary things that
cause some shaking of the seismograph.

There may also be some little dots or marks evenly spaced along
the paper. These are marks for every minute that the drum of the
seismograph has been turning.
What do the Wiggles mean?

When you look at a seismogram, there will be wiggly lines all across it.

So which wiggles are the earthquake?

 The P wave will be the first wiggle that is bigger than the rest of the little
ones . Because P waves are the fastest seismic waves, they will usually be
the first ones that your seismograph records.

The next set of seismic waves on your seismogram will be the S waves.
These are usually bigger than the P waves.
USE THE AMPLITUDE TO DERIVE THE MAGNITUDE OF THE EARTHQUAKE AND THE
DISTANCE FROM THE EARTHQUAKE TO THE STATION.


To find the magnitude:
1. Measure the distance
      between the 1st P wave and
      1st S wave (24 seconds).
2. Find the point for 24 secs.
      On the chart and mark the
      spot. The Epicenter is 215
      kilometers away.
3. Measure the amplitude
      (height) of the strongest
      wave (23 mm).
4. Using a strait edge, draw a
      line between the 2 marks
      you made. The point where
      your line crosses the middle
      line on the chart is the
      magnitude (strength) of the
      earthquake. In this example
      the earthquake had a
      magnitude of 5.0
How Do I Locate That Earthquake's
                Epicenter?
You have figured out how far your seismograph is from the epicenter and how strong the
earthquake was, but you still don’t know where the earthquake occurred.

To figure out just where that earthquake happened, you need to look at your seismogram and you
need to have seismograms from at least two other seismographs recorded for the same
earthquake.

For our example we will use seismograms from Detroit, Minneapolis, and Charleston.

You will also need a U.S. map, a ruler, a pencil, and a compass for drawing circles on the map.
FINDING THE EPICENTER
1.   Check the scale on your map.
2.   If 1 cm = 100 km, then an epicenter
     of 215 kilometers away = 2.15 cm on map
3.   Use the compass to draw a circle with a radius of the
     number
     From step 2 (radius is the distance from the center of
     the circle to its edge. The center of the circle will be
      location of your seismograph.
4.   Do the same thing for the other seismograms. The
      point where all of the circles overlap is the epicenter
     of the earthquake.


                                                            THE POINT WHERE THE THREE CIRCLES INTERSECT IS THE EPICENTER OF
                                                            THE EARTHQUAKE.
                                                            THIS TECHNIQUE IS CALLED 'TRIANGULATION.'
<iframe width="420" height="315"
src="http://www.youtube.com/embed/hYeTtq
scgq8?rel=0" frameborder="0"
allowfullscreen></iframe>
Sources
Bolt, Bruce A. Earthquakes: A Primer. San
Francisco: W.H. Freeman, 1978. Print.

©2007 MICHIGAN TECHNOLOGICAL
UNIVERSITY. PERMISSION GRANTED FOR
REPRODUCTION FOR NON-COMMERCIAL USES.

http://www.geo.mtu.edu/UPSeis/index.htm

http://earthquake.usgs.gov/learn/glossary/?te
rm=epicenter

6.28.12

  • 1.
    Week 2 Project Gib Lucas EDU 653 Dr. Merrill 6/28/2012
  • 2.
    Earthquakes Earthquake – Suddenslip on a fault, and resulting ground shaking and radiated seismic energy caused by the slip, or by volcanic or magmatic activity, or other sudden stress changes in the earth.
  • 3.
    Earthquake Terms Amplitude –The size of the wiggles on an earthquake recording. Epicenter – The point on the earth’s surface vertically above the (hypocenter ) focus, point in the crust where a seismic rupture begins.
  • 4.
    Earthquake Terms Hypocenter –The point within the earth where an earthquake rupture starts. The epicenter is the point directly above it at the surface of the earth. Also commonly termed the focus.
  • 5.
    Earthquake Terms Magnitude –A number that characterizes the relative size of an earthquake. Magnitude is based on measurement of the maximum motion recorded by a seismograph. P wave, or compression wave, is a seismic body wave that shakes the ground back and forth in the same direction and the opposite direction as the direction the wave is moving. S wave, or shear wave, is a seismic body wave that shakes the ground back and forth perpendicular to the direction the wave is moving
  • 6.
    Earthquake Terms Seismogram –A record written by a seismograph in response to ground motions produced by an earthquake, explosion, or other ground-motion sources.
  • 7.
    Earthquake Terms The Richtermagnitude scale was developed in 1935 by Charles F. Richter of the California Institute of Technology as a mathematical device to compare the size of earthquakes. On the Richter Scale, magnitude is expressed in whole numbers and decimal fractions. For example, a magnitude 5.3 might be computed for a moderate earthquake, and a strong earthquake might be rated as magnitude 6.3. As an estimate of energy, each whole number step in the magnitude scale corresponds to the release of about 31 times more energy than the amount associated with the preceding whole number value.
  • 8.
    OBJECTIVES Reading a Seismogram Calculatingthe Magnitude of an Earthquake Finding the Epicenter of an Earthquake
  • 9.
    How Are EarthquakeMagnitudes Measured? The magnitude of most earthquakes is measured on .the Richter scale, invented by Charles F. Richter in 1934. For each whole number you go up on the Richter scale, the amplitude of the ground motion recorded by a seismograph goes up ten times. CHARLES RICHTER STUDYING A Using this scale, a magnitude 5 earthquake would SEISMOGRAM result in ten times the level of ground shaking as a magnitude 4 earthquake (and 32 times as much energy would be released).
  • 10.
    Earthquake Energy Release To give you an idea how these numbers can add up, think of it in terms of the energy released by explosives: A magnitude 1 seismic wave releases as much energy as blowing up 6 ounces of TNT. A magnitude 8 earthquake releases as much energy as detonating 6 million tons of TNT. Pretty impressive, huh? Fortunately, most of the earthquakes that occur each year are magnitude 2.5 or less, too small to be felt by most people.
  • 11.
    A TYPICAL SEISMOGRAM When you look at a seismogram, there will be wiggly lines all across it. These are all the seismic waves that the seismograph has recorded. Most of these waves were so small that nobody felt them. They can be caused by heavy traffic near the seismograph, waves hitting a beach, the wind, and any number of other ordinary things that cause some shaking of the seismograph. There may also be some little dots or marks evenly spaced along the paper. These are marks for every minute that the drum of the seismograph has been turning.
  • 12.
    What do theWiggles mean? When you look at a seismogram, there will be wiggly lines all across it. So which wiggles are the earthquake? The P wave will be the first wiggle that is bigger than the rest of the little ones . Because P waves are the fastest seismic waves, they will usually be the first ones that your seismograph records. The next set of seismic waves on your seismogram will be the S waves. These are usually bigger than the P waves.
  • 13.
    USE THE AMPLITUDETO DERIVE THE MAGNITUDE OF THE EARTHQUAKE AND THE DISTANCE FROM THE EARTHQUAKE TO THE STATION. To find the magnitude: 1. Measure the distance between the 1st P wave and 1st S wave (24 seconds). 2. Find the point for 24 secs. On the chart and mark the spot. The Epicenter is 215 kilometers away. 3. Measure the amplitude (height) of the strongest wave (23 mm). 4. Using a strait edge, draw a line between the 2 marks you made. The point where your line crosses the middle line on the chart is the magnitude (strength) of the earthquake. In this example the earthquake had a magnitude of 5.0
  • 14.
    How Do ILocate That Earthquake's Epicenter? You have figured out how far your seismograph is from the epicenter and how strong the earthquake was, but you still don’t know where the earthquake occurred. To figure out just where that earthquake happened, you need to look at your seismogram and you need to have seismograms from at least two other seismographs recorded for the same earthquake. For our example we will use seismograms from Detroit, Minneapolis, and Charleston. You will also need a U.S. map, a ruler, a pencil, and a compass for drawing circles on the map.
  • 15.
    FINDING THE EPICENTER 1. Check the scale on your map. 2. If 1 cm = 100 km, then an epicenter of 215 kilometers away = 2.15 cm on map 3. Use the compass to draw a circle with a radius of the number From step 2 (radius is the distance from the center of the circle to its edge. The center of the circle will be location of your seismograph. 4. Do the same thing for the other seismograms. The point where all of the circles overlap is the epicenter of the earthquake. THE POINT WHERE THE THREE CIRCLES INTERSECT IS THE EPICENTER OF THE EARTHQUAKE. THIS TECHNIQUE IS CALLED 'TRIANGULATION.'
  • 16.
  • 17.
    Sources Bolt, Bruce A.Earthquakes: A Primer. San Francisco: W.H. Freeman, 1978. Print. ©2007 MICHIGAN TECHNOLOGICAL UNIVERSITY. PERMISSION GRANTED FOR REPRODUCTION FOR NON-COMMERCIAL USES. http://www.geo.mtu.edu/UPSeis/index.htm http://earthquake.usgs.gov/learn/glossary/?te rm=epicenter

Editor's Notes