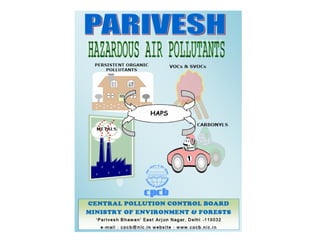
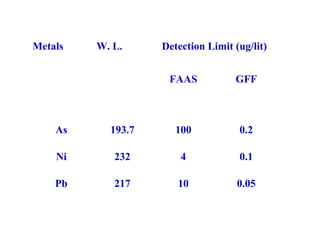
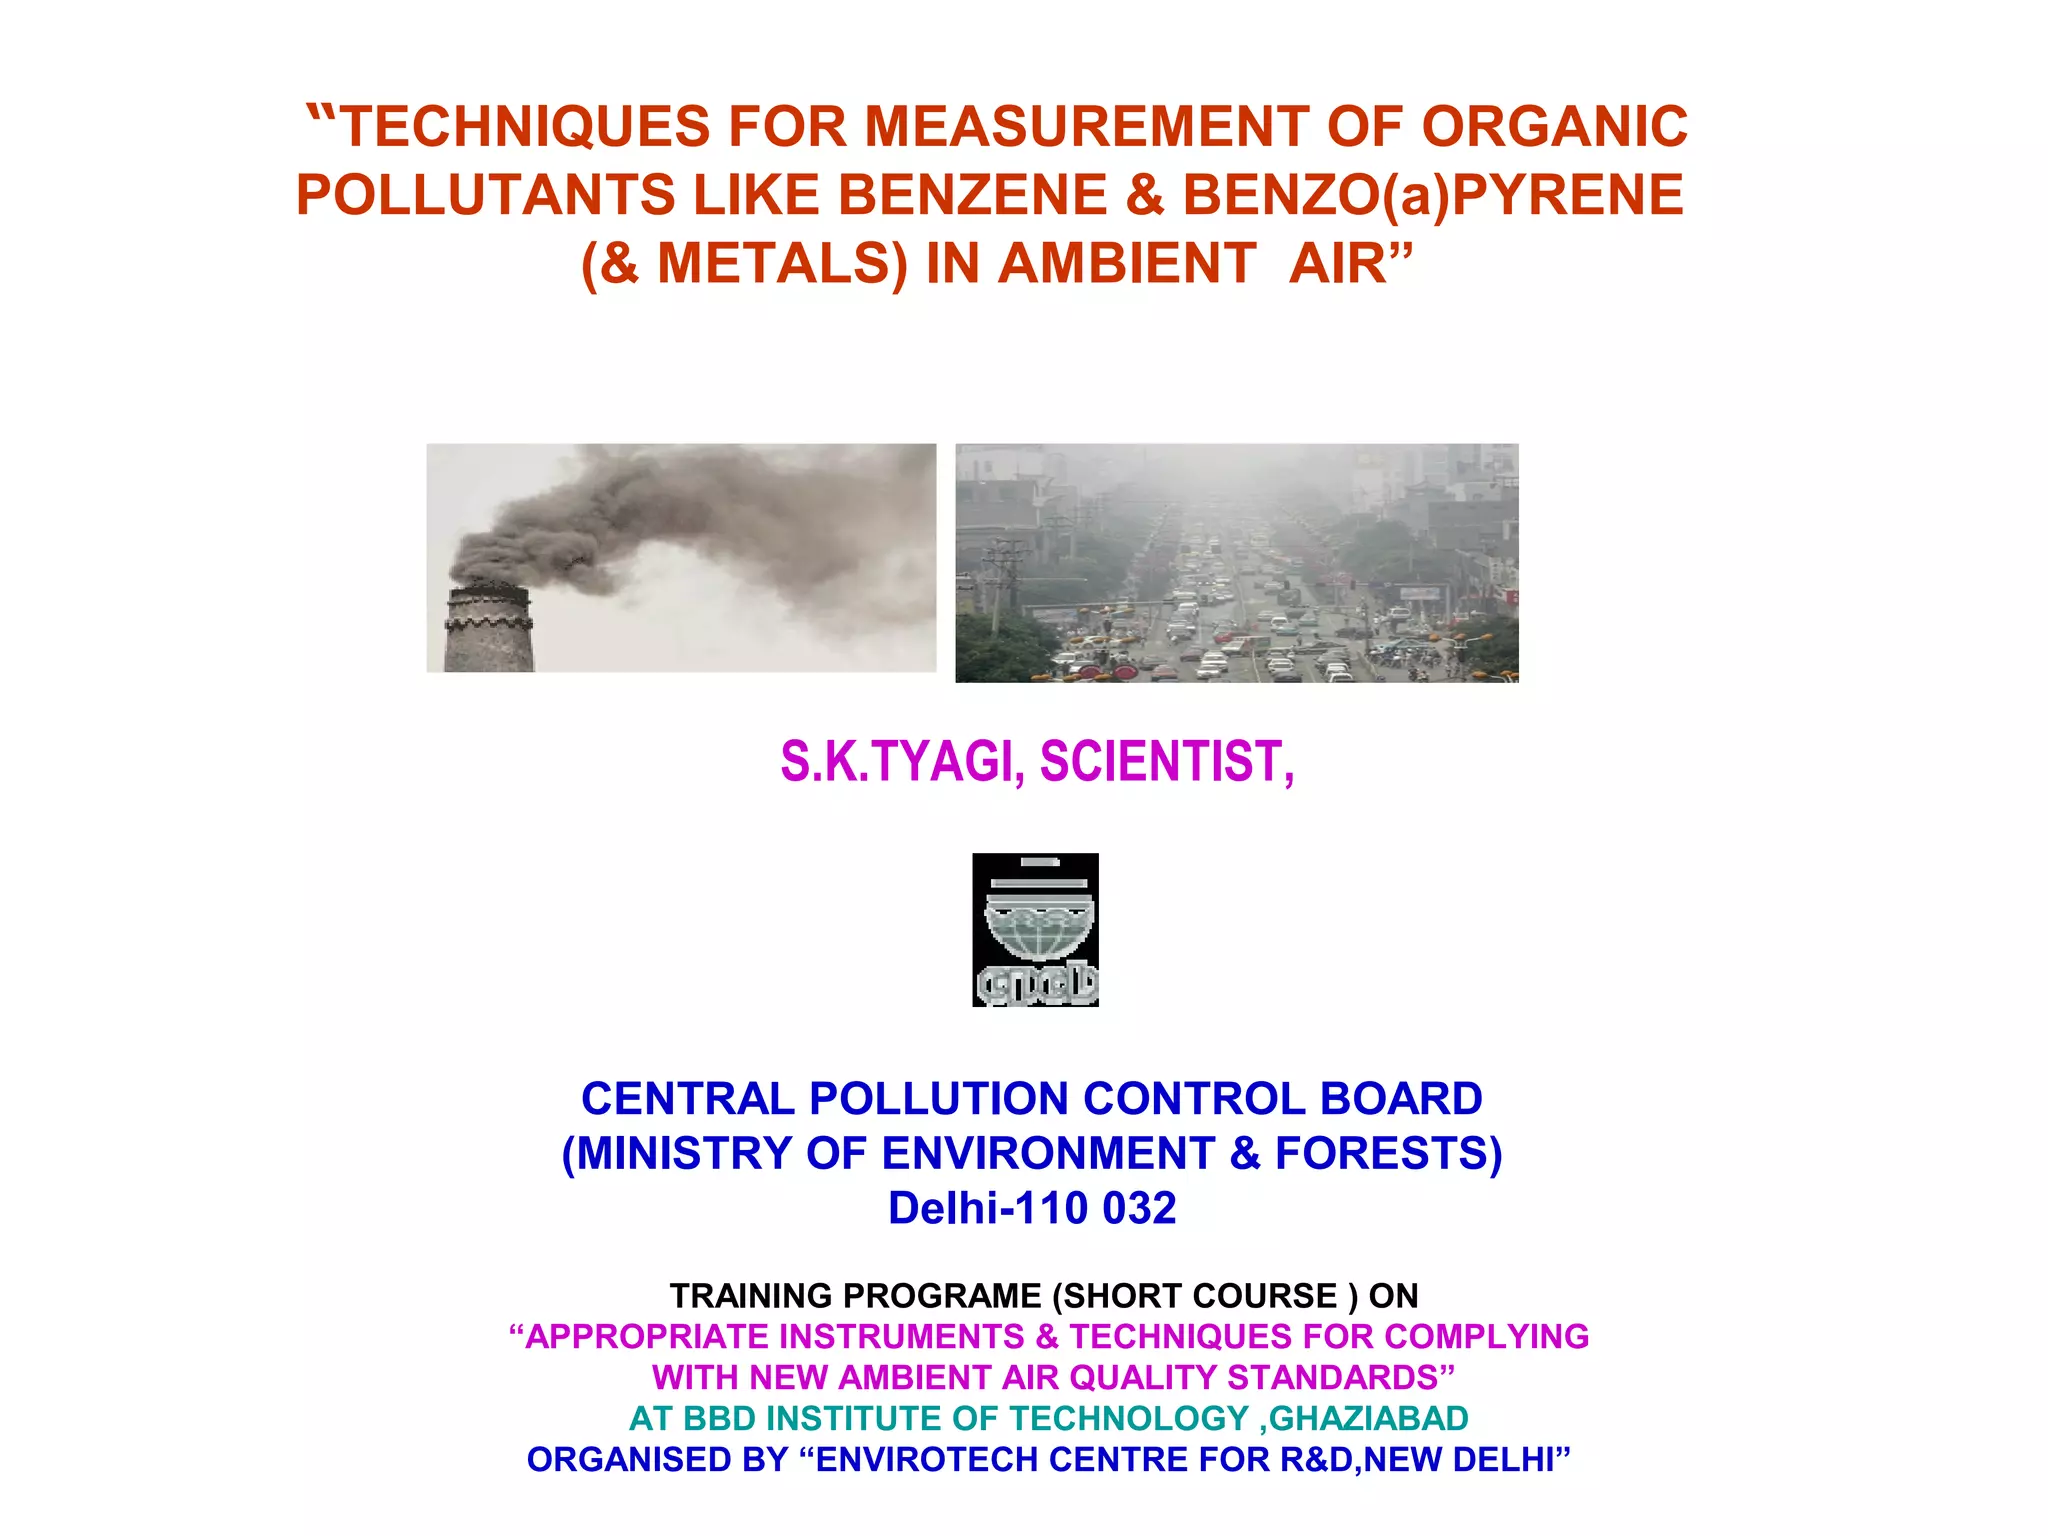
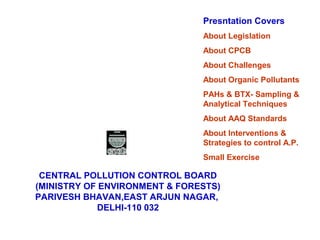
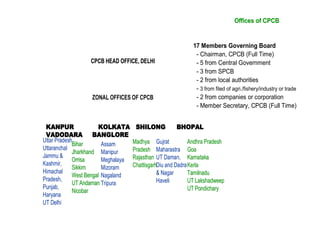
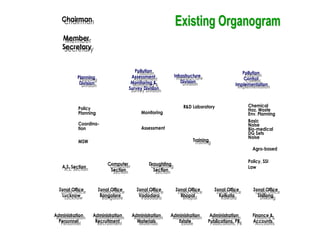
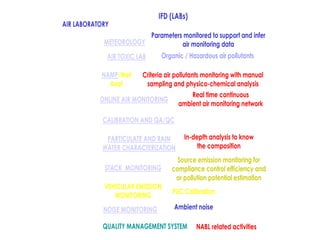
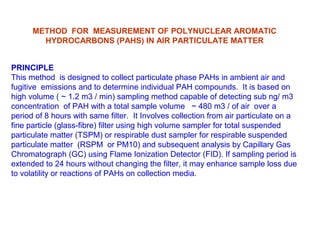
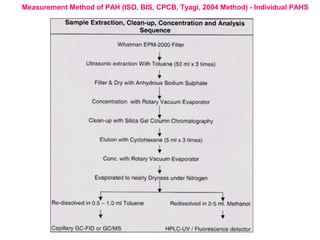
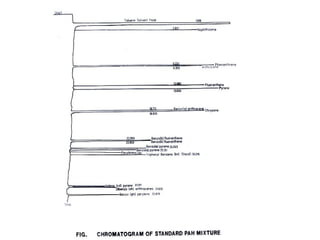
This document discusses techniques for measuring organic pollutants like benzene and benzo(a)pyrene as well as metals in ambient air. It provides an overview of the Central Pollution Control Board of India and their role in monitoring air quality and enforcing standards. Specific analytical techniques are described for sampling and analyzing polycyclic aromatic hydrocarbons and other organic compounds in air particulate matter using gas chromatography.
Plenary talk at ISPAC conference on the use of polycyclic aromatic hydrocarbons (PAHs) in environmental forensics. Covers basics of what enviromental forensics investigations (EFIs) are and how PAHs can be used to help determine sources of releases (creosote, railway ties), oil sands development and oil spill releases (Macondo oil spill, gulf oil spill).
International Journal of Engineering Research and Applications (IJERA) is a team of researchers not publication services or private publications running the journals for monetary benefits, we are association of scientists and academia who focus only on supporting authors who want to publish their work. The articles published in our journal can be accessed online, all the articles will be archived for real time access.
Our journal system primarily aims to bring out the research talent and the works done by sciaentists, academia, engineers, practitioners, scholars, post graduate students of engineering and science. This journal aims to cover the scientific research in a broader sense and not publishing a niche area of research facilitating researchers from various verticals to publish their papers. It is also aimed to provide a platform for the researchers to publish in a shorter of time, enabling them to continue further All articles published are freely available to scientific researchers in the Government agencies,educators and the general public. We are taking serious efforts to promote our journal across the globe in various ways, we are sure that our journal will act as a scientific platform for all researchers to publish their works online.
This presentation summarizes the findings of an air emissions and odour sampling program conducted on the Baytex Reno Field. The data was collected in response to local resident complaints of odours in the area. The study collected samples using industry standard procedures and analyzed by state of the art analytical equipment. The results showed that no human health effects were exceeded and that no odour thresholds were exceeded. This study exemplifies how odours may be detected even though the standard analytical practices are not able to measure the odiferous compounds. PAHs were measured in the study and show a petrogenic ligher signature present the ambient air in the region as well as diesel markers from the trucking activity. This summary report was presented on January 22, 2014 to the Peace River AER Public Proceeding (1769924).
Presentation from 2007 to AWMA conference on vapour intrusion. Presentation covers the environmental forensics investigation of gases to identify the sources of the potential vapour intrusion. Techniques used both standard gas analysis as well as isotopic analysis of selected gases to identify the likely sources.
This presentation discusses continuous monitoring and why a new method is needed that measures total nitrogen (TN) as a single result. High temperature catalytic oxidation (HTCO) is also presented as an method for monitoring TN. For more information, go to ssi.shimadzu.com or follow Shiamdzu on Twitter @shimadzussi. Thanks for viewing.
The Longitudinal Dependence of Indoor PAH Concentration on Outdoor PAH and Tr...REY DECASTRO
The influence of traffic volume and ambient outdoor PAH on indoor PAH exposure was quantified at the Baltimore Traffic Study site, an unoccupied attached 2nd-floor apartment in an inner-city neighborhood "hot spot" surrounded by urban roadways that together carry over 150,000 vehicles per day. Monitoring of outdoor and indoor particle-bound PAH and traffic volume was conducted continously for 12 months at 10-minute intervals (n = 52,560). Time-series modeling accounted for complex and extensive autocorrelation. Vehicle count (0.57 [SE=0.04] ng/m3 per 100 vehicles every ten minutes) and outdoor PAH (0.16 [0.001] ng/m3 per ng/m3 outdoor PAH) are statistically significant predictors of indoor PAH, in addition to a mean background indoor exposure without indoor sources of 9.07 ng/m3. Spring 2003 (9.99 [0.67] ng/m3) and Summer 2003 (9.27 [+/-1.27] ng/m3) are associated with the greatest increases in indoor PAH, relative to Summer 2002. An additional 1.64 [0.27] ng/m3 is attributable to work days. Winds from the SW-S-NE quarter, which would have entrained PAH from Baltimore's densely trafficked central business district and a nearby interstate highway, contribute significantly to indoor PAH (0.31 - 1.16 ng/m3). Dew point, outdoor temperature, and wind speed are also statistically significant predictors. Indoor PAH's short-term autocorrelation is ARMA[3,3], where lag 3 indicates that PAH concentrations are correlated for up to 30 minutes. Significant autoregressive correlation at lags 144 and 1008 indicate autocorrelations at diurnal and weekly cycles, respectively. In a separate time series model, it was established that outdoor PAH itself depends at a statistically significant on vehicle count at a rate of 3.17 [0.11] ng/m3 per 100 vehicles every ten minutes. Conclusion: local indoor & outdoor exposure to PAH from mobile sources is substantially modified by meteorologic and temporal conditions, including atmospheric transport processes. PAH concentration also demonstrates statistically significant autocorrelation at several timescales.
Understanding the Issues Affecting the Accuracy of Measuring Oxygen Consumpti...InsideScientific
LIVE WEBINAR: Thursday, December 7, 2017
Sponsor: http://www.aeitehcnologies.com/
During this webinar Phil Loeb introduces the measurements, variables and factors in determining VO2. He examines common sources of error and challenges that influence accuracy and reproducibility, and reviews validation methods commonly used by the research community. Following, Danny Rutar, Managing Director of Redback Biotek, presents best-practices, as embodied by the MOXUS Metabolic Cart, that are proven to minimize data error.
Background information:
Metabolic Carts have been used for decades as a means of measuring Oxygen Consumption, VO2, via indirect calorimetry. However, the accuracy of these systems is generally not well known nor well understood -- there is no universally accepted standard for determining the accuracy, or the validity, of Metabolic Cart measurements. In addition, scientists often do not have access or an appreciation for the specific calculations that are being used by these systems to calculate VO2 and other metabolic data. Collectively, this makes it challenging for researchers and physicians to understand if their data is valid.
Using environmental forensics techniques to identify fugitive methane. Techniques included VOCs, fixed gases, stable isotopes, and radioactive carbon to identify soil gas samples from a variety of urban settings.
Phytogenic or Petrogenic Hydrocarbons - Using Biomarkers for DelineationChemistry Matters Inc.
Presentation on the use of petroleum biomarkers for delineation of petroleum impacts in a high organic soil area (muskeg). Phytogenic hydrocarbons are natural compounds that are misidentified by standard analytical methodologies of high organic content soils as petroleum hydrocrabons. This artificially biases the measurements high for organic rich soils. Petroleum hydrocarbon products have distinct petrogenic biomarkers that can be used to identify if a sample contains petroleum or not. These biomarkers were used in this presentation to determine where petroleum impacts in the soil end and limit the unnecessary excavation of a muskeg chasing samples that were above guidelines due to the presence of natural hydrocarbons. Presentation shows how environmental forensics and petroleum forensics investigations can be used in an environmental site assessment.
(originally aired 07-26-12)
U.S. EPA and many state agencies are investigating fracking in Marcellus Shale’s impact on environmental water quality. Public outcry has led to drafting legislation. Increased levels of bromide in drinking water systems correlate to higher levels of brominated disinfection byproducts. Trace metals (i.e., arsenic, selenium, lead), important constituents of flowback water, must be accurately determined for regulatory compliance, challenging due to high levels of dissolved salts which can cause physical and spectral interferences. Here, experts discuss monitoring and measuring anion concentrations in water from recycling impoundments, the typical constituents reported for Marcellus Shale fracking operations, flowback water preparation, and ICP-OES and ICP-MS metals analysis.
AWMA presentation on the use of stable isotopes and other environmental forensic techniques to determine the source of fugitive methane. Originally presented in 2007 at an AWMA conference in Calgary. The presentation covered an investigative of methane in areas around Calgary using different environmental and geoforensics techniques to identify the sources of methane at the different locations. A variety of analyses were used such as isotopic analysis, VOC analysis, and gas composition analysis.
Webinar: Assessing atmospheric emissions from amine-based CO2 post-combustion...Global CCS Institute
This webinar presented the major findings of a CSIRO-led investigation into the potential air quality impacts of amine-based post-combustion carbon capture (PCC) technology. The study was commissioned by the Global Carbon Capture and Storage (CCS) Institute to expand knowledge on environmental impacts of the capture process, the study measures actual emissions as well providing a case study into air quality at the AGL Loy Lang PCC Plant in Victoria, Australia. The study aimed to address uncertainty about the types/quantities of pollutants released during PCC plant operations and what their acceptable emissions levels were. Understanding this would allow industry and regulators to develop appropriate health and safety practices around PCC plants. The research was based on data collected at CSIRO’s PCC pilot plant at the AGL Loy Yang brown coal-fired power plant in Victoria, Australia and from atmospheric degradation experiments in CSIRO’s smog chamber in New South Wales, Australia.
Dr Merched Azzi, Chief Research Scientist from CSIRO Energy Technology presentied this webinar.
A study was carried out to determine the distribution and behaviour of nitrogen (N) compounds (nitrite, nitrate, ammonia,
dissolved and particulate organic nitrogen) in Sungai Terengganu estuary (TRE). Surface water samples were collected
during ebb neap and spring tides for the longitudinal survey along the salinity gradient. The results indicated that all N
compounds behave non-conservatively with addition during both tidal cycles, except for nitrate which exhibited removal
behaviour during spring tide. In general, higher concentration of N compounds was observed during spring tide compared
to neap tide. It is suggested that during spring tide, stronger water turbulence resulted in resuspension of nutrients in
bottom sediment and lead to the increase in N compounds concentrations in the surface water. The diurnal survey for the
freshwater station showed that the concentrations of N compounds follow the ebb and flood variations, whereas for the
coastal station the reverse trend was observed. Comparisons with a previous study under similar tidal conditions show
there was an increase in nitrite and ammonia concentrations in TRE, which was probably due to increase in discharge
from the rapid development activities around this area. In addition, the presence of a breakwater at the lower part of
the estuary may also contribute to the high nutrient content in the estuary due to restricted outflow of nutrients to the
coastal area. Overall, the results from this study highlighted the importance of monitoring the N compounds for future
protection of the estuary.
Indoor Air Quality Sampling And EvaluationPeter Woodman
Indoor Air Quality Sampling and Evaluation: "MADEP’s Proposed Guidance and What it Means to LSPs"
Presented By:
Dammon M. Frecker
Vice President, Industrial Compliance and Permitting
Environmental Science Services, Inc.
and
Peter W. Woodman, Ph.D.
President
Risk Management Incorporated
Licensed Site Professionals Association Meeting - May 15, 2001
3° Presentazione del Workshop Finale del Progetto IPA/BC-Monitor
Il progetto IPA/BC-Monitor ha sviluppato un sistema innovativo, compatto e standalone, per la misura online di due componenti chiave del particolato atmosferico, IPA e BC.
Sito web del progetto: www.ipabcmonitor.it
IQ Academy Lunch & Learn Webinar | Cost Effective Water Quality Monitoring wi...IQ_UK
Lots of water quality monitoring is undertaken by the quarrying industry as part of demonstrating environmental permit compliance to the Regulator as well as day to day operational control. Cost is a very important driver in monitoring design and implementation but must not be at the expense of quality and effectiveness. This webinar will discuss how to maximise the effectiveness of water quality monitoring whilst also minimising cost.
Delivered by Dr Craig Speed, an Associate Director and Hydrochemist in Wardell Armstrong’s Water team. Craig has over 13 years of water consultancy experience and 4 years’ experience working for the Environment Agency. His expertise includes design, management and review of water quality monitoring (both groundwater and surface water), hydrochemical interpretation, providing lectures on water quality monitoring at Birmingham University, knowledge of UK water legislation (including environmental permits and abstraction licensing) and detailed knowledge of the Water Framework Directive (WFD) including WFD Compliance Assessments.
His recent project experience includes historic metal mine impact assessments, a quarry lake hydrochemistry project, a quarry conceptual model review, hydrogeology lead in major infrastructure projects, key expert in groundwater monitoring for a project in Turkey and conducting an investigation and adjudication following lime stabilisation impacts on water quality for an electrical infrastructure company.
Microbial characterisation and identification, and potability of River Kuywa ...Open Access Research Paper
Water contamination is one of the major causes of water borne diseases worldwide. In Kenya, approximately 43% of people lack access to potable water due to human contamination. River Kuywa water is currently experiencing contamination due to human activities. Its water is widely used for domestic, agricultural, industrial and recreational purposes. This study aimed at characterizing bacteria and fungi in river Kuywa water. Water samples were randomly collected from four sites of the river: site A (Matisi), site B (Ngwelo), site C (Nzoia water pump) and site D (Chalicha), during the dry season (January-March 2018) and wet season (April-July 2018) and were transported to Maseno University Microbiology and plant pathology laboratory for analysis. The characterization and identification of bacteria and fungi were carried out using standard microbiological techniques. Nine bacterial genera and three fungi were identified from Kuywa river water. Clostridium spp., Staphylococcus spp., Enterobacter spp., Streptococcus spp., E. coli, Klebsiella spp., Shigella spp., Proteus spp. and Salmonella spp. Fungi were Fusarium oxysporum, Aspergillus flavus complex and Penicillium species. Wet season recorded highest bacterial and fungal counts (6.61-7.66 and 3.83-6.75cfu/ml) respectively. The results indicated that the river Kuywa water is polluted and therefore unsafe for human consumption before treatment. It is therefore recommended that the communities to ensure that they boil water especially for drinking.
WRI’s brand new “Food Service Playbook for Promoting Sustainable Food Choices” gives food service operators the very latest strategies for creating dining environments that empower consumers to choose sustainable, plant-rich dishes. This research builds off our first guide for food service, now with industry experience and insights from nearly 350 academic trials.
Epcon is One of the World's leading Manufacturing Companies.EpconLP
Epcon is One of the World's leading Manufacturing Companies. With over 4000 installations worldwide, EPCON has been pioneering new techniques since 1977 that have become industry standards now. Founded in 1977, Epcon has grown from a one-man operation to a global leader in developing and manufacturing innovative air pollution control technology and industrial heating equipment.
Improving the viability of probiotics by encapsulation methods for developmen...Open Access Research Paper
The popularity of functional foods among scientists and common people has been increasing day by day. Awareness and modernization make the consumer think better regarding food and nutrition. Now a day’s individual knows very well about the relation between food consumption and disease prevalence. Humans have a diversity of microbes in the gut that together form the gut microflora. Probiotics are the health-promoting live microbial cells improve host health through gut and brain connection and fighting against harmful bacteria. Bifidobacterium and Lactobacillus are the two bacterial genera which are considered to be probiotic. These good bacteria are facing challenges of viability. There are so many factors such as sensitivity to heat, pH, acidity, osmotic effect, mechanical shear, chemical components, freezing and storage time as well which affects the viability of probiotics in the dairy food matrix as well as in the gut. Multiple efforts have been done in the past and ongoing in present for these beneficial microbial population stability until their destination in the gut. One of a useful technique known as microencapsulation makes the probiotic effective in the diversified conditions and maintain these microbe’s community to the optimum level for achieving targeted benefits. Dairy products are found to be an ideal vehicle for probiotic incorporation. It has been seen that the encapsulated microbial cells show higher viability than the free cells in different processing and storage conditions as well as against bile salts in the gut. They make the food functional when incorporated, without affecting the product sensory characteristics.
Top 8 Strategies for Effective Sustainable Waste Management.pdfJhon Wick
Discover top strategies for effective sustainable waste management, including product removal and product destruction. Learn how to reduce, reuse, recycle, compost, implement waste segregation, and explore innovative technologies for a greener future.
ENVIRONMENT~ Renewable Energy Sources and their future prospects.tiwarimanvi3129
This presentation is for us to know that how our Environment need Attention for protection of our natural resources which are depleted day by day that's why we need to take time and shift our attention to renewable energy sources instead of non-renewable sources which are better and Eco-friendly for our environment. these renewable energy sources are so helpful for our planet and for every living organism which depends on environment.
Presented by The Global Peatlands Assessment: Mapping, Policy, and Action at GLF Peatlands 2024 - The Global Peatlands Assessment: Mapping, Policy, and Action
Dr tyagi lecture presentn bbit enviro final 12 feb10
1. “TECHNIQUES FOR MEASUREMENT OF ORGANIC
POLLUTANTS LIKE BENZENE & BENZO(a)PYRENE
(& METALS) IN AMBIENT AIR”
S.K.TYAGI, SCIENTIST,
CENTRAL POLLUTION CONTROL BOARD
(MINISTRY OF ENVIRONMENT & FORESTS)
Delhi-110 032
TRAINING PROGRAME (SHORT COURSE ) ON
“APPROPRIATE INSTRUMENTS & TECHNIQUES FOR COMPLYING
WITH NEW AMBIENT AIR QUALITY STANDARDS”
AT BBD INSTITUTE OF TECHNOLOGY ,GHAZIABAD
ORGANISED BY “ENVIROTECH CENTRE FOR R&D,NEW DELHI”
2. CENTRAL POLLUTION CONTROL BOARD
(MINISTRY OF ENVIRONMENT & FORESTS)
PARIVESH BHAVAN,EAST ARJUN NAGAR,
DELHI-110 032
Presntation Covers
About Legislation
About CPCB
About Challenges
About Organic Pollutants
PAHs & BTX- Sampling &
Analytical Techniques
About AAQ Standards
About Interventions &
Strategies to control A.P.
Small Exercise
3. 1. The Water (Prevention & Control of Pollution) Act, 1974
2. The Water (Prevention & Control of Pollution) Cess, Act, 1977
3. The Air (Prevention & Control of Pollution) Act, 1981
4. The Environment (Protection) Act, 1986
5. Environmental Impact Assessment Notification
6. The Hazardous Waste (Management and Handling) Rules 1989
7. The Bio - Medical Waste (Management and Handling) Rules 1988
8. The Municipal Solid Waste (Management and Handling) Rules 2000
9. The Noise Pollution (Regulation & Control) Rules, 2000
10. The Batteries (Management and Handling) Rules 2001
Major EnvironmentalMajor Environmental
Acts/RulesActs/Rules
4. CPCB HEAD OFFICE, DELHICPCB HEAD OFFICE, DELHI
KANPUR KOLKATA SHILONG BHOPAL
VADODARA BANGLORE
Uttar Pradesh
Uttaranchal
Jammu &
Kashmir,
Himachal
Pradesh,
Punjab,
Haryana
UT Delhi
BiharBihar
JharkhandJharkhand
OrrisaOrrisa
SikkimSikkim
West BengalWest Bengal
UT AndamanUT Andaman
NicobarNicobar
Assam
Manipur
Meghalaya
Mizoram
Nagaland
Tripura
MadhyaMadhya
PradeshPradesh
RajasthanRajasthan
ChattisgarhChattisgarh
Gujrat
Maharastra
UT Daman,
Diu and Dadra
& Nagar
Haveli
Andhra PradeshAndhra Pradesh
GoaGoa
KarnatakaKarnataka
KerlaKerla
TamilnaduTamilnadu
UT LakshadweepUT Lakshadweep
UTUT PondicharyPondichary
ZONAL OFFICES OF CPCB
Offices of CPCBOffices of CPCB
17 Members Governing Board
- Chairman, CPCB (Full Time)
- 5 from Central Government
- 3 from SPCB
- 2 from local authorities
- 3 from filed of agri./fishery/industry or trade
- 2 from companies or corporation
- Member Secretary, CPCB (Full Time)
6. Activities of IFD (Activities of IFD (LABsLABs.).)
CPCB Laboratory, DelhiCPCB Laboratory, Delhi
WATER
LABORATORY
AIR
LABORATORY
SOPHISTICATED
INSTRUMENTATION LABORATORY
BIO
LABORATORY
TREATABILITY
LABORATORY
NATIONAL REFERRAL
TRACE ORGANIC LABORATORY
- Laboratory management
- Monitoring activities
- Laboratory analysis
- R & D Activities
- Quality Assurance / Quality
Control system
- Strengthening of laboratories
- Scientific services to SPCBs,
MoEF, etc.
- Training of Personnel
7. AIR LABORATORY
IFD (LABs)
AIR TOXIC LAB
METEOROLOGY
NAMP/Wet
Anal
ONLINE AIR MONITORING
STACK MONITORING
PARTICULATE AND RAIN
WATER CHARACTERIZATION
CALIBRATION AND QA/QC
Parameters monitored to support and infer
air monitoring data
Organic / Hazardous air pollutants
Criteria air pollutants monitoring with manual
sampling and physico-chemical analysis
Real time continuous
ambient air monitoring network
Static injection facility for
AQC of gaseous pollutants
QUALITY MANAGEMENT SYSTEM
In-depth analysis to know
the composition
Source emission monitoring for
compliance control efficiency and
or pollution potential estimation
VEHICULAR EMISSION
MONITORING
PUC Calibration
NABL related activities
NOISE MONITORING Ambient noise
8.
9.
10. Alveolar macrophages in sputum
a, Rural control; b, Urban control; c & d, Exposed to vehicular emission
Epidemiological study by CNRI on children in Delhi to assess respiratory
health status of 10,000 school children
11. National Ambient Air Quality Monitoring Programme (NAMP)
Started in 1984 - 7 Station ( Manual Station)
By 2000 - Increased to 295 Stations (Operated and
Maintained by SPCB /CPCB / Universities,
etc. and funded by CPCB)
By 2009 - Increased to 346 Stations
Monitoring in Delhi
3 (old) +3 (new) Continuous AQMS
2 Mobile air Laboratories
6 Manual AQMS
1 Integrated Air Quality Monitoring Station being set up
About 300 continuous stations maintained by industries.
12. Parameters Monitored
Criteria Pollutants - SPM, RSPM (PM10), SO2, NOx,
CO, Pb, NH3 (additional parameters
at few locations)
Other Parameters: - PM2.5, O3, BTX, PAHs
Monitoring Techniques
SO2 – Absorption in TCM and Spectrophotometric determination
SPM, RSPM (PM10), PM2.5 – High Volume / Low Volume Sampling followed by
Gravimetric analysis
NOx – Absorption in NaOH, Na- Arsenite solution followed by Spectrophotometric
determination
Pb + other metals – Particulate Lead AAS analysis after acid digestion
O3 – Both manual and automatic method; VOCs & PAHs -GCMS
CO, SO2, NOx, O3, BTX, -Automatic analyser
13. S.
No.
Parameter Method Instrument
1. Determination of Suspended
particulate matter (SPM) in
the atmosphere
High Volume
Method
High Volume
Sampler
(HVS)
2 Measurement of Respirable
suspended particulate
matter (PM10 in air
Cyclonic flow
techniques
Respirable Dust
Sampler (RDS)
3. Determination of Sulphur
dioxide in air
Modified West and
Gaeke Method
Spectrophotometer
4. Determination of Nitrogen
dioxide in atmosphere
Sodium Arsenite
Method
Spectrophotometer
5. Measurement of Carbon
monoxide
In Air by U-V
photometric O3
Analysis
Automatic Analyser
6. Determination of Ozone in
atmosphere
Buffered Potassium
Iodide Method
Spectrophotometer
7. Determination of Hydrocarbon
(HC), Benzene, Toluene and
Xylene (BTX) & PAHs
G.C. Method Gas
Chromatograph
8. Determination of Heavy
Metal in atmosphere
AAS Method Atomic Absorption
Spectrophotometer
Measurement Methods of Air Pollutants
14. • The complex organic compound have got into use in many diverse
applicationsencompassing all types of human activities.
• While rural environments often have high levels of pesticides and other
residues from sprays of weedicides and other chemicals used in modernfarming,
•urban environments have high doses of a host of organics coming from paints
& varnishes, lacquers, solvents, foam blowingagents, sprays etc.
•Recent addition of Benzene in petrol, in place of a leadcompound, has made
Benzene and itsderivatives a part of vehicular pollution.Already Benzene
concentrations in high traffic areas and near petrol pumps have become a matter
of concern.
•Unfortunately a majority ofthese compounds are highly toxic and many ofthem
have been reported to the carcinogenic.
•Organic compounds are also reported to bepre-cursers for Ozone formation and
play arole in secondary formation of oxidants.
•As such air pollution monitoring networks are now beginning intensive efforts
for monitoring of specific organic compounds such as Benzene,Toluene &
Xylene (BTX)and often a mixture of polynuclear aromatic hydrocarbons (PAHS) .
ORGANIC COMPOUNDS
16. METHOD FOR MEASUREMENT OF POLYNUCLEAR AROMATIC
HYDROCARBONS (PAHS) IN AIR PARTICULATE MATTER
PRINCIPLE
This method is designed to collect particulate phase PAHs in ambient air and
fugitive emissions and to determine individual PAH compounds. It is based on
high volume ( ~ 1.2 m3 / min) sampling method capable of detecting sub ng/ m3
concentration of PAH with a total sample volume ~ 480 m3 / of air over a
period of 8 hours with same filter. It Involves collection from air particulate on a
fine particle (glass-fibre) filter using high volume sampler for total suspended
particulate matter (TSPM) or respirable dust sampler for respirable suspended
particulate matter (RSPM or PM10) and subsequent analysis by Capillary Gas
Chromatograph (GC) using Flame Ionization Detector (FID). If sampling period is
extended to 24 hours without changing the filter, it may enhance sample loss due
to volatility or reactions of PAHs on collection media.
18. SAMPLE PRESERVATION
Sample should be wrapped in a aluminum-foil and should be
stored in a refrigerator at 4oC in dark place to avoid photo-
oxidation of PAHs for a period upto two months. However, sample
extracts may be strored in dried form for a longer period
SAMPLE PROCESSING
The filters samples are extracted with Toluene using
ultrasonication & concentrated to 1ml volume .
GAS CHROMATOGRAPHIC ANALYSIS
Dilute the extracted residue and make up to 0.5 ml or 1 ml. Inject 1 µl or 2
µl into GC-FID for analysis.
GAS CHROMATOGRAPHY CONDITIONS
Gas chromatograph equipped with flame ionization detector (FID), a split
injector and capillary column (Phase cross linked 5% phenyl, methyl-
silicone) : 25 meter length, 0.20 mm inner diameter (I.D.), 0.33 µm film
thickness with following GC conditions:
ANALYSIS
23. The concentration in ng/ m3 of each analyte in the air sampled is
given
by:
C = Cs x Ve / Vs
Where
Ve = final volume of extract, µl
CALCULATION
7.1 Calculate the concentration in (ng/µl ) of each identified analyte
in the
sample extract ( Cs ) as follows:
Cs (ng/µl) = (As * Cis ) / ((Ais * RF )
Where
As = Area count of characteristic analyte sample/peak being
measured.
Ais = Area count of characteristic internal standard/peak.
Cis = Concentration of internal Standard.
26. Common Monitoring Protocol
Field sampling is critical as far as VOC is concerned 3
established sampling methods are available for field
sampling
• Canister Method
• Tenax Method
• Charcoal Method
Other sampling methods that are followed have
limitations are
• Tedlerbag method
• PUF method
27. Vapor Phase Sampling
• Sorbent tube
• Canister
• On-line air stream
Results for
Dichloroethane,
Benzene & Toluene
are within a
difference of
10%
When sorbent tube
& Canister methods
are compared
28. METHOD ADVANTAGES DISADVANTAGES
Passive
samplers
•
Very low cost · Very simple
· No dependance on mains
electricity
· Can be deployed in very large
numbers
· Useful for screening, mapping
and baseline studies
•
Useful for prelim survey only
• In general only provide monthly and
weekly averages
• Slow data throughput
• Samplers require laboratory analysis
Active
Samplers Low cost
•Easy to operate
•Reliable operation
•Reliable performance
•Historical dataset
Provide daily average
•Labour intensive sample collection
and analysis
•Laboratory analysis required
Automat
ic
Aanalyse
rs
Proven
•High performance
•Hourly data
•On-line information
Complex
•Expensive
•High skill (Repair & maintenance)
requirement
•High recurrent cost
29. THE TWO APPROACHES TO MEASUREMENT OF
VOCS IN AIR:
a) Taking the sample:
adsorption on activated charcoal/Tenax-Chromosorb
b) Sample Processing:
solvent extraction(CS2)/ thermal desorption
c) Separation: gas chromatography with capillary columns
Identification & Quantification:
Flame ionisation detector (FID)/Mass spectrometry
(MS)
d) PASSIVE / ACTIVE SAMPLING
33. Procedure
• Diffusion tube is exposed for two weeks in the
ambient air.
• After exposure the charcoal of the exposed tube
is transferred in the sample vials and desorbed
using carbon-disulfide(CS2 ).
• Desorption is done employing Ultra-sonic bath
followed by centrifugation.
• Samples are analysed on Gas chromatograph.
34. Calculations
C = (M-Mblank) / DE x U t’
Where:
C : concentration of the measured compound in µg/m3
M : determined mass of the measured compound in ng
M blank : weight (ng) of analyte organic vapour on blank tube
DE : desorption efficiency ( 0.98 )
U : uptake rate in l/h at 25°C(benzene 0.387 l/h,
toluene 0.343 l/h)
t’ : sampling duration in hours
Conc. (µg/m3
) = Conc. (µg/m3
) * 101.3 (273+T)
At (STP) (at ambient condition)
--------------------------------------------------
298 * Pa
Where:
T: Temperature in Kelvin of the ambient air,
Pa: Atmospheric pressure, kPa
35. ACTIVE SAMPLING
USING ACTIVATED CHARCOAL TUBES , DESOERBED BY
CARBON-DI SULPHIDE
PRINCIPLE
The charcoal tubes are available in different sizes and contain varying
amount of activated charcoal. The ambient air is sucked through the
tube using a low flow personal sampler in a way that results in an
enrichment of the relevant substances in the activated charcoal.
Desorption of the adsorbed benzene is done using Carbon disulfide
(CS2).
The substances desorbed in the CS2 are analyzed by capillary gas
chromatography.
A flame ionization detector (FID) is used for analysis while
quantification is performed using the internal/ external standard.
36. APPARATUS
1 LOW VOLUME PUMP
Intrinsically safe, portable, battery powered pump with a low flow
controller with operating range between 5 to 500 ml/min (+/- 0.2
ml/min).to suck the air sample , low flow pump* capable of accurate &
adjustable flow with time programmable with selectable run time from
15minutes to 8hr, built in flow indicator and rechargeable battery
should be preferred for sampling of BTX.
2 SAMPLING SORBENT (SAMPLE) TUBES
The most extensively used sorbent tubes are 1/4 inch or 6 mm O.D.
glass lined (or fused silica lined) stainless steel tub or stainless steel.
Different suppliers provide different size tubes and packing lengths;
however, 3.5 inch long tubes with a 6 cm of sorbent bed of 200 mg of
activated charcoal (coconut shell) or other suitable adsorbent (Figure-
2.1) are generally used to collect the sample.
37. Envirotech had made an Organic Vapour Sampler (APM 850) several years
ago. The APM 856 Organic Vapour Sampler has evolved from the
experiences gained and the feedback received from the users of the APM
850 and now provides a system which meets all important requirements for
field measurements of gaseous organic pollutants in ambient air.
40. A sample is collected by opening a tube at two ends, connecting it to a
sample pump, and pulling air through the tube with the pump. Airborne
chemicals are trapped onto the surface of the sorbent.
Two tubes are used in series to take care of breakthrough (if any)
compatible to the thermal desorber . The sampling is carried out using
low flow sampler. The sampling train is given in the figure –2.2
Keep the tube in a vertical position during sampling to prevent the
possibility of channeling that can lead to under sampling
The arrow on the tube indicates air flow direction and should point to the
tube holder and pump. If no arrow is present, the smallest section should
be near the tube holder
Sampling flow rate in the range of 20-30ml /min is required (+/- 0.2 ml/min)
for ambient air.
SAMPLING PROCEDURE & SAMPLING RATE
41. Any suitable gas chromatograph with flame ionization detector (FID) with
fused silica capillary columns having a length of 25 meter or more, an
internal diameter of 320 µm or below and with a stationary phase film
thickness less than 1.5 µm as follows or equivalent may be recommended.
Capillary Column 624, Coating: cyanopropyl phenyl polysiloxane Length *
ID: 30m* 0.25 mm , Film thickness (df) : 1.4µm
Calibration
Prepare a mix stock standard solution of 50 µg/µl of benzene, toluene &
xylene each gravimetrically. using a micro syringe in the eluting solvent
i.e. CS2 . Prepare further diluted solutions of concentration range of 10,
1.0, 0.10 µg/µl with CS2 from stock standard in a clean vial. Make up to one
ml solution. Introduce immediately 1µL standard solution into the injector
of GC directly and plot the curve between the concentration & response
(peak area).
GAS CHROMATOGRAPHIC ANALYSIS
43. GC – ATD - MS
Electron IonisationElectron Ionisation : M + e- M+. + 2e-
CH4 + e- CH4+. + 2e-
CH4+. CH3+ + H.
Primary ionsPrimary ions
44.
45. Analytical Procedure
Samples collected through active sampling (sorbent tubes) are
extracted or desorbed by conventional solvent (generally 1-2 ml of
carbon disulfide) using ultrasonication for 15 minutes to remove
analye from the sorbent material . Desorbed samples are analyzed
using gas chromatograph (GC) fitted with capillary column and flame
ionization detector (FID). A single tube may provide enough samples to
permit several analyses.
47. Amount of analyte compound found on tube can be converted into µg/m3
by using the formula-
Volume of air (ml) = Sampling rate (ml/min) * Sampling time
(Sucked through the adsorption tube)
Conc. (µg/m3
) = Amount of compound found (µg) per µl injection ample
(at ambient condition) * Total volume of the sample extracted (ml) * 103
Vol. of sample extract injected into GC (µl) * Vol. of
Air sucked through the tube (m3)
CALCULATIONS
Blank value is to be subtracted from
the amount of compound found in the sample.
48. Fig :1 BENZENE LEVELS IN AMBIENT AIR IN DELHI
110
248
382
116
169
428
0
50
100
150
200
250
300
350
400
450
August, 1998 Nov-98
CONC.INug/m3
Residential Area Traffic intersection Petrol Pump
49. ON-LINE BENZENE ANALYZER
(THE SYNSPEC ALPHA 400 BENZENE ANALYSER)
THE NEW SYNSPEC ALPHA BENZENE IS A VERY SIMPLE BUT PRECISE
FOR THE MEASUREMENT OF BENZENE IN AMBIENT AIR.
Alpha is a compact GC containing all the essential elements:
preconcentration sampling unit, backflush valve, separation column in
special small oven unit and detector. The detector is a PID.
52. MEASURING PRINCIPLE:
The gas sample is
concentrated in a TRAP.
The sample is then
desorbed and injected over
the valve into a column and
benzene passes on to the
detector. The system is
optimized for ambient
benzene concentrations.
Alpha is a compact GC
containing all the essential
elements: preconcentration
sampling unit, backflush
valve, separation column
in special small oven unit
and detector. The detector
is a PID.
53. Chromatograph of MLU Analyser – 19Chromatograph of MLU Analyser – 19thth
September 0330 hrs.September 0330 hrs.
55. Fig.-5:AVERAGE CONCENTRATION OF BENZENE AND TOLUENE
DURING -2004
5.2 5.1
3.9
6.5 5.8
7.2
8.5
7.1
13.5
18.4
14.8
9.6 10.3
7.7
13.2
10 9.7
13
18.6
35.9
47.3
35.9
0.0
5.0
10.0
15.0
20.0
25.0
30.0
35.0
40.0
45.0
50.0
Ja
n
-04
F
e
b
-04
M
ar-0
4
A
p
r-04
M
ay
-0
4
Ju
n
-0
4
Ju
l-0
4
A
ug
-04
S
e
p
-0
4
O
c
t-0
4
N
ov
-04
D
ec
-0
4
MONTH
CONCENTRATION(ug/m3)
BENZENE TOLUENE
56. Maintenance and Calibration
Tips for On-Line VOC Analyzer
Due to its design, the BTX Analyzer requires little maintenance.
However following regular maintenance must be carried out for
continuous smooth operation of the Analyzer.
• Check or if needed replace the PTFE Sample Inlet dust Filter at
an interval of every week/15-days.
• Check fluid , pressure & Flows parameters using instruments
built-in diagnosis facility at an interval of every week/15-days
• Check the stability of retention times.
If retention times of the measured compound is out side the
retention time window which is usually +- 0.5 seconds then
make a reset.
57. Calibration:
• Calibration must be carried out regularly to check
the quality of measurements made using the on-line
BTX analyzer. This also make it possible to check
whether or not programming of retention times and
sensitivities is correct.
• Zero and a single point span check calibration
checks can be performed on the analyzer for
complete verification operation on the
characteristics of the analyzer
• linearity,
• detectable limits,
• check of retention times etc
58. ppm = (mg/m3) x (24.45/MW)
Expressing
Concentration in ppm
ppm= [(mg/m3)x(24.45/MW)x(760/P)x((T+273)/298)]
59. PM 10 & 2.5 CONTINUOUS MONITOR AT BHADUR SHAH
ZAFAR MARG (ITO), NEW DELHI
SIDE VIEW
CPCB
CONTINUOUS
MONITORING
STATION AT
DELHI
COLLEGE OF
ENGINEERING
,BAWANA,
DELHI
60. CALIBRATION AND AQC
Pioneer lab in India who developed
the ifrastructure and extended AQC
facilities to SPCBs, Industries etc.
for gaseous pollutants
Primary Calibrations for all the
online Parameters are being done
here with tracable standard gases
and Field based instruments are
calibrated subsequently in regular
intervals
Calibrations of all the manual
Instruments are done with different
calibrators time to time
61.
62. ANNUAL TREND : TOTAL POLYCYCLIC AROMATIC HYDROCARBONS IN AMBIENT
AIR IN DELHI (1993-2000)
0
10
20
30
40
50
60
70
80
Minimum Maximum Average Monsoon Winter Summer
Range ------>
Conc.inng./m3
Year1993 Year1994 Year 1995 Year1996 Year1997 Year 1998 Year 1999 Yea
63.
64. The ambient air quality objectives/standards are pre-requisite for developing
programme for effective management of ambient air quality and to reduce the
damaging effects of air pollution.
The objectives of air quality standards are:
• To indicate the levels of air quality necessary with an adequate margin of
safety to protect the public health, vegetation and property;
• To assist in establishing priorities for abatement and control of pollutant level;
• To provide uniform yardstick for assessing air quality at national level; and
• To indicate the need and extent of monitoring programme.
The Central Pollution Control Board had adopted first ambient air quality
standards on November 11, 1982 as per section 16 (2) (h) of the Air (Prevention
and Control of Pollution) Act, 1981.
The air quality standards have been revised by the Central Pollution Control Board
on April 11, 1994. The latest revised National Ambient Air Quality Standards of
CPCB notified as on November 16, 2009 are depicted as follows:
National Ambient Air Quality Standards
65. EXISTING NATIONAL AMBIENT AIR QUALITY STANDARDS (NAAQS)
Pollutant
Time Weighted
Average
Concent ration in Ambient Air Method of Measurement
I ndustri
al Area
Resident ial,
Rural and
ot her Areas
Sensitive
Area
Sulphur Dioxide
(SO2)
Annual
Average*
80
µg/ m3
60 µg/ m3 15 µg/ m3 1. I mproved West and Gaeke
Method
2. Ultraviolet Fluorescence24 Hours
Average* *
120
µg/ m3
80 µg/ m3
30 µg/ m3
Oxides of
Nitrogen
as NO2
Annual
Average*
80
µg/ m3
60 µg/ m3
15 µg/ m3
1. Jacob & Hochheiser modified
(NaOH-NaAsO2
) Met hod
2. Gas Phase Chemiluminiscence24 Hours
Average* *
120
µg/ m3
80 µg/ m3
30 µg/ m3
Suspended
Particulate
Matt er (SPM)
Annual
Average*
360
µg/ m3
140 µg/ m3
70 µg/ m3
High Volume Sampling (Average
flow rate not less than
1.1m3
/ minute)24 Hours
Average* *
500
µg/ m3
200 µg/ m3
100 µg/ m3
Respirable
Particulate
Matt er (Size less
than 10µm)
(RPM)
Annual
Average*
120
µg/ m3
60 µg/ m3
50 µg/ m3
Respirable Part iculate Matt er
Sampler24 Hours
Average* *
150
µg/ m3
100 µg/ m3
75 µg/ m3
Lead (Pb) Annual
Average*
1.0
µg/ m3
0.75 µg/ m3
0.50 µg/ m3
AAS Met hod after sampling using
EPM 2000
or equivalent filter paper24 Hour
Average* *
1.5
µg/ m3
1.0 µg/ m3
0.75 µg/ m3
Carbon
Monoxide (CO)
8 Hours
Average* *
5.0
mg/ m3
2.0 mg/ m3
1.0 mg/ m3
Non dispersive I nfrared
Spectroscopy1 Hour
Average
10.0mg/
m3
4.0 mg/ m3
2.0 mg/ m3
Ammonia (NH3
) Annual
Average*
0.1 mg/ m3
-
24 Hour
Average* *
0.4 mg/ m3
66.
67.
68. So far State Governments of the all the sixteen critically polluted cities as identified
by the Hon’ble Supreme Court of India have submitted their action plan for
controlling air Pollution from all the major sources including industrial, vehicular &
domestic sources. The major actions those have been proposed for almost all the
cities are:
1. Industrial Pollution
Shifting of Industries from non- confirming zones, Switching over to clean
technologies, Using clean fuel, Installation of Pollution control Devices
Development of green belt, etc.
2. Vehicular Pollution
Implementation of the emission norms as well as fuel quality in accordance
with the road map proposed by the Auto Fuel Policy, Switching over to
clean alternate fuels like CNG, LPG & Bio-fuels, Augmentation in Public
Transport system ,Better traffic Management, Implementation of fiscal
measures, etc
3. Domestic Pollution
Ban on open burning of garbage, biomass, Augmentation on supply of LPG
as cooking fuel,
Action Plan for Controlling Air Pollution
69.
70. Carbon Monoxide (CO) levels in Ambient Air
Year 1997-98 1998-99 1999-2000 2000-01 2001-02 2002-03 2003-04
Carbon Monoxide 5.45 4.241 4.686 4.183 3.258 2.831 2.581
Vehicle Population 3 3.2 3.4 3.5 3.6 3.8 4.1
VehicleRegistrationinMillions
Valuesinmg/m3
IMPACTS OF INTERVENTIONS ON THE
AIR POLLUTANTS IN DELHI
74. Methods of Sampling and Analysis of
Metals in Ambient Air
(CADMIUM, CHROMIUM, IRON, LEAD, MANGANESE, NICKEL, COBALT,
ALUMINUM, VANADIUM, AND ZINC)
PRINCIPLE
This method is designed to collect particulate phase Metals in the
ambient air and fugitive emissions and to determine individual
metal . It is based on high volume ( ~ 1.2 m3 / min) sampling method
capable of detecting ng/ m3 concentration of metal with a total
sample volume ~ 480 m3 / of air over a period of 8 hours with same
filter. It Involves collection from air particulate on a fine particle
(glass-fibre) filter using high volume sampler for total suspended
particulate matter (TSPM) or respirable dust sampler for respirable
suspended particulate matter (RSPM or PM10) and subsequent
analysis by Flame Atomic Absorption Spectroscopy (FAAS) after the
digestion of samples with concentrated nitric acid & hydrochloric
acid .
75. Atomic absorption spectrometer measures absorption of
characteristic radiation by atoms of a particular element to be
determined which are thermally atomized either by flame or by
graphite furnace.
The element which is to be determined is dissolved in a
suitable vehicle (normally an acid)
In case of furnace atomization auto sampler or micro syringe
is used for transforming the sample solution into the furnace.
A hallow cathode lamp of the element to be determined is
used as a source of radiation, which is absorbed by the atoms
produced in flame or furnace of that element and absorption is
directly proportional to the concentration of the analyte atoms.
PRINCIPLE
77. Cool and filter the solution in a 100 ml volumetric
flask
Bring the solution up to the 100 ml mark using
distilled water
Analyse the sample using the AAS with relevant
Hollow Cathode
AAS Method for Metals
Digest Filter paper with HNO3:HCl (3:8ml) in 100ml at
80o
C for 4 hour or so till the final volume is about 10 ml
78. Metals W. L. Detection Limit (ug/lit)
FAAS GFF
As 193.7 100 0.2
Ni 232 4 0.1
Pb 217 10 0.05
79. Q1. Calculate Volume of Air Sampled in m3 from following data?
Sampling Period 4 hour
Sampling Rate of LVS 200ml/min
Calculate Vol. of Air
Sampled (m3
) =
Q2. Calculate Volume of Air Sampled in m3 & Benzene Conc. In
Ambient Air from following data
Slope (ug/ml) for 1ul inj
4.35712452981368
E-06
Peak Area 5000
Flow Rate of LVS 80 ml/min
Total Sampling Time 4hr
Calculate Tot Vol of Air(m3)
Ambient Temp @45degree C
Calculate Benzene Conc (ug/m3)
@45degree C Ambient condition
Calculate Benzene Conc (ug/m3)
@25degree C Ambient condition
80. Q1. Vol of Air Sampled (m3) =
0.048
Q2. Tot Vol of Air Sampled (m3) =
19.2
Bz Conc (ug/m3) @45degree C =
1.13
Bz Conc (ug/m3) @25degree C =
1.06
ANSWERS
83. The Photovac 2020 PRO uses
photoionization, the technology of
choice for detecting VOCs. The 2020
PRO is equipped standard with a 10.6
eV UV lamp, and has an optional 11.7
eV UV lamp for ionizing chlorinated
compounds.
Operating concentration range is 0.1-
2000 PPM or use the optional dilution
probe to detect up to 20,000 PPM.
The Photovac photoionization detector
is humidity-compensated so you can
rely on the results in PPM range.
Portable Total VOC Sensor/Monitor