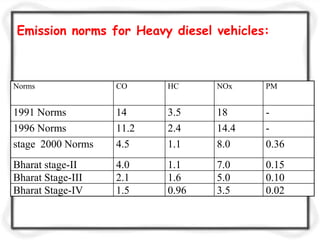
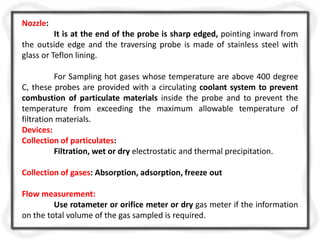
Air Quality Sampling and
Monitoring
Prepared by
A.VENKATESH
Air Quality Sampling
and Monitoring...
2
Air Quality:
Sampling and measurement of air
pollutants is called air quality monitoring.
The information so obtained is helpful in
monitoring in implementing control
measures for reducing pollutant
concentrations.
3
• Measurements of air quality generally fall into 2
classes:
Stack Sampling- Generally deals with pollutants
emitted from a source.
Ambient Air Quality Measurement – Pollutant
levels in the ambient atmosphere is measured.
4
Air Sampling Techniques
5
• When obtaining a sample for air pollution analysis
– Sufficient sample for analysis:
This is due to the fact that the concentration of
pollutants in the ambient air likely to be extremely
small.
There are both gaseous and particulate air pollutants
whose concentration occur at levels 1mg per cubic
meter of air.
Pollutants collected from air sampling techniques may
be reactive.
Site Selection
6
• General Requirements for Site Selection
– purpose of monitoring
– number and type of instruments required
– duration of measurements
– should be easily accessible
Collection of Gaseous Air Pollutants:
7
Grab Sampling
Absorption in liquids
Adsorption in solids
Freeze out Sampling
GRAB SAMPLING:
In grab sampling the sample is collected by
filling an evacuated flask or an inflatable bag.
Plastic bags are being widely used for grab
sampling.
Losses in garb sampling can be minimized
by performing the analysis immediately after
collection.
Absorption in Liquids:
Absorption separates the desired pollutants
from air either through direct solubility in the
absorbing medium or by chemical reaction.
Fritted gals absorber where the gas stream
is broken up into extremely small bubbles, thus
promoting an intimate contact between the gas
and the liquid.
One of the most widely used is impinger,
the gas stream is impinged at high velocity onto
the a flat surface thus providing a good contact
between gas and the liquid.
Adsorption on Solids:
The sample air is passed through a packed
column containing a finely divided solid
adsorbent on whose free the pollutants are
retained and concentrated.
Most widely used adsorbers are activated
carbon, silica gel and activated charcoal.
Freeze-out Sampling:
11
A series of cold traps which are maintained at
progressively low temperature are used to draw the air
where the pollutants are condensed.
COOLANT TEMPERATURE
(CENTIGRADES)
ICE WATER 0
ICE SALT -21
DRY ICE AND ACETONE -79
LIQUID OXYGEN -183
LIQUID NITROGEN -196
COLLECTION OF PARTICULATE
POLLUTANTS
 Particulate pollutants are grouped generally into
those that settle out due to force of gravity and
those that remain suspended as aerosols.
 1st category consisting of large particle of size
grater then 10 micrometer can be collected using
sedimentation technique.
 2nd category containing particles of smaller size
more sophisticated technique like filtration,
electrostatic precipitator etc are used.
 Most instruments function is to collect pollutants,
the analysis of weight is done seprately.
SEDIMENTATION (DUSTFALL JAR)
 Simplest device used for
sampling particles larger
than 10 micrometer.
 A collector consists of a
plastic jar of about 20-
35cm height and 10-15cm
diameter at the base with a
slight inward tapering of
the walls from top to
bottom.
 The sample is deposited
over a period of one month
and the material is dried
and weighed. Usually, only
water insoluble dustfall
reported in mg/cm2.
Sedimentation
Dust particles larger than 10 micrometer are rarely
carried for distance grater than 1km, station must be
closely spaced for meaningful data.
Advantages:
The method is simple and inexpensive and
requires no electrical power or moving parts.
Disadvantages:
Method lacks precision and is selective and
usually nonrepeatable.
Hence this method show pollution trend in a
specific region over a period of time
HIGH VOLUME FILTRATION
 Method is popular for
measurement of the mass
concentration of suspended
particulates smaller than
10micrometer.
 In this method, a known volume
of air is sucked by a high speed
blower through a fine filter and
the increase in weight due to
trapped particles is measured.
HIGH VOLUME SAMPLER
 Filter is made of fibrous material, provide a dense
porous medium through which an air stream must
change direction in a random fashion, allowing the
entrained particles to impact on the filter material
 A glass fiber filter used in air sampler has an
efficiency of 99% for particles of size 0.3
micrometer and it is moderately effective for
trapping particles of size as 0.05 micrometer.
 Sampling time is 24 hour and during this time over
2000 m3 of air is sucked through filter.
 The particulate level is generally expressed in
terms of microgram/cubic meter.
Sample calculation
 Air flow through clean filter =1.7 m^3/min
 Air flow through filter at the end of the test=1.4
m^3/min
 Average air flow=1.55m^3/min = 2232m^3 in 24
hour
 Weight of the clean filter= 5.000 gm
 Weight of the filter after exposure= 5.348 gm
 Weight of the particulate dust= 0.348gm
=0.348x10^6 microgram
 Suspended particulate concentration=
(0.348x10^6)/2232= 156 microgram/m^3
TAPE SAMPLER
 Tape sampler is also known as ‘beta gauge’. It
has appearance that looks like a reel to reel tape
recorder.
 In this method known volume of air is passed
through a paper tape which is advanced in
discrete time intervals from a supply reel to take-
up reel.
 During sampling tape is held stationary. Sampling
time could be from 10 min to 2 hours, depending
upon the amount of particulates.
 The air is passed through the nozzle and the
particulates are collected on the paper tape
forming a spot.
 A more realistic analysis of spot is based upon beta-ray
attenuation from which the mass concentration of particulates
can be estimated.
 Here a beam of beta ray of Io intensity is passed through tape
and intensity is measured.
Tape sampler
Tape sampler
 The measurement is reported as ‘COH/1000 ft’ where COH is known as
coefficient of optical haze.
 Some guidelines are required for interpreting COH values in terms of the
degree of pollution. This table provides a typical rating system for values
of COH per 1000 linear feet versus the degree of air pollution.
 Spots so obtained are evaluated by analyzing the amount of light
transmitted.
COH DEGREE OF POLLUTION
0 - 0.9 Light
1 – 1.9 Medium
2 – 2.9 Heavy
3 – 3.9 Very heavy
4 – 4.9 Extremely heavy
Tape sampler
Electrostatic Precipitators
Prof SSJahagirdar, NKOCET 2
2
• Electrostatic precipitators (ESP)are particulate
collection devices that use electrostatic force
to remove the particles less than 5 micron in
diameter.
• It is difficult to use gravity settlers and
cyclones effectively for the said range of
particles. Particlesassmallasone-tenth ofa
micrometer can be
100% efficiency
removed with almost
using electrostatic
precipitators.
Plate
Type
Prof SSJahagirdar, NKOCET 23
Prof SSJahagirdar, NKOCET 24
13
• stepbystepprocessof
removingparticles
Ionization - Charging of particles
Migration - Transporting the
charged particles to the collecting
surfaces
Collection- Precipitation of the
charged particles onto the
collecting surPrfofaSSJcahageirdasr, NKOCET
ChargeDissipation - Neutralizing the
charged particles on the collecting
surfaces
Particle Dislodging- Removing the
particles from thecollecting surface to
the hopper
Particle Removal- Conveying the
particles from the hopper toadisposal
point
Prof SSJahagirdar, NKOCET 26
Prof SSJahagirdar, NKOCET 27
Emission norms for passenger cars ( Petrol)
Norms CO( g/km) HC+ NOx)(g/km)
1991Norms 14.3-27.1 2.0(Only HC)
1996 Norms 8.68-12.40 3.00-4.36
1998Norms 4.34-6.20 1.50-2.18
stage
2000 norms
2.72 0.97
Bharat stage-II 2.2 0.5
Bharat Stage-III 2.3 0.35(combined)
Bharat Stage-IV 1.0 0.18(combined)
Emission Norms for 2/3 Wheelers ( Petrol)
Norms CO ( g/km) HC+ NOx (g/km)
1991 norms 12-30 8-12 (only HC)
1996 norms 4.5 3.6
stage
2000 norms
2.0 2.0
Bharat stage-II 1.6 1.5
Bharat Stage-III 1.0 1.0
Emission Norms for 2/3 Wheelers ( Petrol)
Emission norms for Heavy diesel vehicles:
Norms CO HC NOx PM
1991 Norms 14 3.5 18 -
1996 Norms 11.2 2.4 14.4 -
stage 2000 Norms 4.5 1.1 8.0 0.36
Bharat stage-II 4.0 1.1 7.0 0.15
Bharat Stage-III 2.1 1.6 5.0 0.10
Bharat Stage-IV 1.5 0.96 3.5 0.02
Stack Sampling
Stack sampling or source sampling may be defined as a
method of collecting representative samples of Pollutant laden
air/gases at the place of origin of pollutants to determine the
total amount of pollutants emitted into the atmosphere from a
given source in a given time.
The purpose of stack sampling is to determine emission
levels from plant processes to ensure they are in compliance with
any emission limits set by regulatory authorities to prevent
environmental air pollution.
Sampling System:
Stack sampling is carried out by diverting a part of
the gas stream through a sampling “train” of which a
general arrangement is shown below:
1 Nozzle 2 Sampling probe 3 Particulate collector 4 Gas
collector 5 Gas flow meter 6 Flow control valve 7 To
vacuum pump
Nozzle:
It is at the end of the probe is sharp edged, pointing inward from
the outside edge and the traversing probe is made of stainless steel with
glass or Teflon lining.
For Sampling hot gases whose temperature are above 400 degree
C, these probes are provided with a circulating coolant system to prevent
combustion of particulate materials inside the probe and to prevent the
temperature from exceeding the maximum allowable temperature of
filtration materials.
Devices:
Collection of particulates:
Filtration, wet or dry electrostatic and thermal precipitation.
Collection of gases: Absorption, adsorption, freeze out
Flow measurement:
Use rotameter or orifice meter or dry gas meter if the information
on the total volume of the gas sampled is required.
Different conditions:
1. Sample collection Velocity (V) > Stack gas velocity (W)
2. Sample collection Velocity (V) < Stack gas velocity (W)
3. Sample collection Velocity (V) = Stack gas velocity (W)
TYPES OF SAMPLING:
 Iso – similar or the same
 Kinetic – Moving energy,
motion
 DEFINITION
Sampling at such a rate that the velocity of the
gas entering the sampling Nozzle is the same
as that of the gas in the duct/stack at the
same sampling point
Diagrammatic Representation of
Sampling Points in a Duct/Stack:
Method Prescribed in the standard are:
SO2
1. Improved West and Gaeke
2. Ultraviolet Fluorosence
NOx
1. Jacob & Hochheiser (Na-Arsenite)
2. Chemiluminescence's
PM10 & PM 2.5
1.Gravimetric
West-Gaeke Colorimetric Procedure:
1. SO2 is absorbed in Sodium Tetra-Chloromercurate
(Cl4HgNa2)to form a stable and non-volatile
Dichlorosulphitomercurate complex.
2. The formed compound is then reacted with
Formaldehyde and Pararosaniline yielding a magnet
colored Pararosaniline Sulphonic Acid.
3. concentration over a range of 0.002 to 5 ppm.
Ambient Air quality
Standards
43
NAAQM network is operated through NEERI
and CPCB
Ambient Air Quality Status is described as Low
(L), Moderate (M), High (H) and Critical (C)
2 types of NAAQS: primary and secondary
NAAQS
NAAQS
Revised NAAQS 2009
PM 2.5 and ozone have been included
Standards for NOx has been made more
stringent
Standards for short duration exposure to deadly
gases like ozone and CO have been set
Tighter standards for „sensitive areas‟have been
notified. (forest &natural vegetation)
Air Quality Index
 Is a number used by government agencies to
characterize the quality of the air at a given location.
49

Air sampling

  • 1.
    Air Quality Samplingand Monitoring Prepared by A.VENKATESH
  • 2.
    Air Quality Sampling andMonitoring... 2
  • 3.
    Air Quality: Sampling andmeasurement of air pollutants is called air quality monitoring. The information so obtained is helpful in monitoring in implementing control measures for reducing pollutant concentrations. 3
  • 4.
    • Measurements ofair quality generally fall into 2 classes: Stack Sampling- Generally deals with pollutants emitted from a source. Ambient Air Quality Measurement – Pollutant levels in the ambient atmosphere is measured. 4
  • 5.
    Air Sampling Techniques 5 •When obtaining a sample for air pollution analysis – Sufficient sample for analysis: This is due to the fact that the concentration of pollutants in the ambient air likely to be extremely small. There are both gaseous and particulate air pollutants whose concentration occur at levels 1mg per cubic meter of air. Pollutants collected from air sampling techniques may be reactive.
  • 6.
    Site Selection 6 • GeneralRequirements for Site Selection – purpose of monitoring – number and type of instruments required – duration of measurements – should be easily accessible
  • 7.
    Collection of GaseousAir Pollutants: 7 Grab Sampling Absorption in liquids Adsorption in solids Freeze out Sampling
  • 8.
    GRAB SAMPLING: In grabsampling the sample is collected by filling an evacuated flask or an inflatable bag. Plastic bags are being widely used for grab sampling. Losses in garb sampling can be minimized by performing the analysis immediately after collection.
  • 9.
    Absorption in Liquids: Absorptionseparates the desired pollutants from air either through direct solubility in the absorbing medium or by chemical reaction. Fritted gals absorber where the gas stream is broken up into extremely small bubbles, thus promoting an intimate contact between the gas and the liquid. One of the most widely used is impinger, the gas stream is impinged at high velocity onto the a flat surface thus providing a good contact between gas and the liquid.
  • 10.
    Adsorption on Solids: Thesample air is passed through a packed column containing a finely divided solid adsorbent on whose free the pollutants are retained and concentrated. Most widely used adsorbers are activated carbon, silica gel and activated charcoal.
  • 11.
    Freeze-out Sampling: 11 A seriesof cold traps which are maintained at progressively low temperature are used to draw the air where the pollutants are condensed. COOLANT TEMPERATURE (CENTIGRADES) ICE WATER 0 ICE SALT -21 DRY ICE AND ACETONE -79 LIQUID OXYGEN -183 LIQUID NITROGEN -196
  • 12.
    COLLECTION OF PARTICULATE POLLUTANTS Particulate pollutants are grouped generally into those that settle out due to force of gravity and those that remain suspended as aerosols.  1st category consisting of large particle of size grater then 10 micrometer can be collected using sedimentation technique.  2nd category containing particles of smaller size more sophisticated technique like filtration, electrostatic precipitator etc are used.  Most instruments function is to collect pollutants, the analysis of weight is done seprately.
  • 13.
    SEDIMENTATION (DUSTFALL JAR) Simplest device used for sampling particles larger than 10 micrometer.  A collector consists of a plastic jar of about 20- 35cm height and 10-15cm diameter at the base with a slight inward tapering of the walls from top to bottom.  The sample is deposited over a period of one month and the material is dried and weighed. Usually, only water insoluble dustfall reported in mg/cm2.
  • 14.
    Sedimentation Dust particles largerthan 10 micrometer are rarely carried for distance grater than 1km, station must be closely spaced for meaningful data. Advantages: The method is simple and inexpensive and requires no electrical power or moving parts. Disadvantages: Method lacks precision and is selective and usually nonrepeatable. Hence this method show pollution trend in a specific region over a period of time
  • 15.
    HIGH VOLUME FILTRATION Method is popular for measurement of the mass concentration of suspended particulates smaller than 10micrometer.  In this method, a known volume of air is sucked by a high speed blower through a fine filter and the increase in weight due to trapped particles is measured.
  • 16.
    HIGH VOLUME SAMPLER Filter is made of fibrous material, provide a dense porous medium through which an air stream must change direction in a random fashion, allowing the entrained particles to impact on the filter material  A glass fiber filter used in air sampler has an efficiency of 99% for particles of size 0.3 micrometer and it is moderately effective for trapping particles of size as 0.05 micrometer.  Sampling time is 24 hour and during this time over 2000 m3 of air is sucked through filter.  The particulate level is generally expressed in terms of microgram/cubic meter.
  • 17.
    Sample calculation  Airflow through clean filter =1.7 m^3/min  Air flow through filter at the end of the test=1.4 m^3/min  Average air flow=1.55m^3/min = 2232m^3 in 24 hour  Weight of the clean filter= 5.000 gm  Weight of the filter after exposure= 5.348 gm  Weight of the particulate dust= 0.348gm =0.348x10^6 microgram  Suspended particulate concentration= (0.348x10^6)/2232= 156 microgram/m^3
  • 18.
    TAPE SAMPLER  Tapesampler is also known as ‘beta gauge’. It has appearance that looks like a reel to reel tape recorder.  In this method known volume of air is passed through a paper tape which is advanced in discrete time intervals from a supply reel to take- up reel.  During sampling tape is held stationary. Sampling time could be from 10 min to 2 hours, depending upon the amount of particulates.  The air is passed through the nozzle and the particulates are collected on the paper tape forming a spot.
  • 19.
     A morerealistic analysis of spot is based upon beta-ray attenuation from which the mass concentration of particulates can be estimated.  Here a beam of beta ray of Io intensity is passed through tape and intensity is measured. Tape sampler
  • 20.
  • 21.
     The measurementis reported as ‘COH/1000 ft’ where COH is known as coefficient of optical haze.  Some guidelines are required for interpreting COH values in terms of the degree of pollution. This table provides a typical rating system for values of COH per 1000 linear feet versus the degree of air pollution.  Spots so obtained are evaluated by analyzing the amount of light transmitted. COH DEGREE OF POLLUTION 0 - 0.9 Light 1 – 1.9 Medium 2 – 2.9 Heavy 3 – 3.9 Very heavy 4 – 4.9 Extremely heavy Tape sampler
  • 22.
    Electrostatic Precipitators Prof SSJahagirdar,NKOCET 2 2 • Electrostatic precipitators (ESP)are particulate collection devices that use electrostatic force to remove the particles less than 5 micron in diameter. • It is difficult to use gravity settlers and cyclones effectively for the said range of particles. Particlesassmallasone-tenth ofa micrometer can be 100% efficiency removed with almost using electrostatic precipitators.
  • 23.
  • 24.
  • 25.
    13 • stepbystepprocessof removingparticles Ionization -Charging of particles Migration - Transporting the charged particles to the collecting surfaces Collection- Precipitation of the charged particles onto the collecting surPrfofaSSJcahageirdasr, NKOCET
  • 26.
    ChargeDissipation - Neutralizingthe charged particles on the collecting surfaces Particle Dislodging- Removing the particles from thecollecting surface to the hopper Particle Removal- Conveying the particles from the hopper toadisposal point Prof SSJahagirdar, NKOCET 26
  • 27.
  • 28.
    Emission norms forpassenger cars ( Petrol) Norms CO( g/km) HC+ NOx)(g/km) 1991Norms 14.3-27.1 2.0(Only HC) 1996 Norms 8.68-12.40 3.00-4.36 1998Norms 4.34-6.20 1.50-2.18 stage 2000 norms 2.72 0.97 Bharat stage-II 2.2 0.5 Bharat Stage-III 2.3 0.35(combined) Bharat Stage-IV 1.0 0.18(combined)
  • 29.
    Emission Norms for2/3 Wheelers ( Petrol) Norms CO ( g/km) HC+ NOx (g/km) 1991 norms 12-30 8-12 (only HC) 1996 norms 4.5 3.6 stage 2000 norms 2.0 2.0 Bharat stage-II 1.6 1.5 Bharat Stage-III 1.0 1.0 Emission Norms for 2/3 Wheelers ( Petrol)
  • 30.
    Emission norms forHeavy diesel vehicles: Norms CO HC NOx PM 1991 Norms 14 3.5 18 - 1996 Norms 11.2 2.4 14.4 - stage 2000 Norms 4.5 1.1 8.0 0.36 Bharat stage-II 4.0 1.1 7.0 0.15 Bharat Stage-III 2.1 1.6 5.0 0.10 Bharat Stage-IV 1.5 0.96 3.5 0.02
  • 31.
    Stack Sampling Stack samplingor source sampling may be defined as a method of collecting representative samples of Pollutant laden air/gases at the place of origin of pollutants to determine the total amount of pollutants emitted into the atmosphere from a given source in a given time. The purpose of stack sampling is to determine emission levels from plant processes to ensure they are in compliance with any emission limits set by regulatory authorities to prevent environmental air pollution.
  • 32.
    Sampling System: Stack samplingis carried out by diverting a part of the gas stream through a sampling “train” of which a general arrangement is shown below: 1 Nozzle 2 Sampling probe 3 Particulate collector 4 Gas collector 5 Gas flow meter 6 Flow control valve 7 To vacuum pump
  • 33.
    Nozzle: It is atthe end of the probe is sharp edged, pointing inward from the outside edge and the traversing probe is made of stainless steel with glass or Teflon lining. For Sampling hot gases whose temperature are above 400 degree C, these probes are provided with a circulating coolant system to prevent combustion of particulate materials inside the probe and to prevent the temperature from exceeding the maximum allowable temperature of filtration materials. Devices: Collection of particulates: Filtration, wet or dry electrostatic and thermal precipitation. Collection of gases: Absorption, adsorption, freeze out Flow measurement: Use rotameter or orifice meter or dry gas meter if the information on the total volume of the gas sampled is required.
  • 34.
    Different conditions: 1. Samplecollection Velocity (V) > Stack gas velocity (W) 2. Sample collection Velocity (V) < Stack gas velocity (W) 3. Sample collection Velocity (V) = Stack gas velocity (W)
  • 35.
  • 36.
     Iso –similar or the same  Kinetic – Moving energy, motion  DEFINITION Sampling at such a rate that the velocity of the gas entering the sampling Nozzle is the same as that of the gas in the duct/stack at the same sampling point
  • 38.
  • 40.
    Method Prescribed inthe standard are: SO2 1. Improved West and Gaeke 2. Ultraviolet Fluorosence NOx 1. Jacob & Hochheiser (Na-Arsenite) 2. Chemiluminescence's PM10 & PM 2.5 1.Gravimetric
  • 41.
    West-Gaeke Colorimetric Procedure: 1.SO2 is absorbed in Sodium Tetra-Chloromercurate (Cl4HgNa2)to form a stable and non-volatile Dichlorosulphitomercurate complex. 2. The formed compound is then reacted with Formaldehyde and Pararosaniline yielding a magnet colored Pararosaniline Sulphonic Acid. 3. concentration over a range of 0.002 to 5 ppm.
  • 43.
  • 44.
    NAAQM network isoperated through NEERI and CPCB Ambient Air Quality Status is described as Low (L), Moderate (M), High (H) and Critical (C) 2 types of NAAQS: primary and secondary
  • 45.
  • 46.
  • 47.
    Revised NAAQS 2009 PM2.5 and ozone have been included Standards for NOx has been made more stringent Standards for short duration exposure to deadly gases like ozone and CO have been set Tighter standards for „sensitive areas‟have been notified. (forest &natural vegetation)
  • 48.
    Air Quality Index Is a number used by government agencies to characterize the quality of the air at a given location.
  • 49.