Download as PDF, PPTX
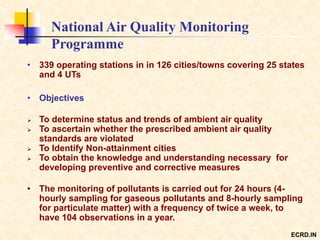
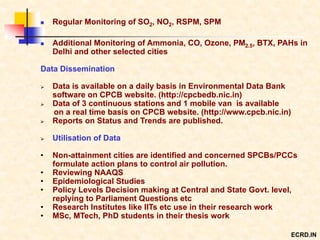
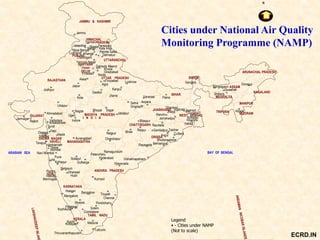
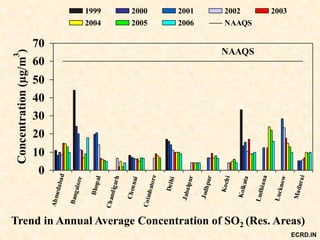
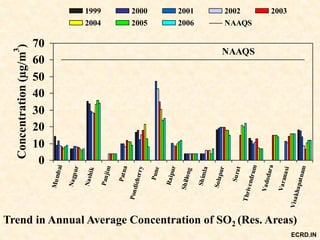
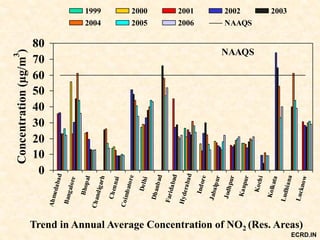
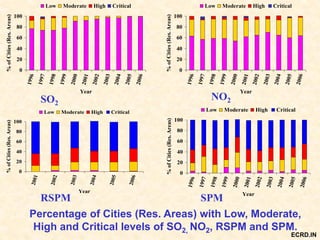
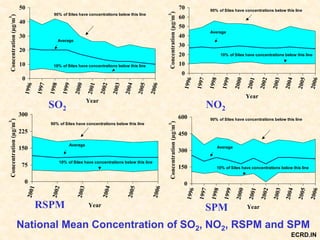
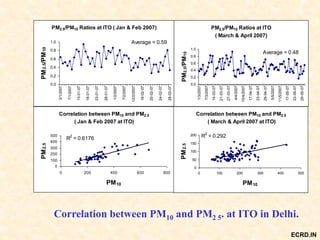
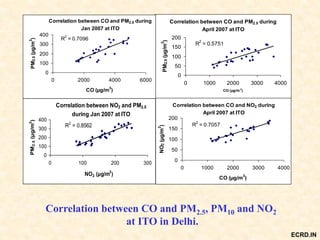
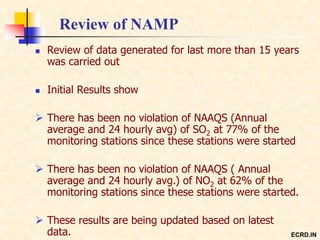

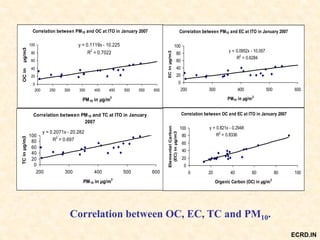
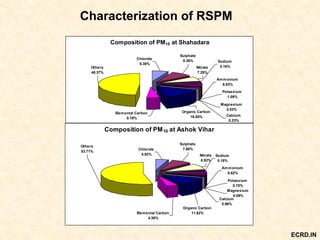
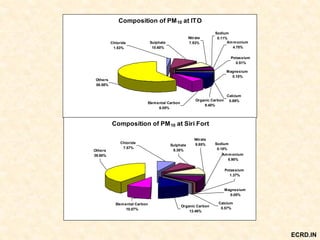
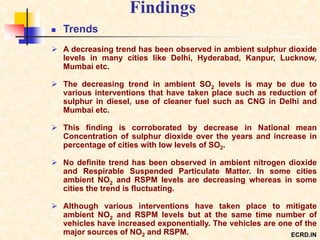


This document summarizes findings from India's National Air Quality Monitoring Programme. It includes the following key points: - The program monitors 339 stations across India to determine compliance with air quality standards and identify non-attainment cities. Monitoring includes parameters like PM2.5, SO2, and NO2. - Data shows that over time, more cities are within air quality standards for SO2 and NO2, but particulate levels remain a challenge with only a small percentage of cities meeting standards. - Studies in Delhi found particulate levels correlated closely with other pollutants like CO and NO2. Ratios of PM2.5 to PM10 were also calculated. - Organic and elemental carbon


