Download to read offline


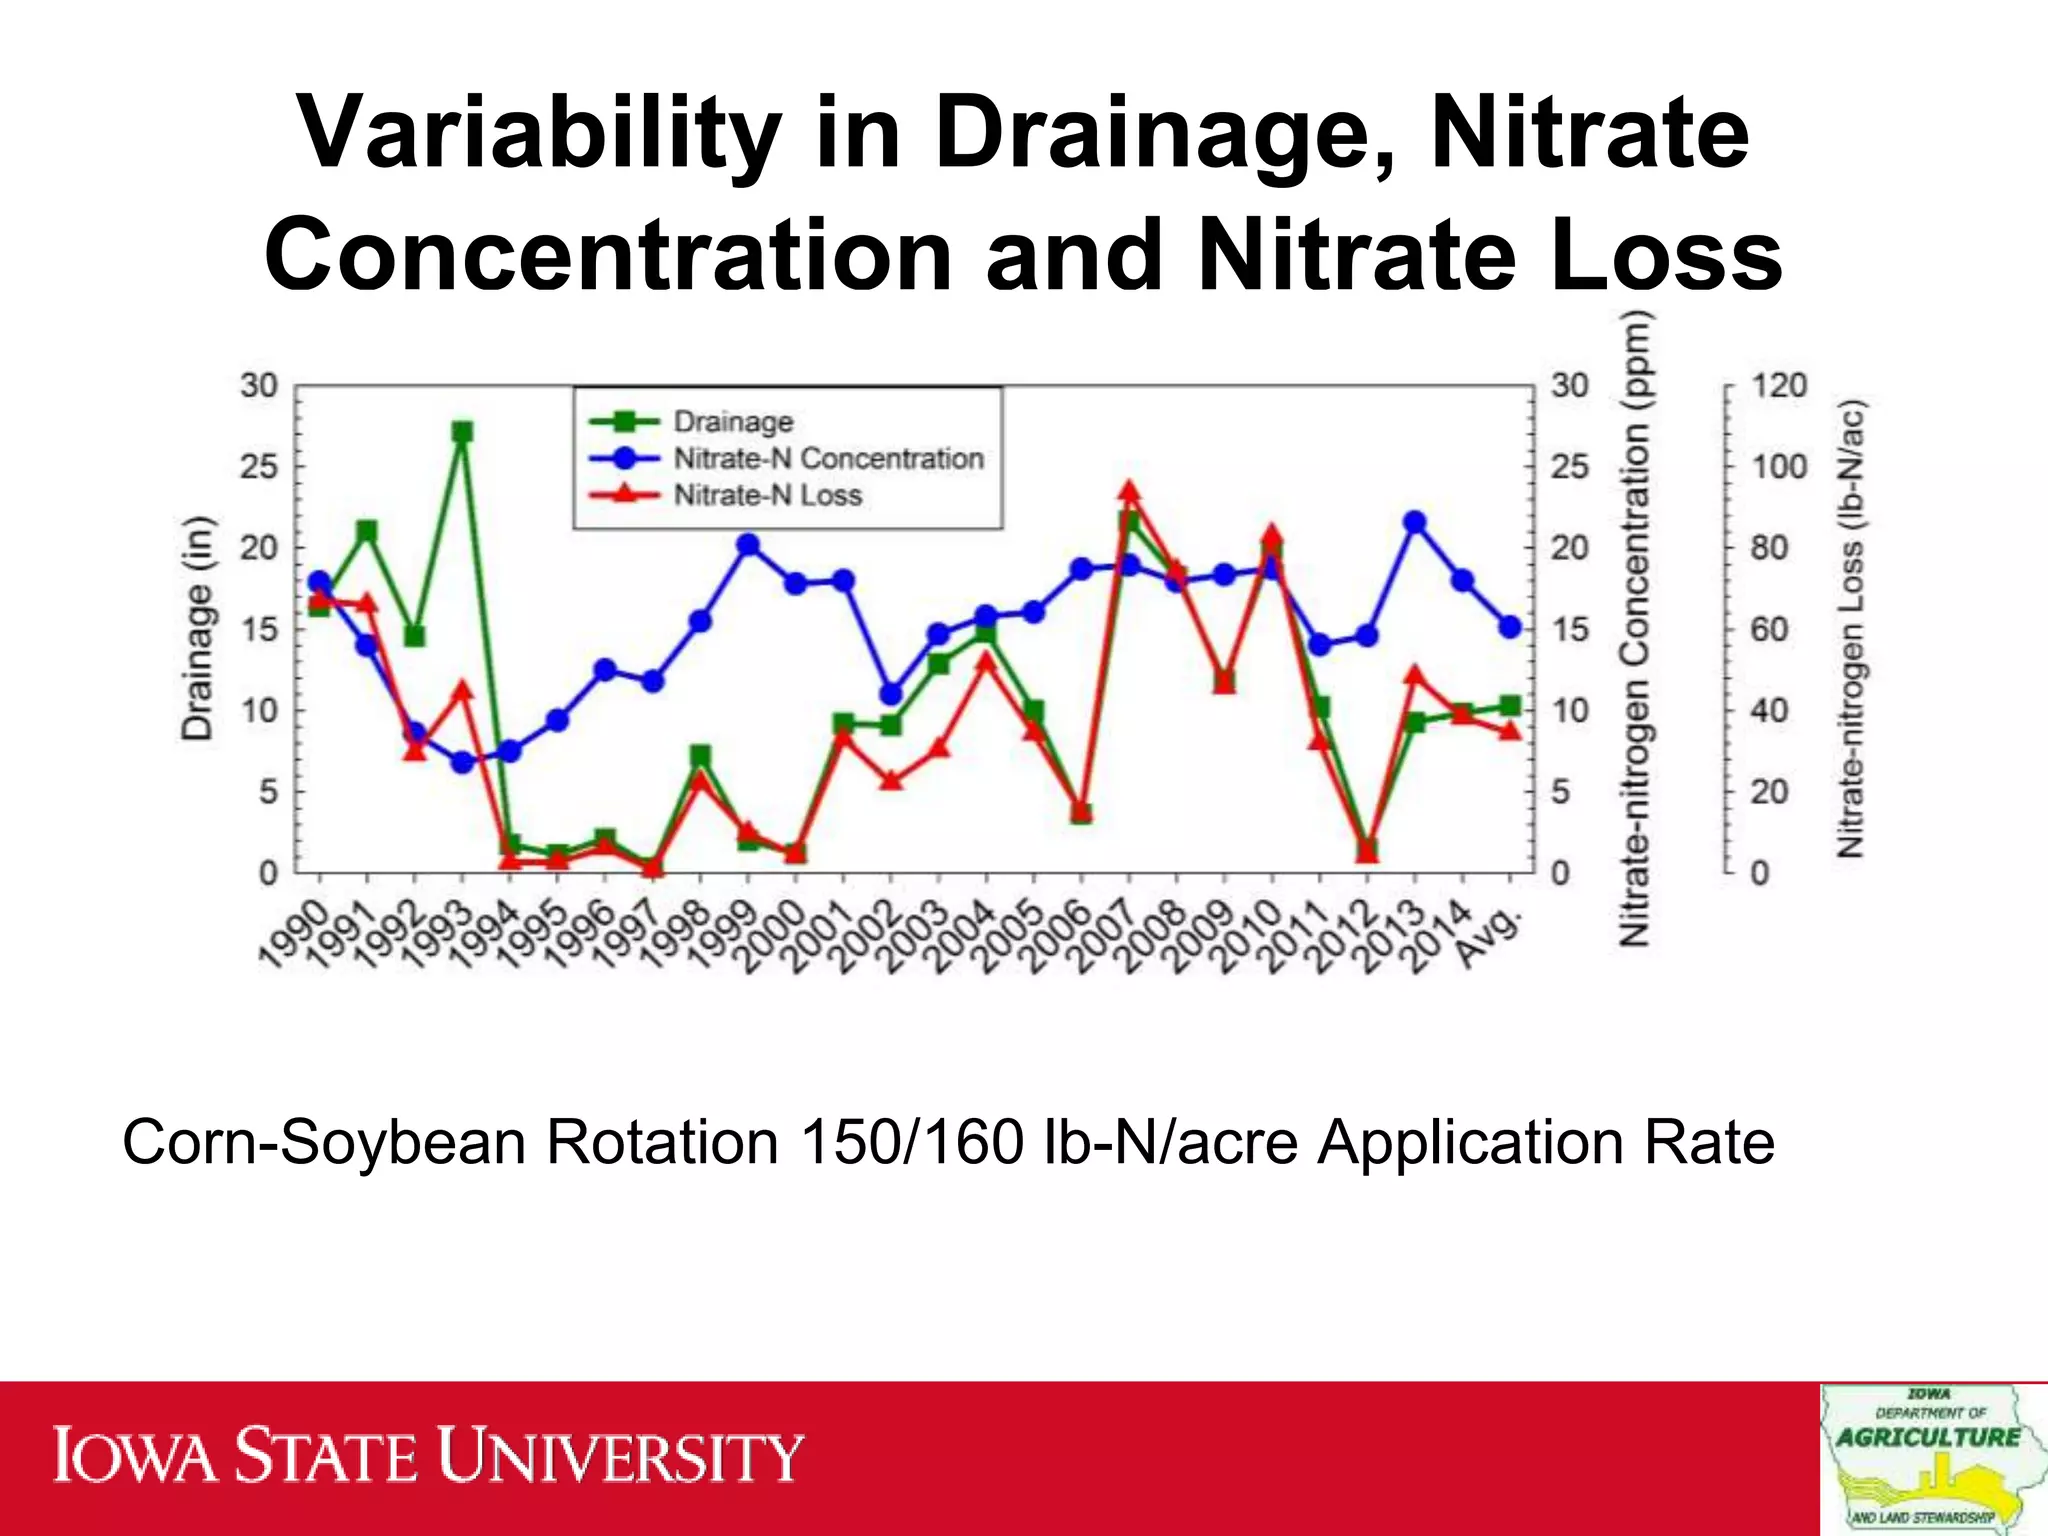

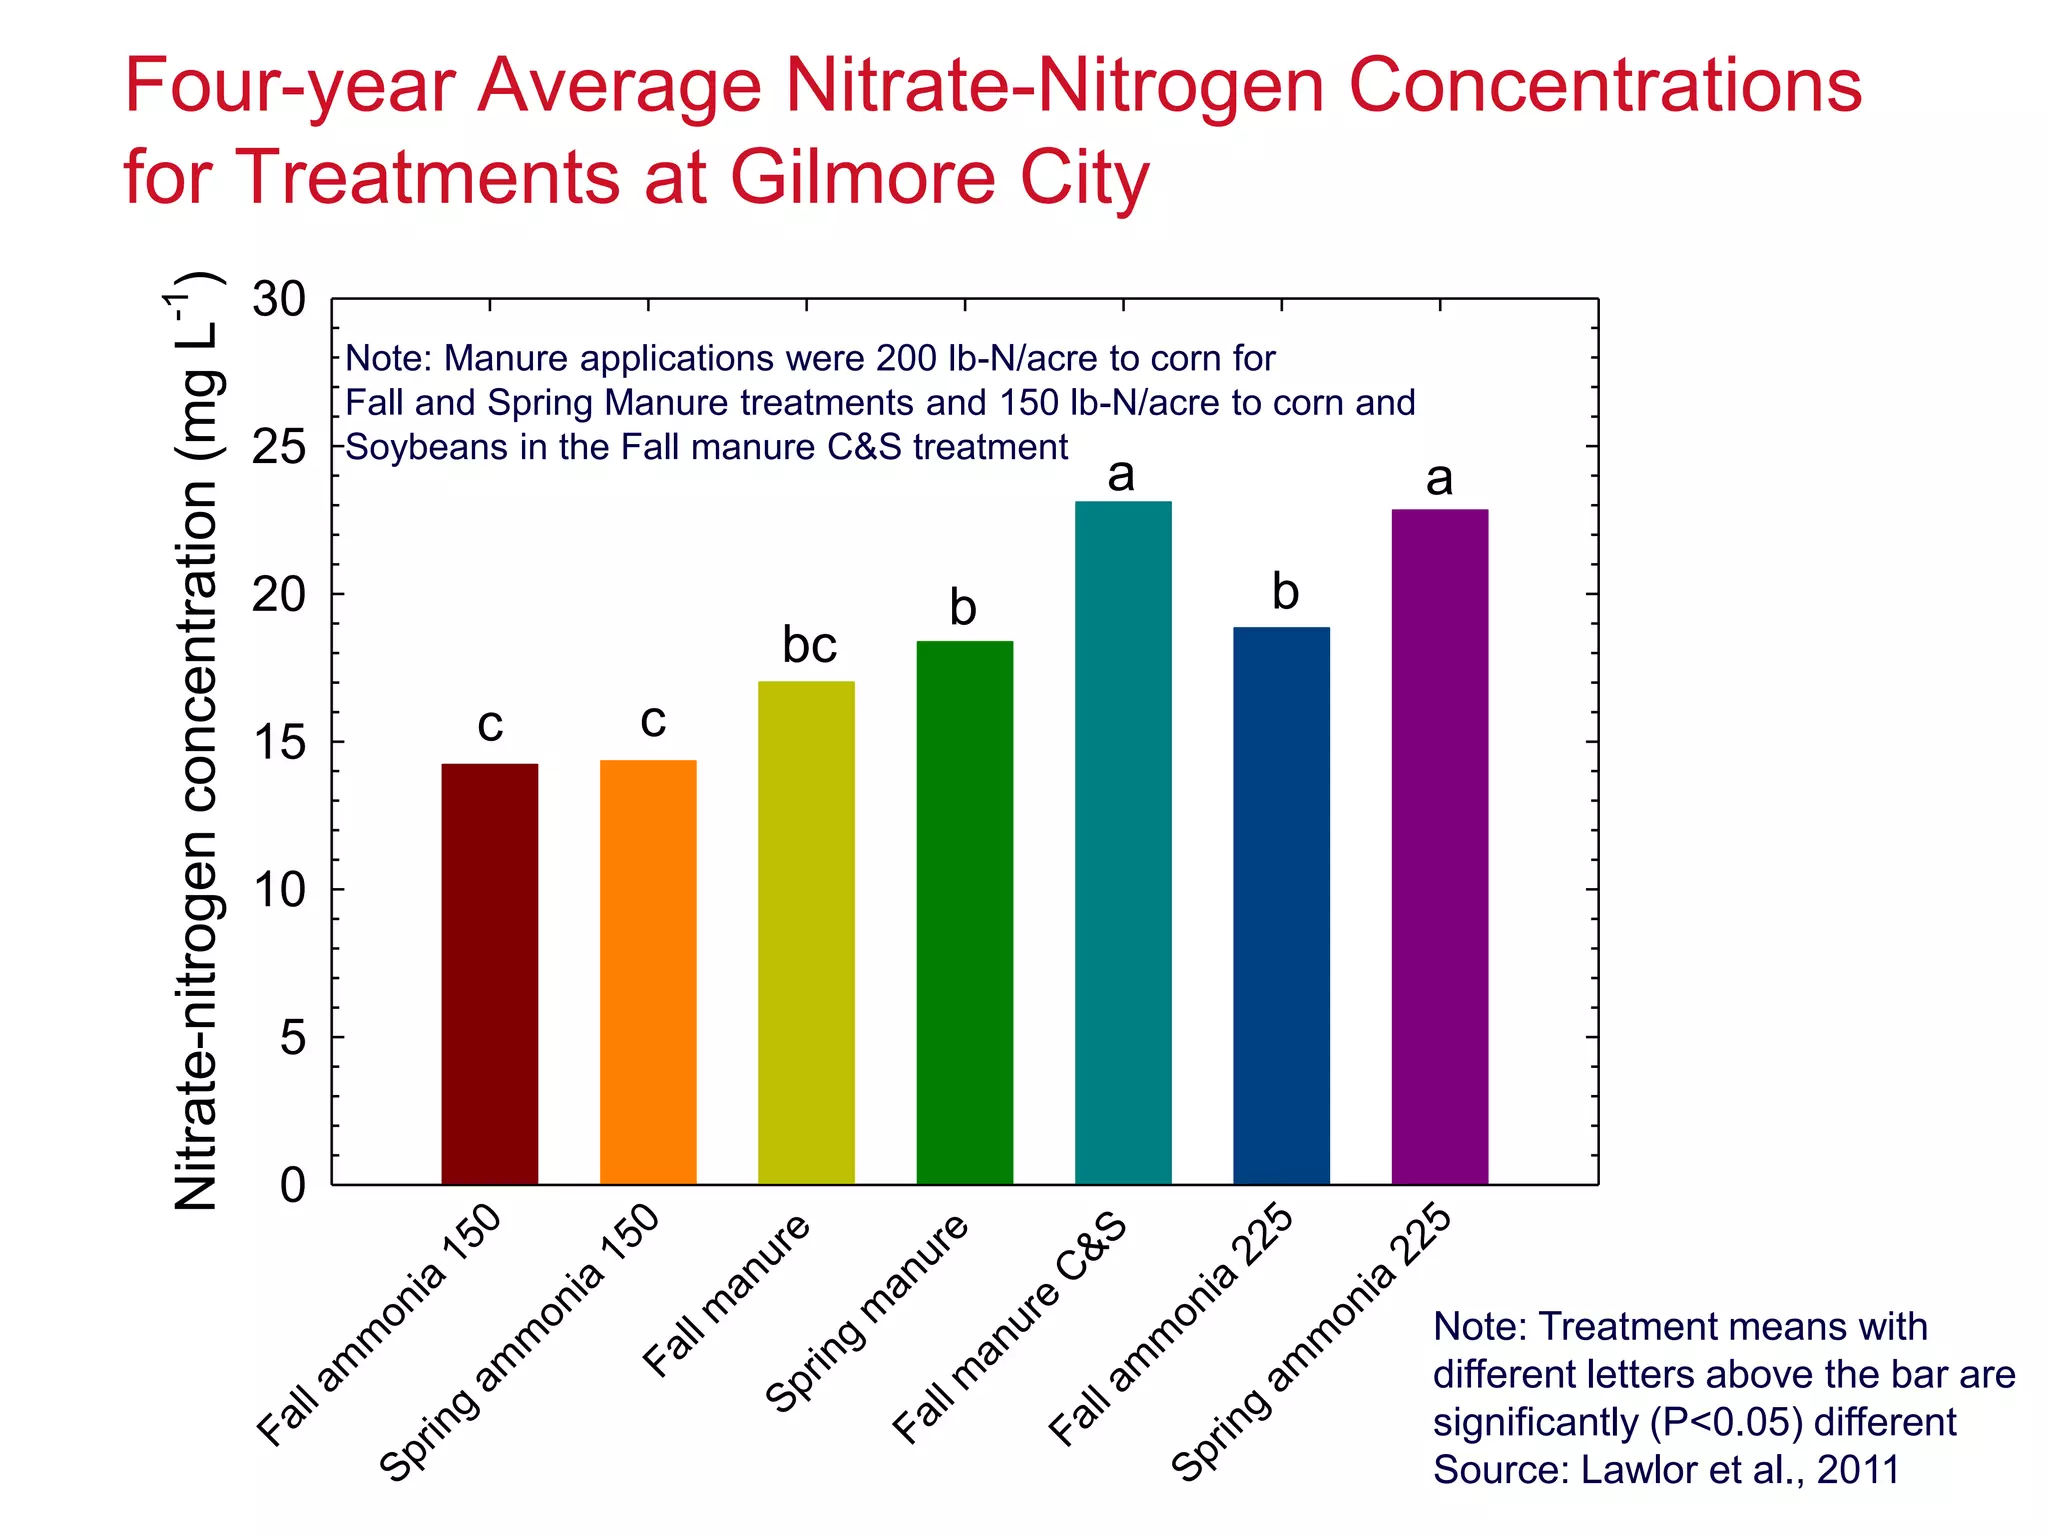


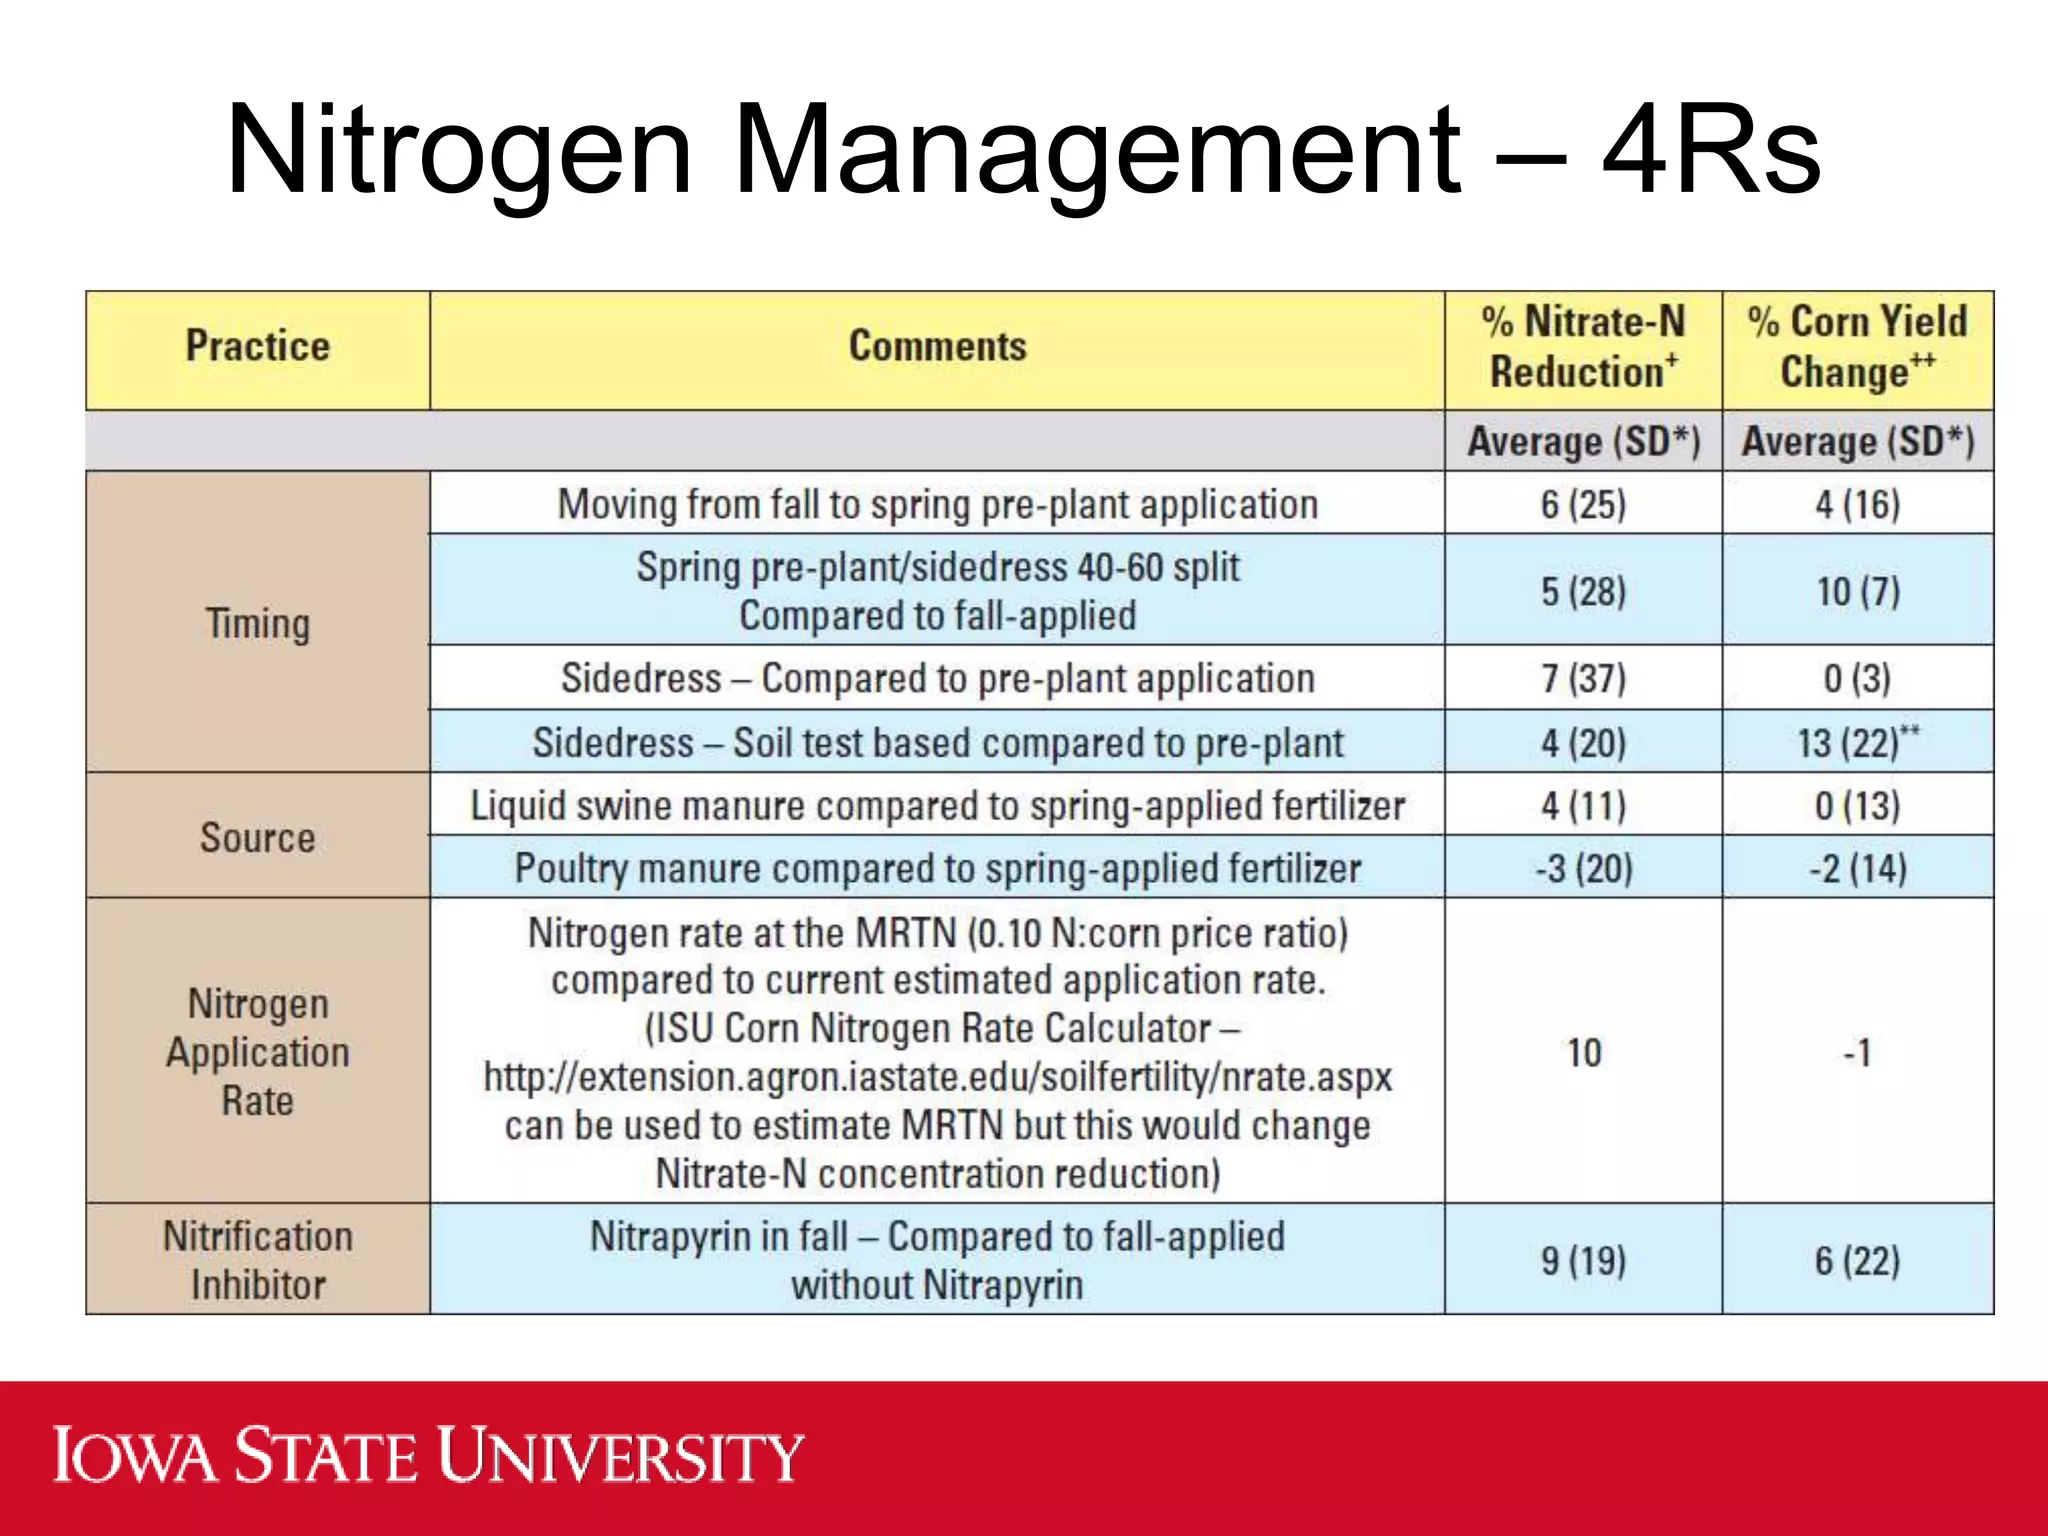


The document discusses the increasing concerns over nitrate-n levels in local waters due to agricultural practices, highlighting the necessity for comprehensive reduction strategies in the Mississippi/Atchafalaya River Basin. It emphasizes the role of cover crops and nitrogen management practices in decreasing nitrate loss and outlines the significant implementation scale required to achieve a 41% reduction in nitrate-n from nonpoint sources as per Iowa's nutrient reduction strategy. The findings underscore the need for both in-field and edge-of-field practices to meet these environmental goals.