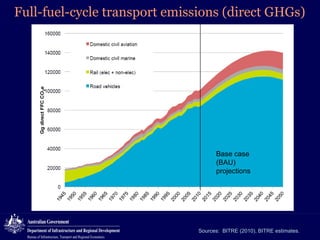
ENDORSING PARTNERS

Estimating the emission
reduction potential of
Australian transport

The following are confirmed contributors to the business and policy dialogue in Sydney:
•

Rick Sawers (National Australia Bank)

•

Nick Greiner (Chairman (Infrastructure NSW)

Monday, 30th September 2013: Business & policy Dialogue
Tuesday 1 October to Thursday,
Dialogue

3rd

October: Academic and Policy

Presented by: Dr David Cosgrove, Bureau of Infrastructure, Transport
and Regional Economics (BITRE)

www.isngi.org

www.isngi.org
Estimating the emission reduction potential of
Australian transport
The Australian Low Carbon Transport Forum
David Cosgrove

ISNGI 2013
University of Wollongong

Session: Transport Networks
2 October 2013
The Australian Low Carbon Transport Forum
(ALCTF)
Estimating emission abatement potential for Australian
transport

What is the maximum feasible emission
reduction across the transport sector?
What are some of the measures, policies and
research directions capable of delivering the
desired future outcomes?
ALCTF - initiated by project secretariat from:

ARRB Group - Caroline Evans
BITRE - David Cosgrove, David Gargett
CSIRO - Paul Graham
ALCTF process:
Series of workshops – elicit expert input
Assessment of possible options for reducing transport
emissions – identify any uncertainties or challenges
Quantification of emission abatement potential – both for
each option individually and as part of an aggregate set
of measures
Project process for ALCTF Workshops
Workshop 1

Workshop 2

Workshop 3
Total Australian Passenger Task Trends
600
Non-motorised
Domestic aviation

500

Domestic marine

Domestic passenger travel
(in terms of passengerkilometres performed) has
grown almost ten-fold over
the last 60 years...

billion pass-km

Rail

400
Other Road
Bus/Coach

300
Car

200

Business-as-usual
(BAU) projections
100

0
1945

1950

1955

1960

1965

1970

1975

1980

1985

1990

1995

2000

2005

2010

2015

2020

2025

2030

Sources: BITRE (2010), Cosgrove (2008), BITRE estimates
Relationship between per capita travel and per capita income levels
16.0
Historical
(total metropolitan
travel, 1945-2010)

14.0

Projected

thousand metropolitan pkm per person

12.0

10.0

8.0

6.0
Urban per capita travel
4.0

Logistic fit

Annual urban pkm per capita (thousands) =
5.46 + 8.19/(1 + (Income/26.71)-5.62)

2.0

0.0
0

10

20

30

40

50

60

70

80

90

100

real Australian GDP (2007 dollars, thousands)

Sources: BITRE (2009, 2010), Cosgrove (2011), BITRE estimates
National per capita tasks relative to economic activity
Per capita transport generation

Per capita task (thousand pkm or tkm per person)

30

25

20

15

10

National passenger task - 1945 to 2011
5

National freight task - 1955 to 2010
0
5.0

15.0

25.0

35.0

45.0

55.0

65.0

Per capita income (GDP/population) - thousand (2008 $A)

Sources: BITRE (2009, 2010), Cosgrove (2008), BITRE estimates
Total BAU Domestic Freight Task Projections
1200

Business-as-usual
(BAU) projections

Air
Sea

1000

Rail
Non-urban road freight

billion tkm

800

Urban road freight

600

400

200

0
1945

1950

1955

1960

1965

1970

1975

1980

1985

1990

1995

2000

2005

2010

2015

2020

2025

2030

Sources: BITRE (2010), BITRE estimates
Modal share of urban transport
90

80

car

per cent of total urban passenger task

heavy rail
70

60

light rail (powered)
walk
motor-bus

50

horse

40

30

20

10

0

Sources: BITRE (2010), Cosgrove (2008, 2011), BITRE estimates.
Energy use by Australian domestic transport

Base case
(BAU)
projections

Sources: fuel sales data, BITRE (2010), BITRE estimates.
Energy use by Australian domestic transport

Base case
(BAU)
projections

Sources: fuel sales data, BITRE (2010), BITRE estimates.
Full-fuel-cycle transport emissions (direct GHGs)

Base case
(BAU)
projections

Sources: BITRE (2010), BITRE estimates.
Package of measures

Largest abatement potentials
Abatement potential – assessment framework
Table: Abatement estimate example, Electric (inc. plug-in hybrid) light vehicles
Category

Option

Net
adoption
fraction

Market
affected

Market
emissions
(2050 Mt
FFC CO2e)

Savings
fraction

2050 Abatement
(Mt FFC CO2e)

72.9

0.8

35.8

0.8

22.8

Estimated ‘Individual’ abatement potential
Vehicle/Fuel
technology

Electric
cars

0.61

Light
vehicles

‘In sequence’ calculated contribution to aggregate abatement
Vehicle/Fuel
technology

Electric
cars

0.39

Light
vehicles

72.9

Sources: Cosgrove et al. (2012), BITRE estimates.
Abatement potential – assessment framework
Table: Abatement estimate example, Biofuels for light vehicles
Category

Option

Net
adoption
fraction

Market
affected

Market
emissions
(2050 Mt
FFC CO2e)

Savings
fraction

2050 Abatement
(Mt FFC CO2e)

72.9

0.65

29.4

0.65

11.8

Estimated ‘Individual’ abatement potential
Vehicle/Fuel
technology

Biofuels

0.62

Light
vehicles

‘In sequence’ calculated contribution to aggregate abatement
Vehicle/Fuel
technology

Biofuels

0.82

Light
vehicles

22.1

Sources: Cosgrove et al. (2012), BITRE estimates.
Abatement potentials (2050) – individual options

Sources: Cosgrove et al. (2012), BITRE estimates.
Abatement potentials – ‘in sequence’ aggregation

Sources: Cosgrove et al. (2012), BITRE estimates.
Cumulative per annum abatement by 2050

Sources: Cosgrove et al. (2012), BITRE estimates.
Estimated maximal
greenhouse gas
reductions -

selected transport abatement
options,
considered in isolation and
as an in sequence contribution to
a transport sector aggregate, by
2050
Maximal potential abatement, 2050
ALCTF Aggregate Scenario compared to BAU projections
160000
Domestic civil Aviation
140000

Domestic civil Marine
Rail (electric + non-electric)
Heavy road vehicles

120000

Light road vehicles
Reference case total

Gg FFC CO2e

100000

80000

60000

40000

20000

0
References (and further reading from BITRE):
 BITRE (2010) Long-term Projections of Australian Transport Emissions: Base Case 2010, Report for the
Department of Climate Change and Energy Efficiency
http://www.climatechange.gov.au/sites/climatechange/files/files/climate-change/bitre-transport-modelling-pdf.pdf
 BITRE (2009) Greenhouse Gas Emissions from Australian Transport: Projections to 2020, Working Paper 73,
Canberra: BITRE
 Cosgrove, D C (2008) Long-term Emission Trends for Australian Transport, Papers of the 31st Australasian
Transport Research Forum, Gold Coast: ATRF
 Cosgrove, D (2011) Long-term patterns of Australian public transport use, Australasian Transport Research
Forum 2011, Adelaide, Australia, University of South Australia
http://www.atrf.info/papers/2011/2011_Cosgrove.pdf
 Cosgrove, D, Gargett, D, Evans, C, Graham, P and Ritzinger, A (2012) Greenhouse gas abatement potential of
the Australian transport sector: Technical Report, CSIRO
 CSIRO (2012) Greenhouse gas abatement potential of the Australian transport sector: Summary Report, CSIRO

http://www.bitre.gov.au/
ATRF 2012
The Australian Low Carbon Transport Forum –
Estimating emission abatement potential for Australian transport
David Cosgrove (BITRE), David Gargett (BITRE),
Caroline Evans (ARRB) and Paul Graham (CSIRO)

Contact:
Dr David Cosgrove
Principal Research Scientist,
Bureau of Infrastructure, Transport and Regional Economics
GPO Box 501, Canberra 2601
email: David.Cosgrove@Infrastructure.gov.au

ALCTF project reports: http://www.csiro.au/ALCTF

SMART International Symposium for Next Generation Infrastructure: Estimating the emission reduction potential of Australian transport

  • 1.
    ENDORSING PARTNERS Estimating theemission reduction potential of Australian transport The following are confirmed contributors to the business and policy dialogue in Sydney: • Rick Sawers (National Australia Bank) • Nick Greiner (Chairman (Infrastructure NSW) Monday, 30th September 2013: Business & policy Dialogue Tuesday 1 October to Thursday, Dialogue 3rd October: Academic and Policy Presented by: Dr David Cosgrove, Bureau of Infrastructure, Transport and Regional Economics (BITRE) www.isngi.org www.isngi.org
  • 2.
    Estimating the emissionreduction potential of Australian transport The Australian Low Carbon Transport Forum David Cosgrove ISNGI 2013 University of Wollongong Session: Transport Networks 2 October 2013
  • 3.
    The Australian LowCarbon Transport Forum (ALCTF) Estimating emission abatement potential for Australian transport What is the maximum feasible emission reduction across the transport sector? What are some of the measures, policies and research directions capable of delivering the desired future outcomes?
  • 4.
    ALCTF - initiatedby project secretariat from: ARRB Group - Caroline Evans BITRE - David Cosgrove, David Gargett CSIRO - Paul Graham
  • 5.
    ALCTF process: Series ofworkshops – elicit expert input Assessment of possible options for reducing transport emissions – identify any uncertainties or challenges Quantification of emission abatement potential – both for each option individually and as part of an aggregate set of measures
  • 6.
    Project process forALCTF Workshops Workshop 1 Workshop 2 Workshop 3
  • 7.
    Total Australian PassengerTask Trends 600 Non-motorised Domestic aviation 500 Domestic marine Domestic passenger travel (in terms of passengerkilometres performed) has grown almost ten-fold over the last 60 years... billion pass-km Rail 400 Other Road Bus/Coach 300 Car 200 Business-as-usual (BAU) projections 100 0 1945 1950 1955 1960 1965 1970 1975 1980 1985 1990 1995 2000 2005 2010 2015 2020 2025 2030 Sources: BITRE (2010), Cosgrove (2008), BITRE estimates
  • 8.
    Relationship between percapita travel and per capita income levels 16.0 Historical (total metropolitan travel, 1945-2010) 14.0 Projected thousand metropolitan pkm per person 12.0 10.0 8.0 6.0 Urban per capita travel 4.0 Logistic fit Annual urban pkm per capita (thousands) = 5.46 + 8.19/(1 + (Income/26.71)-5.62) 2.0 0.0 0 10 20 30 40 50 60 70 80 90 100 real Australian GDP (2007 dollars, thousands) Sources: BITRE (2009, 2010), Cosgrove (2011), BITRE estimates
  • 9.
    National per capitatasks relative to economic activity Per capita transport generation Per capita task (thousand pkm or tkm per person) 30 25 20 15 10 National passenger task - 1945 to 2011 5 National freight task - 1955 to 2010 0 5.0 15.0 25.0 35.0 45.0 55.0 65.0 Per capita income (GDP/population) - thousand (2008 $A) Sources: BITRE (2009, 2010), Cosgrove (2008), BITRE estimates
  • 10.
    Total BAU DomesticFreight Task Projections 1200 Business-as-usual (BAU) projections Air Sea 1000 Rail Non-urban road freight billion tkm 800 Urban road freight 600 400 200 0 1945 1950 1955 1960 1965 1970 1975 1980 1985 1990 1995 2000 2005 2010 2015 2020 2025 2030 Sources: BITRE (2010), BITRE estimates
  • 11.
    Modal share ofurban transport 90 80 car per cent of total urban passenger task heavy rail 70 60 light rail (powered) walk motor-bus 50 horse 40 30 20 10 0 Sources: BITRE (2010), Cosgrove (2008, 2011), BITRE estimates.
  • 12.
    Energy use byAustralian domestic transport Base case (BAU) projections Sources: fuel sales data, BITRE (2010), BITRE estimates.
  • 13.
    Energy use byAustralian domestic transport Base case (BAU) projections Sources: fuel sales data, BITRE (2010), BITRE estimates.
  • 14.
    Full-fuel-cycle transport emissions(direct GHGs) Base case (BAU) projections Sources: BITRE (2010), BITRE estimates.
  • 15.
    Package of measures Largestabatement potentials
  • 16.
    Abatement potential –assessment framework Table: Abatement estimate example, Electric (inc. plug-in hybrid) light vehicles Category Option Net adoption fraction Market affected Market emissions (2050 Mt FFC CO2e) Savings fraction 2050 Abatement (Mt FFC CO2e) 72.9 0.8 35.8 0.8 22.8 Estimated ‘Individual’ abatement potential Vehicle/Fuel technology Electric cars 0.61 Light vehicles ‘In sequence’ calculated contribution to aggregate abatement Vehicle/Fuel technology Electric cars 0.39 Light vehicles 72.9 Sources: Cosgrove et al. (2012), BITRE estimates.
  • 17.
    Abatement potential –assessment framework Table: Abatement estimate example, Biofuels for light vehicles Category Option Net adoption fraction Market affected Market emissions (2050 Mt FFC CO2e) Savings fraction 2050 Abatement (Mt FFC CO2e) 72.9 0.65 29.4 0.65 11.8 Estimated ‘Individual’ abatement potential Vehicle/Fuel technology Biofuels 0.62 Light vehicles ‘In sequence’ calculated contribution to aggregate abatement Vehicle/Fuel technology Biofuels 0.82 Light vehicles 22.1 Sources: Cosgrove et al. (2012), BITRE estimates.
  • 18.
    Abatement potentials (2050)– individual options Sources: Cosgrove et al. (2012), BITRE estimates.
  • 19.
    Abatement potentials –‘in sequence’ aggregation Sources: Cosgrove et al. (2012), BITRE estimates.
  • 20.
    Cumulative per annumabatement by 2050 Sources: Cosgrove et al. (2012), BITRE estimates.
  • 21.
    Estimated maximal greenhouse gas reductions- selected transport abatement options, considered in isolation and as an in sequence contribution to a transport sector aggregate, by 2050
  • 22.
    Maximal potential abatement,2050 ALCTF Aggregate Scenario compared to BAU projections 160000 Domestic civil Aviation 140000 Domestic civil Marine Rail (electric + non-electric) Heavy road vehicles 120000 Light road vehicles Reference case total Gg FFC CO2e 100000 80000 60000 40000 20000 0
  • 23.
    References (and furtherreading from BITRE):  BITRE (2010) Long-term Projections of Australian Transport Emissions: Base Case 2010, Report for the Department of Climate Change and Energy Efficiency http://www.climatechange.gov.au/sites/climatechange/files/files/climate-change/bitre-transport-modelling-pdf.pdf  BITRE (2009) Greenhouse Gas Emissions from Australian Transport: Projections to 2020, Working Paper 73, Canberra: BITRE  Cosgrove, D C (2008) Long-term Emission Trends for Australian Transport, Papers of the 31st Australasian Transport Research Forum, Gold Coast: ATRF  Cosgrove, D (2011) Long-term patterns of Australian public transport use, Australasian Transport Research Forum 2011, Adelaide, Australia, University of South Australia http://www.atrf.info/papers/2011/2011_Cosgrove.pdf  Cosgrove, D, Gargett, D, Evans, C, Graham, P and Ritzinger, A (2012) Greenhouse gas abatement potential of the Australian transport sector: Technical Report, CSIRO  CSIRO (2012) Greenhouse gas abatement potential of the Australian transport sector: Summary Report, CSIRO http://www.bitre.gov.au/
  • 24.
    ATRF 2012 The AustralianLow Carbon Transport Forum – Estimating emission abatement potential for Australian transport David Cosgrove (BITRE), David Gargett (BITRE), Caroline Evans (ARRB) and Paul Graham (CSIRO) Contact: Dr David Cosgrove Principal Research Scientist, Bureau of Infrastructure, Transport and Regional Economics GPO Box 501, Canberra 2601 email: David.Cosgrove@Infrastructure.gov.au ALCTF project reports: http://www.csiro.au/ALCTF