Downloaded 188 times

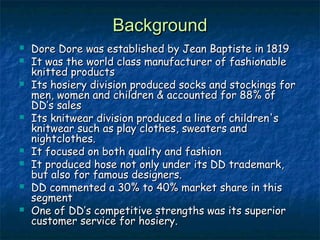
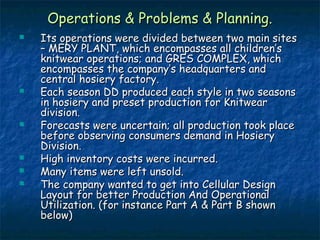
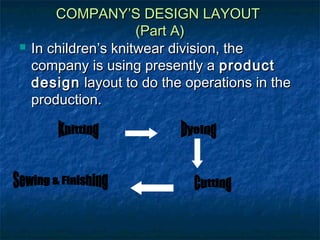
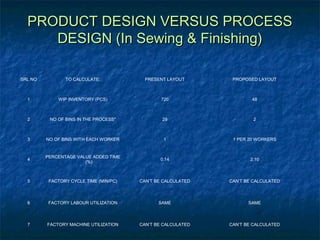
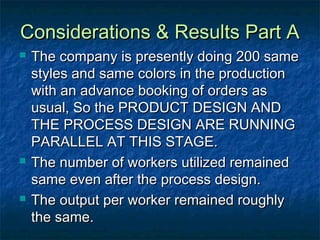
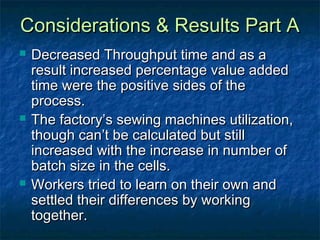
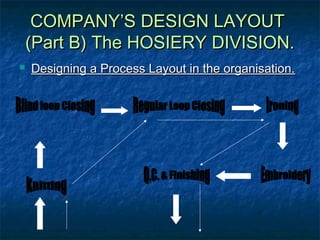
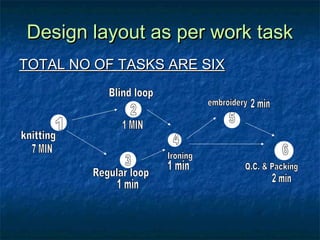
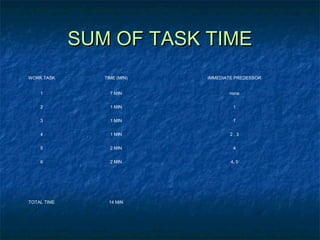
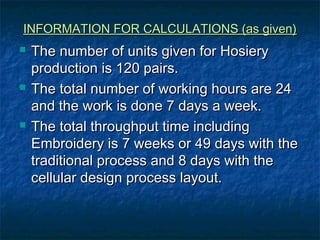
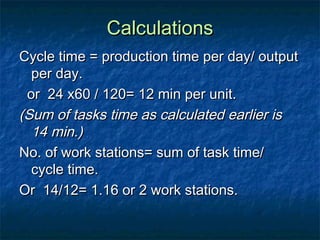
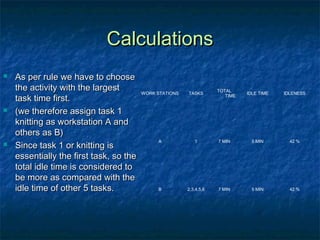

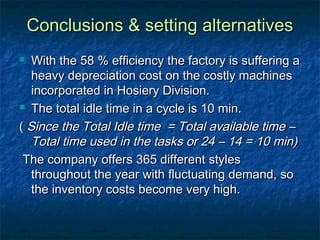
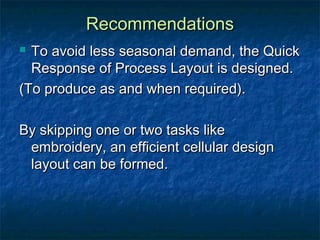
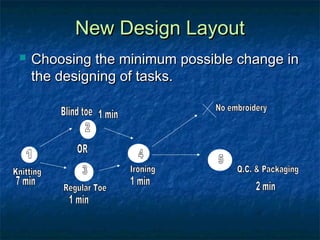

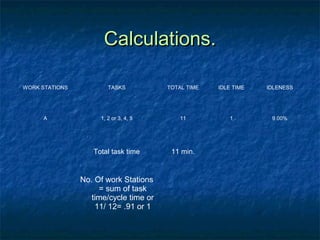

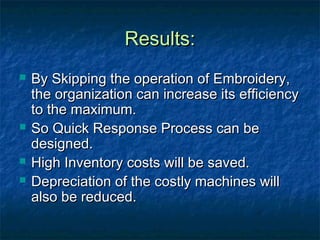

The document discusses Dore Dore, a manufacturer of knitted products. It had two divisions: hosiery and knitwear. The hosiery division faced problems with uncertain forecasts leading to high inventory costs and unsold items. It wanted to implement a cellular design process to improve production. Testing this in the knitwear division showed lower WIP inventory and fewer bins per worker. In the hosiery division, designing the process layout as per work tasks identified two work stations needed. However, the factory machine utilization was only 58%, indicating heavy depreciation costs due to idle machines. Alternatives were needed to improve efficiency.


![Dore%2520dore%5 B1%5 D[1]](https://cdn.slidesharecdn.com/ss_thumbnails/dore2520dore5b15d1-1233114100768199-3-thumbnail.jpg?width=640&height=640&fit=bounds)


