Downloaded 1,430 times
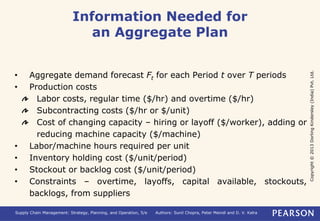
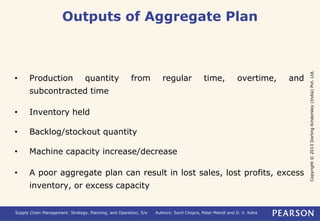
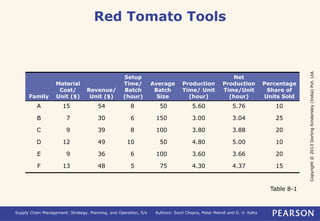
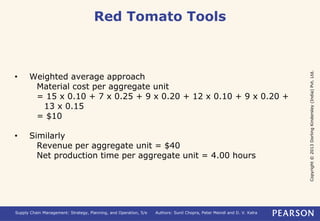
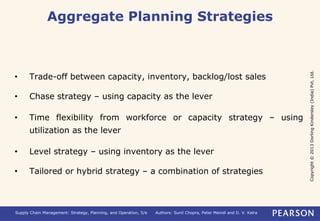
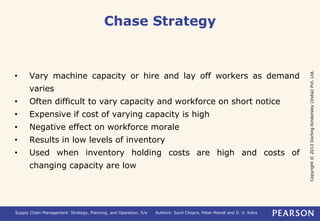
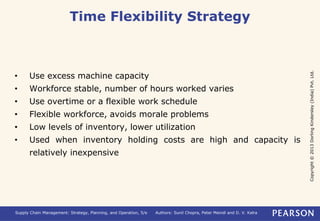
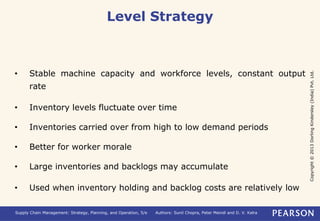
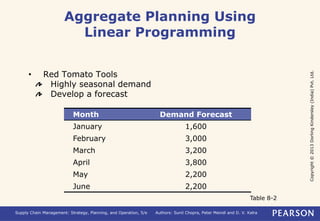
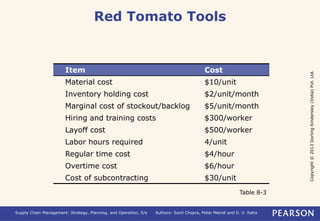
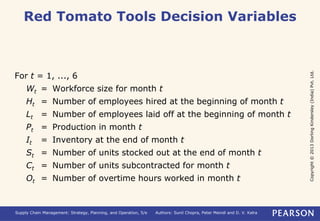
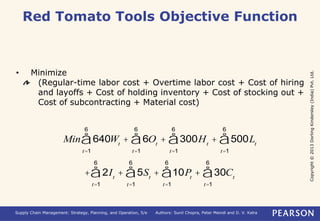
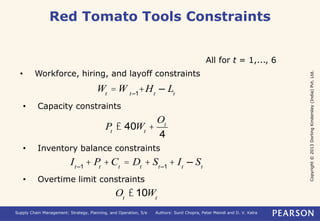
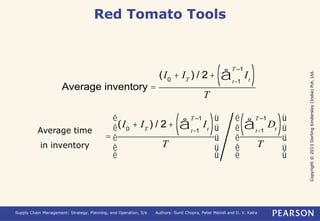
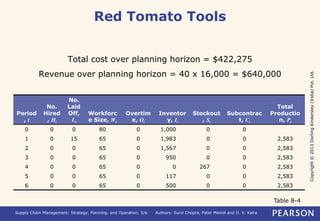
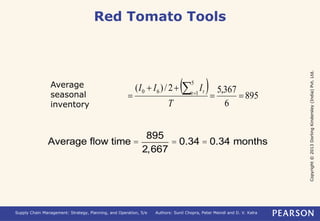

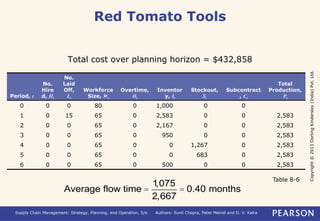
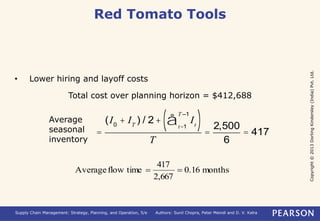
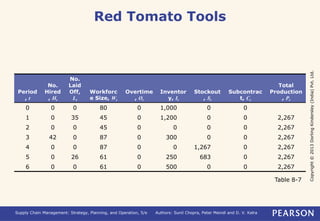
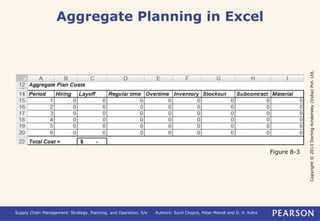
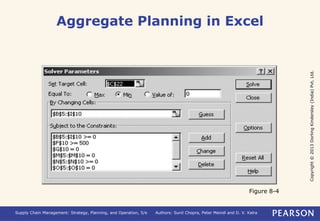
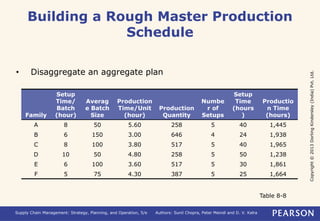

This document discusses aggregate planning in supply chain management. It provides an overview of aggregate planning, including that it determines optimal levels of production, inventory, capacity, and other factors over time horizons of 3-18 months. The document also gives examples of aggregate planning problems and strategies, including using linear programming to minimize costs subject to capacity, inventory, and other constraints. It provides details on applying these concepts to a case study company called Red Tomato Tools.