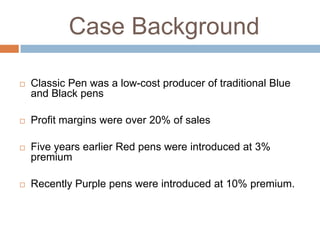
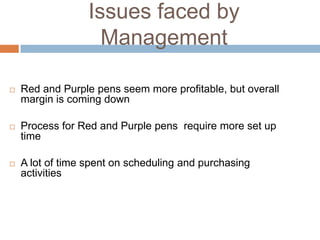
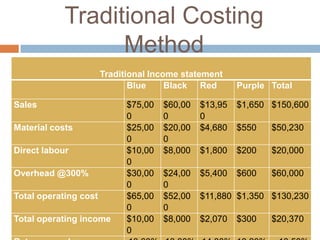
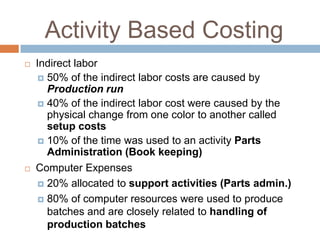
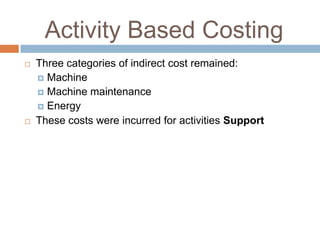
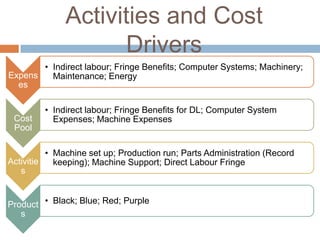
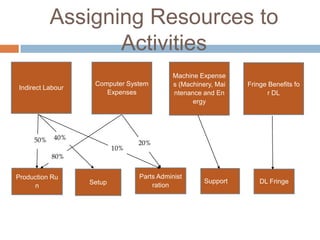
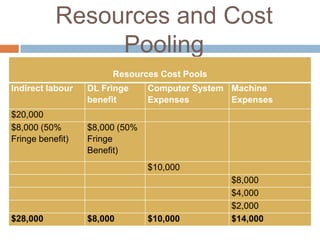
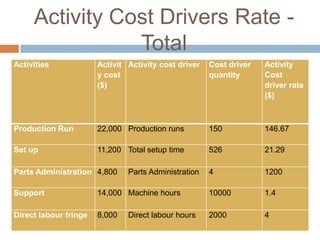
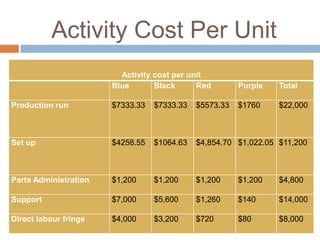
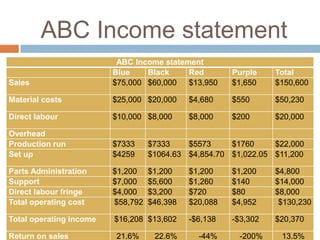
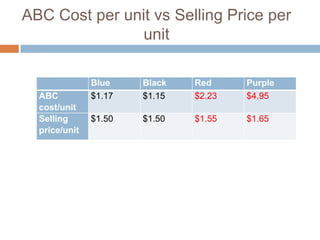
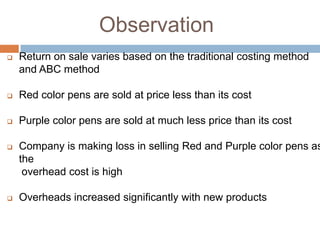
CLASSIC PEN COMPANY
DEVELOPING AN ABC MODEL
GROUP V1 (SECTION 4)
HARISH B

13419

ANINDYA GANGULY

13406

ANURAG BOTHRA

13411

PRAGATI CHAUHAN

13435

RENJIT THOMAS

13440

Cost Accounting Case analysis
Case Background


Classic Pen was a low-cost producer of traditional Blue
and Black pens



Profit margins were over 20% of sales



Five years earlier Red pens were introduced at 3%
premium



Recently Purple pens were introduced at 10% premium.
Issues faced by
Management


Red and Purple pens seem more profitable, but overall
margin is coming down



Process for Red and Purple pens require more set up
time



A lot of time spent on scheduling and purchasing
activities
Costing system of Classic
Pen


All indirect costs were aggregated at plant level and
allocated to products based upon the direct labor cost



The overhead rate is 300% of direct labor cost



Before Red and Purple pens were introduced, the
overhead rate was only 200% of direct labor cost
Traditional Costing
Method
Traditional Income statement
Blue
Black Red

Sales
Material costs
Direct labour
Overhead @300%
Total operating cost

Total operating income

$75,00
0
$25,00
0
$10,00
0
$30,00
0
$65,00
0
$10,00
0

Purple Total

$60,00
0
$20,00
0
$8,000

$13,95
0
$4,680

$1,650 $150,600
$550

$50,230

$1,800

$200

$20,000

$24,00
0
$52,00
0
$8,000

$5,400

$600

$60,000

$11,880 $1,350 $130,230

$2,070

$300

$20,370
Activity Based Costing




Indirect labor
 50% of the indirect labor costs are caused by
Production run
 40% of the indirect labor cost were caused by the
physical change from one color to another called
setup costs
 10% of the time was used to an activity Parts
Administration (Book keeping)
Computer Expenses
 20% allocated to support activities (Parts admin.)
 80% of computer resources were used to produce
batches and are closely related to handling of
production batches
Activity Based Costing




Three categories of indirect cost remained:
 Machine
 Machine maintenance
 Energy
These costs were incurred for activities Support
Activities and Cost
Drivers
• Indirect labour; Fringe Benefits; Computer Systems; Machinery;
Expens
Maintenance; Energy
es

Cost
Pool

• Indirect labour; Fringe Benefits for DL; Computer System
Expenses; Machine Expenses

• Machine set up; Production run; Parts Administration (Record
Activitie
keeping); Machine Support; Direct Labour Fringe
s
Product • Black; Blue; Red; Purple
s
Assigning Resources to
Activities
Indirect Labour

50%

Computer System
Expenses

40%
10%

Machine Expense
s (Machinery, Mai
ntenance and En
ergy

Fringe Benefits fo
r DL

20%

80%
Production Ru
n

Setup

Parts Administ
ration

Support

DL Fringe
Resources and Cost
Pooling
Resources Cost Pools

Indirect labour
$20,000
$8,000 (50%
Fringe benefit)

DL Fringe
benefit

Computer System Machine
Expenses
Expenses

$8,000 (50%
Fringe
Benefit)
$10,000

$28,000

$8,000

$10,000

$8,000
$4,000
$2,000
$14,000
Activity Cost Drivers Rate Total
Activities

Activit Activity cost driver
y cost
($)

Cost driver
quantity

Activity
Cost
driver rate
($)

Production Run

22,000 Production runs

150

146.67

Set up

11,200 Total setup time

526

21.29

4

1200

Parts Administration 4,800

Parts Administration

Support

14,000 Machine hours

10000

1.4

Direct labour fringe

8,000

2000

4

Direct labour hours
Activity Cost Per Unit
Activity cost per unit
Blue
Black
Red

Purple

Total

Production run

$7333.33

$7333.33

$5573.33

$1760

$22,000

Set up

$4258.55

$1064.63

$4,854.70 $1,022.05 $11,200

Parts Administration

$1,200

$1,200

$1,200

$1,200

$4,800

Support

$7,000

$5,600

$1,260

$140

$14,000

Direct labour fringe

$4,000

$3,200

$720

$80

$8,000
ABC Income statement
Sales

ABC Income statement
Blue
Black
Red
$75,000 $60,000
$13,950

Purple
$1,650

Total
$150,600

Material costs

$25,000 $20,000

$4,680

$550

$50,230

Direct labour

$10,000 $8,000

$8,000

$200

$20,000

Overhead
Production run
Set up

$7333
$4259

$7333
$5573
$1760
$22,000
$1064.63 $4,854.70 $1,022.05 $11,200

Parts Administration
Support
Direct labour fringe
Total operating cost

$1,200
$7,000
$4,000
$58,792

$1,200
$5,600
$3,200
$46,398

$1,200
$1,260
$720
$20,088

$1,200
$140
$80
$4,952

$4,800
$14,000
$8,000
$130,230

Total operating income

$16,208 $13,602

-$6,138

-$3,302

$20,370

Return on sales

21.6%

22.6%

-44%

-200%

13.5%
ABC Cost per unit vs Selling Price per
unit

ABC
cost/unit
Selling
price/unit

Blue
$1.17

Black
$1.15

Red
$2.23

Purple
$4.95

$1.50

$1.50

$1.55

$1.65
Observation


Return on sale varies based on the traditional costing method
and ABC method



Red color pens are sold at price less than its cost



Purple color pens are sold at much less price than its cost



Company is making loss in selling Red and Purple color pens as
the
overhead cost is high



Overheads increased significantly with new products
Recommendation based on ABC
analysis


Increase the sales price of red and purple pens.



Minimize overhead cost

Classic pen company activity based costing

  • 1.
    CLASSIC PEN COMPANY DEVELOPINGAN ABC MODEL GROUP V1 (SECTION 4) HARISH B 13419 ANINDYA GANGULY 13406 ANURAG BOTHRA 13411 PRAGATI CHAUHAN 13435 RENJIT THOMAS 13440 Cost Accounting Case analysis
  • 2.
    Case Background  Classic Penwas a low-cost producer of traditional Blue and Black pens  Profit margins were over 20% of sales  Five years earlier Red pens were introduced at 3% premium  Recently Purple pens were introduced at 10% premium.
  • 3.
    Issues faced by Management  Redand Purple pens seem more profitable, but overall margin is coming down  Process for Red and Purple pens require more set up time  A lot of time spent on scheduling and purchasing activities
  • 4.
    Costing system ofClassic Pen  All indirect costs were aggregated at plant level and allocated to products based upon the direct labor cost  The overhead rate is 300% of direct labor cost  Before Red and Purple pens were introduced, the overhead rate was only 200% of direct labor cost
  • 5.
    Traditional Costing Method Traditional Incomestatement Blue Black Red Sales Material costs Direct labour Overhead @300% Total operating cost Total operating income $75,00 0 $25,00 0 $10,00 0 $30,00 0 $65,00 0 $10,00 0 Purple Total $60,00 0 $20,00 0 $8,000 $13,95 0 $4,680 $1,650 $150,600 $550 $50,230 $1,800 $200 $20,000 $24,00 0 $52,00 0 $8,000 $5,400 $600 $60,000 $11,880 $1,350 $130,230 $2,070 $300 $20,370
  • 6.
    Activity Based Costing   Indirectlabor  50% of the indirect labor costs are caused by Production run  40% of the indirect labor cost were caused by the physical change from one color to another called setup costs  10% of the time was used to an activity Parts Administration (Book keeping) Computer Expenses  20% allocated to support activities (Parts admin.)  80% of computer resources were used to produce batches and are closely related to handling of production batches
  • 7.
    Activity Based Costing   Threecategories of indirect cost remained:  Machine  Machine maintenance  Energy These costs were incurred for activities Support
  • 8.
    Activities and Cost Drivers •Indirect labour; Fringe Benefits; Computer Systems; Machinery; Expens Maintenance; Energy es Cost Pool • Indirect labour; Fringe Benefits for DL; Computer System Expenses; Machine Expenses • Machine set up; Production run; Parts Administration (Record Activitie keeping); Machine Support; Direct Labour Fringe s Product • Black; Blue; Red; Purple s
  • 9.
    Assigning Resources to Activities IndirectLabour 50% Computer System Expenses 40% 10% Machine Expense s (Machinery, Mai ntenance and En ergy Fringe Benefits fo r DL 20% 80% Production Ru n Setup Parts Administ ration Support DL Fringe
  • 10.
    Resources and Cost Pooling ResourcesCost Pools Indirect labour $20,000 $8,000 (50% Fringe benefit) DL Fringe benefit Computer System Machine Expenses Expenses $8,000 (50% Fringe Benefit) $10,000 $28,000 $8,000 $10,000 $8,000 $4,000 $2,000 $14,000
  • 11.
    Activity Cost DriversRate Total Activities Activit Activity cost driver y cost ($) Cost driver quantity Activity Cost driver rate ($) Production Run 22,000 Production runs 150 146.67 Set up 11,200 Total setup time 526 21.29 4 1200 Parts Administration 4,800 Parts Administration Support 14,000 Machine hours 10000 1.4 Direct labour fringe 8,000 2000 4 Direct labour hours
  • 12.
    Activity Cost PerUnit Activity cost per unit Blue Black Red Purple Total Production run $7333.33 $7333.33 $5573.33 $1760 $22,000 Set up $4258.55 $1064.63 $4,854.70 $1,022.05 $11,200 Parts Administration $1,200 $1,200 $1,200 $1,200 $4,800 Support $7,000 $5,600 $1,260 $140 $14,000 Direct labour fringe $4,000 $3,200 $720 $80 $8,000
  • 13.
    ABC Income statement Sales ABCIncome statement Blue Black Red $75,000 $60,000 $13,950 Purple $1,650 Total $150,600 Material costs $25,000 $20,000 $4,680 $550 $50,230 Direct labour $10,000 $8,000 $8,000 $200 $20,000 Overhead Production run Set up $7333 $4259 $7333 $5573 $1760 $22,000 $1064.63 $4,854.70 $1,022.05 $11,200 Parts Administration Support Direct labour fringe Total operating cost $1,200 $7,000 $4,000 $58,792 $1,200 $5,600 $3,200 $46,398 $1,200 $1,260 $720 $20,088 $1,200 $140 $80 $4,952 $4,800 $14,000 $8,000 $130,230 Total operating income $16,208 $13,602 -$6,138 -$3,302 $20,370 Return on sales 21.6% 22.6% -44% -200% 13.5%
  • 14.
    ABC Cost perunit vs Selling Price per unit ABC cost/unit Selling price/unit Blue $1.17 Black $1.15 Red $2.23 Purple $4.95 $1.50 $1.50 $1.55 $1.65
  • 15.
    Observation  Return on salevaries based on the traditional costing method and ABC method  Red color pens are sold at price less than its cost  Purple color pens are sold at much less price than its cost  Company is making loss in selling Red and Purple color pens as the overhead cost is high  Overheads increased significantly with new products
  • 16.
    Recommendation based onABC analysis  Increase the sales price of red and purple pens.  Minimize overhead cost