Download as PDF, PPTX
![The problem
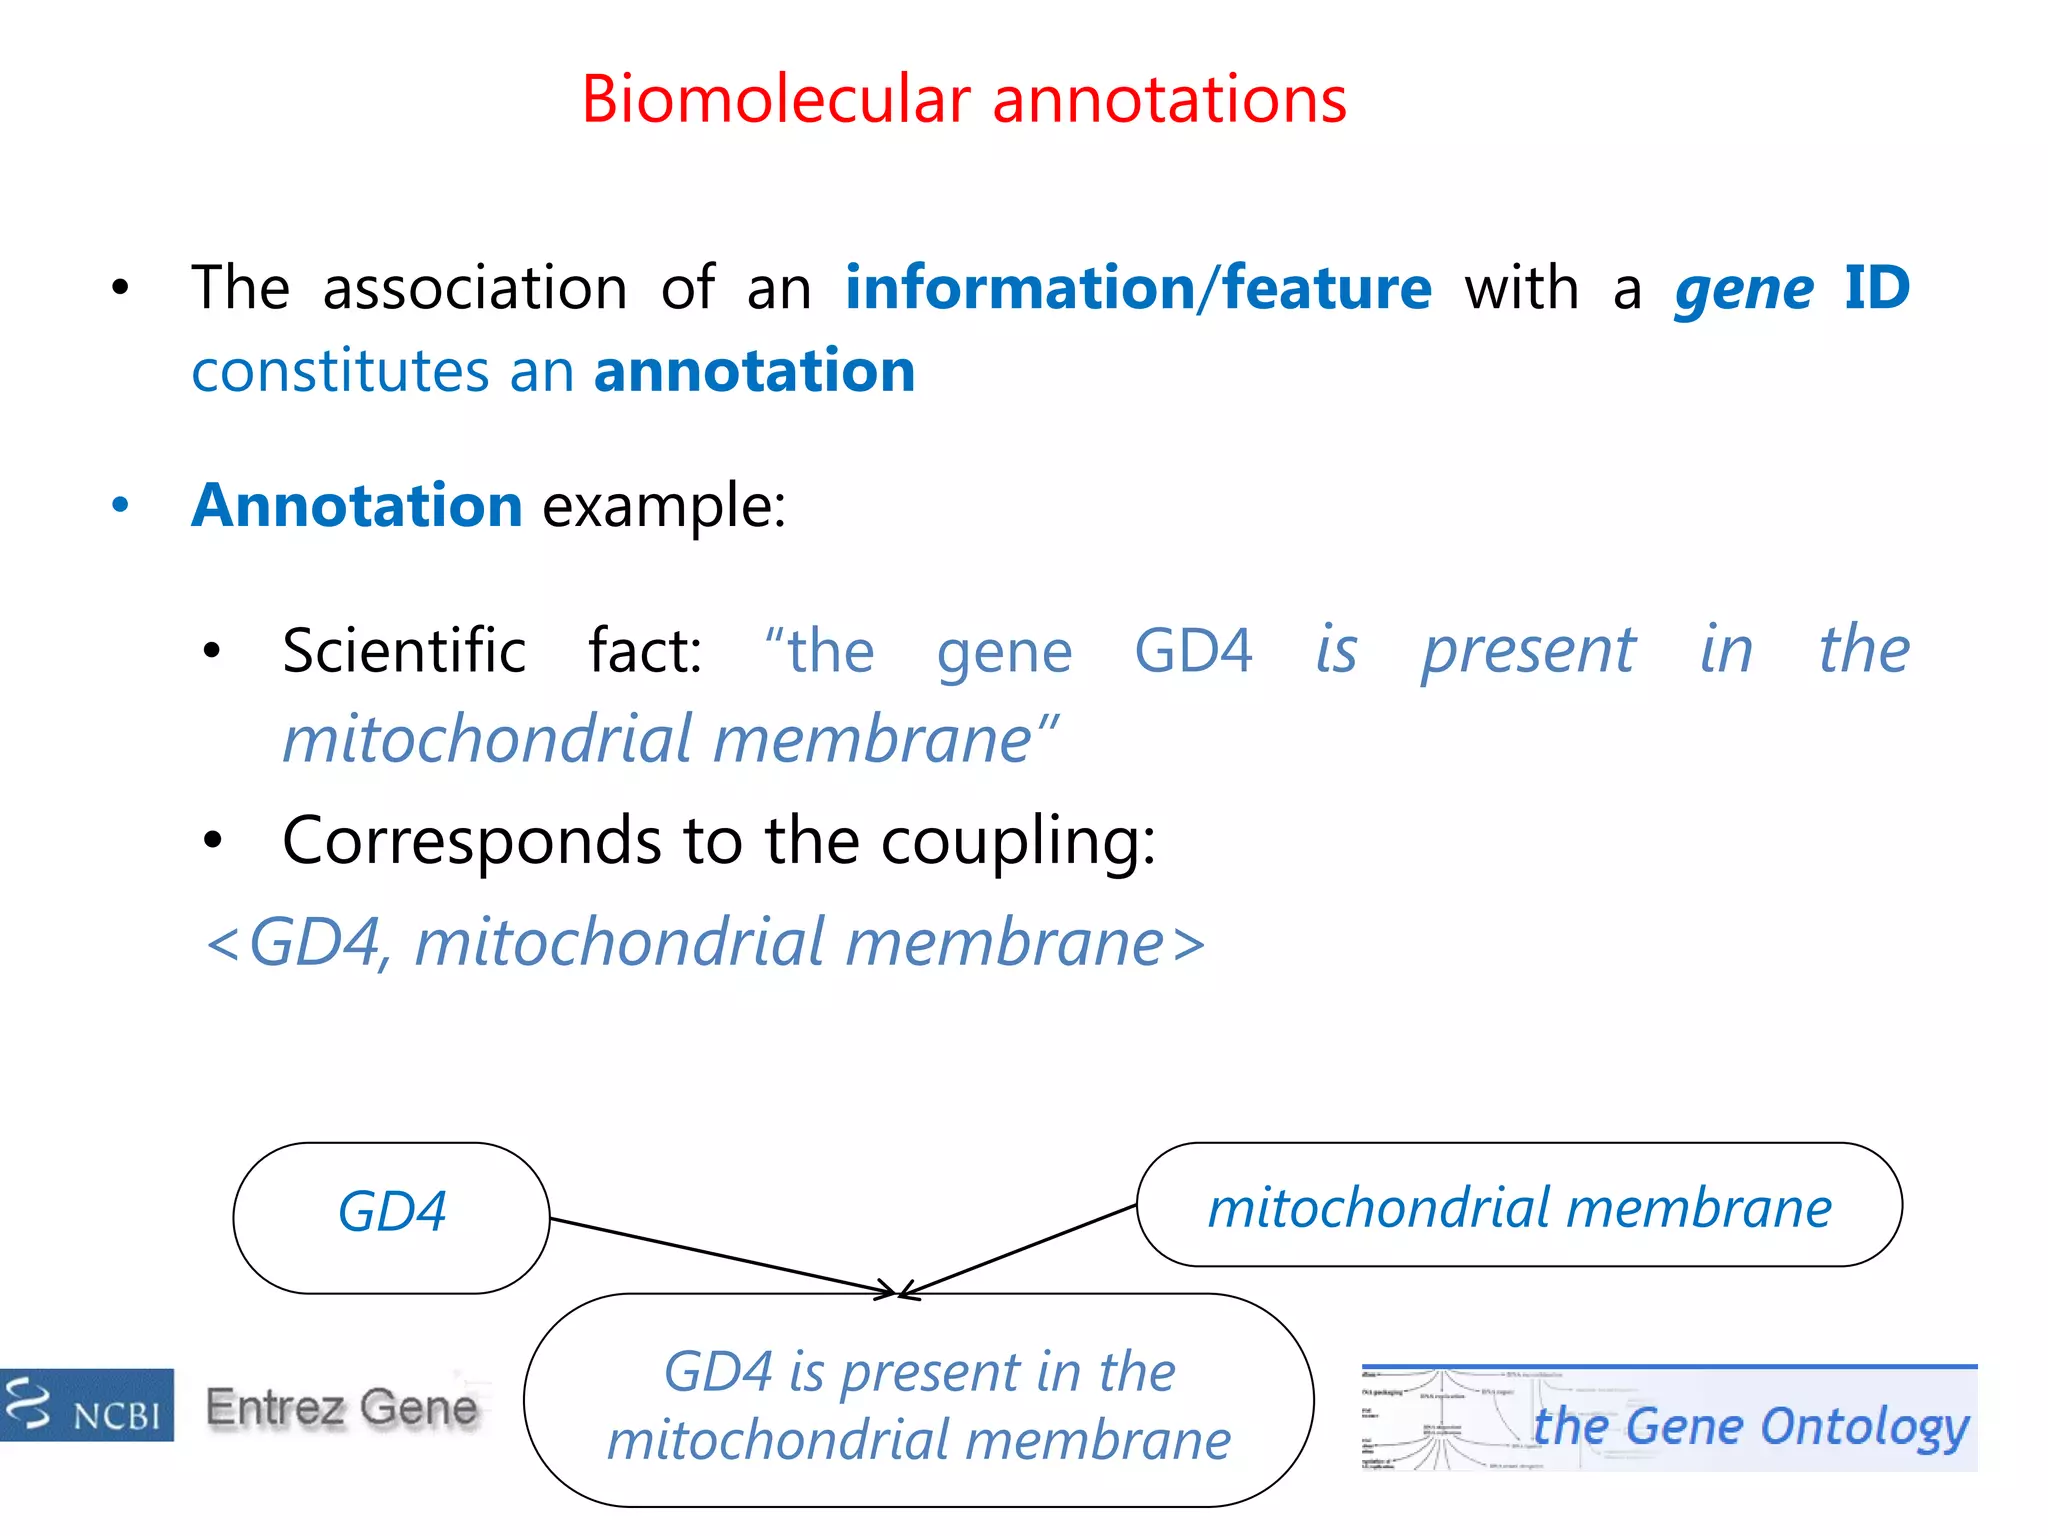
• Other scientists and researchers dealt with the problem in the
past by using:
• Support Vector Machines (SVM) [Barutcuoglu et al., 2006]
• k-nearest neighbor algorithm (kNN) [Tao et al., 2007]
• Decision trees [King et al., 2003]
• Hidden Markov models (HMM) [Mi et al. 2013]
• …
• These methods were all good in stating if a predicted
annotation was correct or not, but were not able to make
extrapolations, that is to suggest new annotations absent
from the input dataset](https://image.slidesharecdn.com/davidechiccobozza2014-03-20h0839-140320073943-phpapp02/75/Doctoral-Thesis-Dissertation-2014-03-20-PoliMi-6-2048.jpg)

![input
matrix
output
Data
reading
Statisical
method
Predicted
annotation
lists
A input
matrix
A~ output
matrix
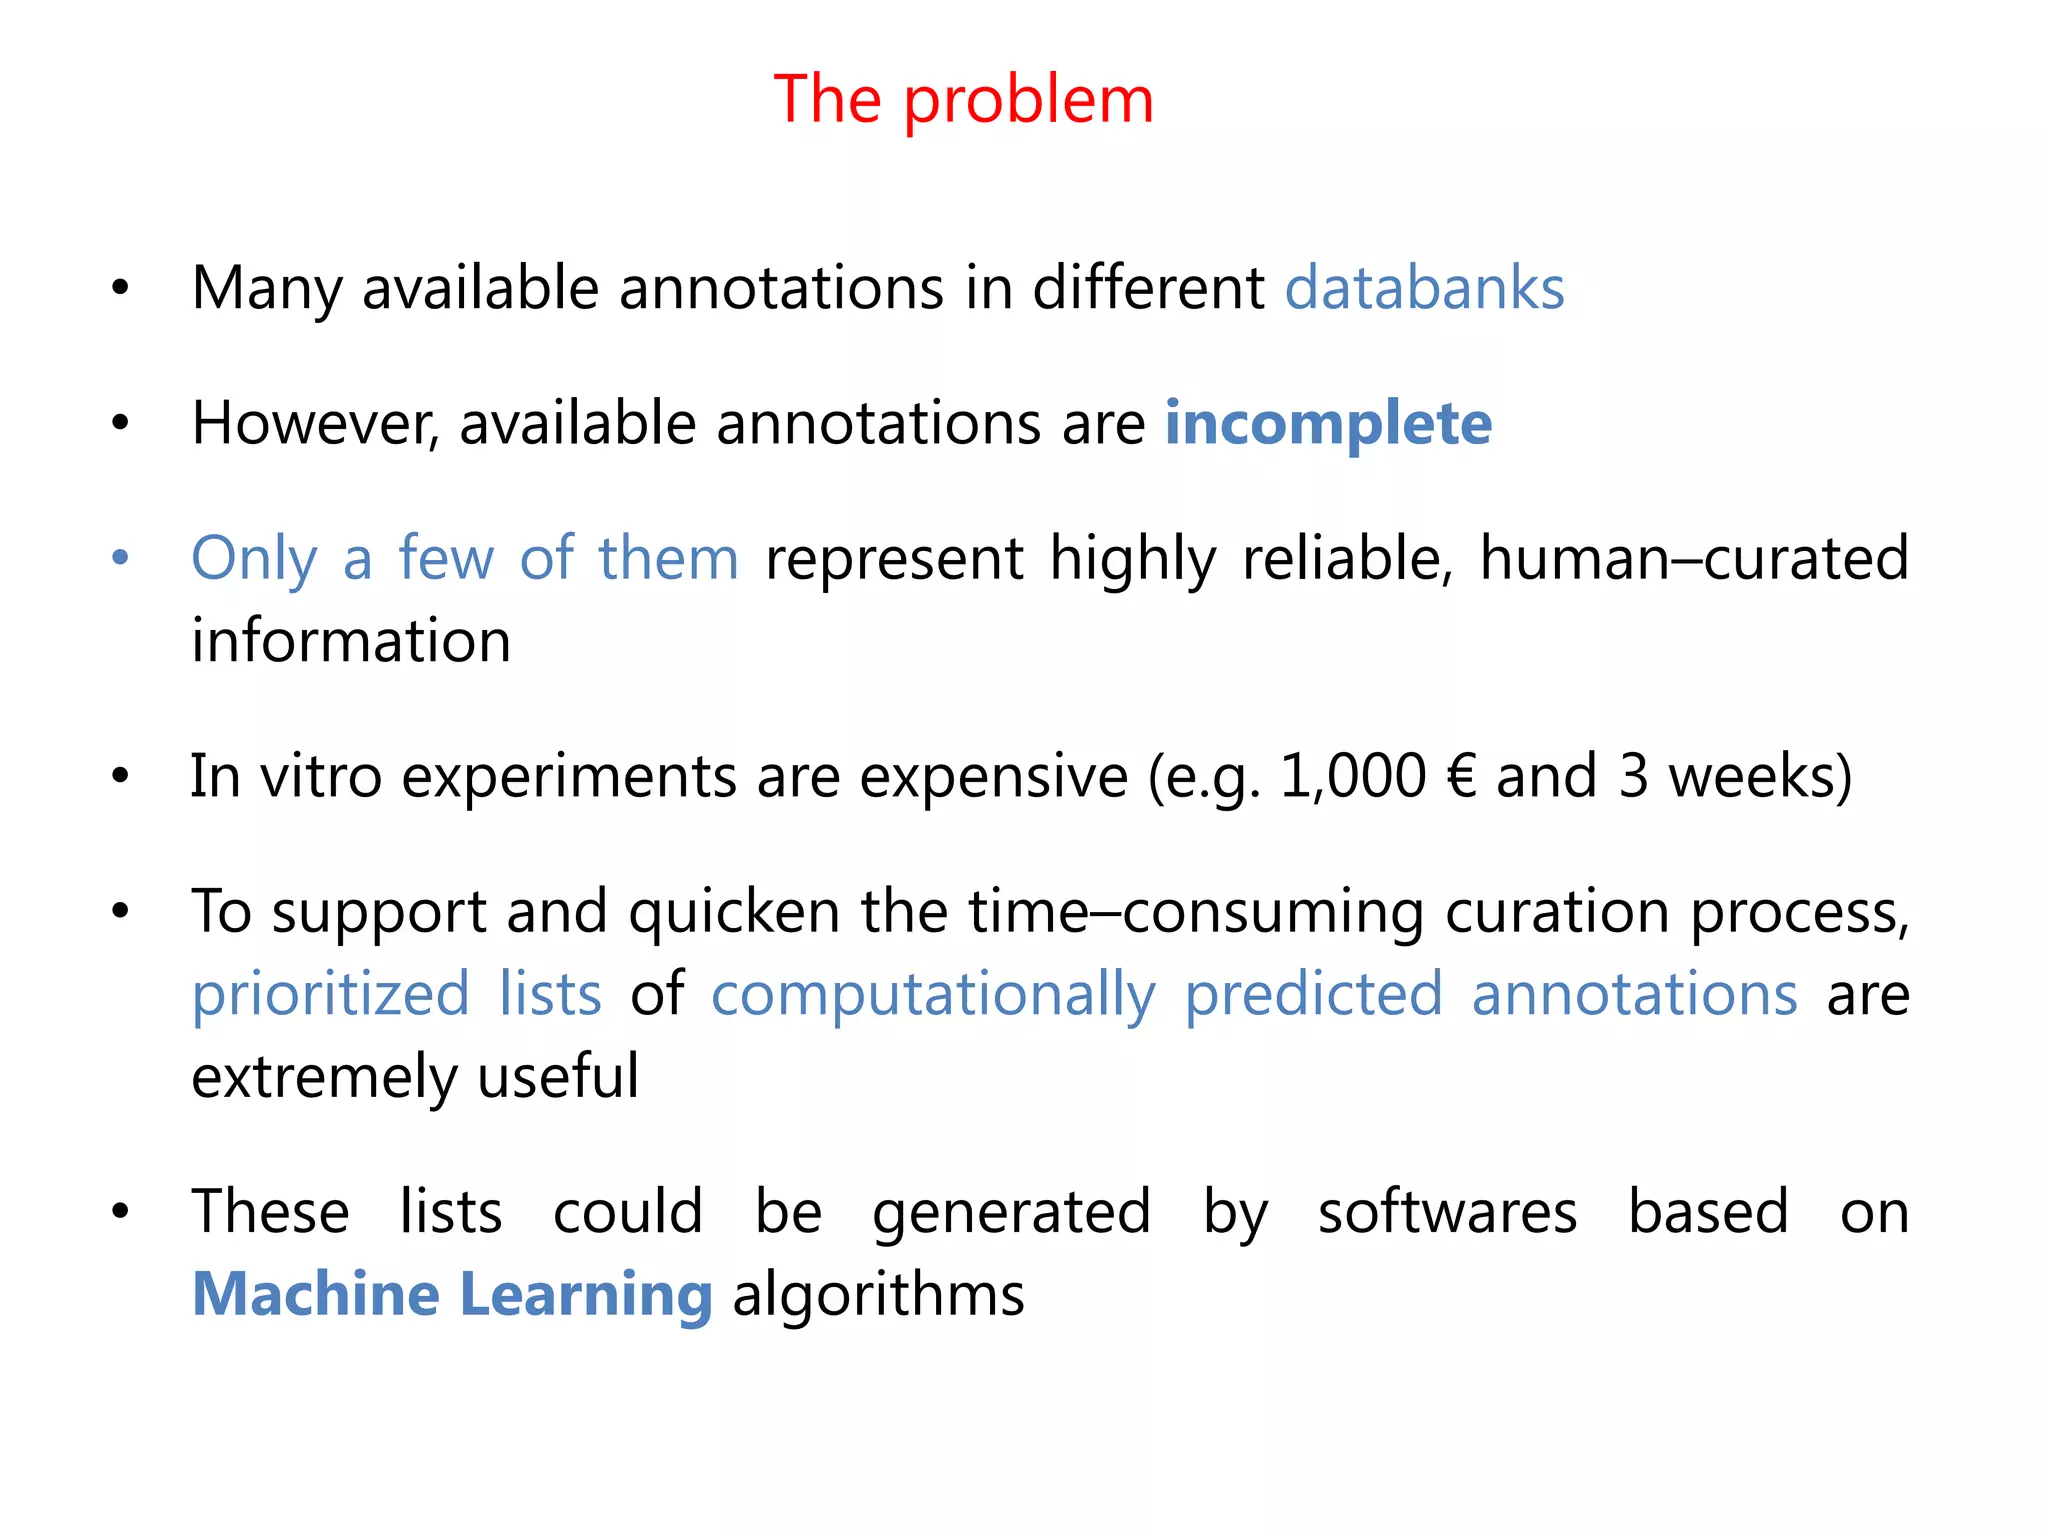
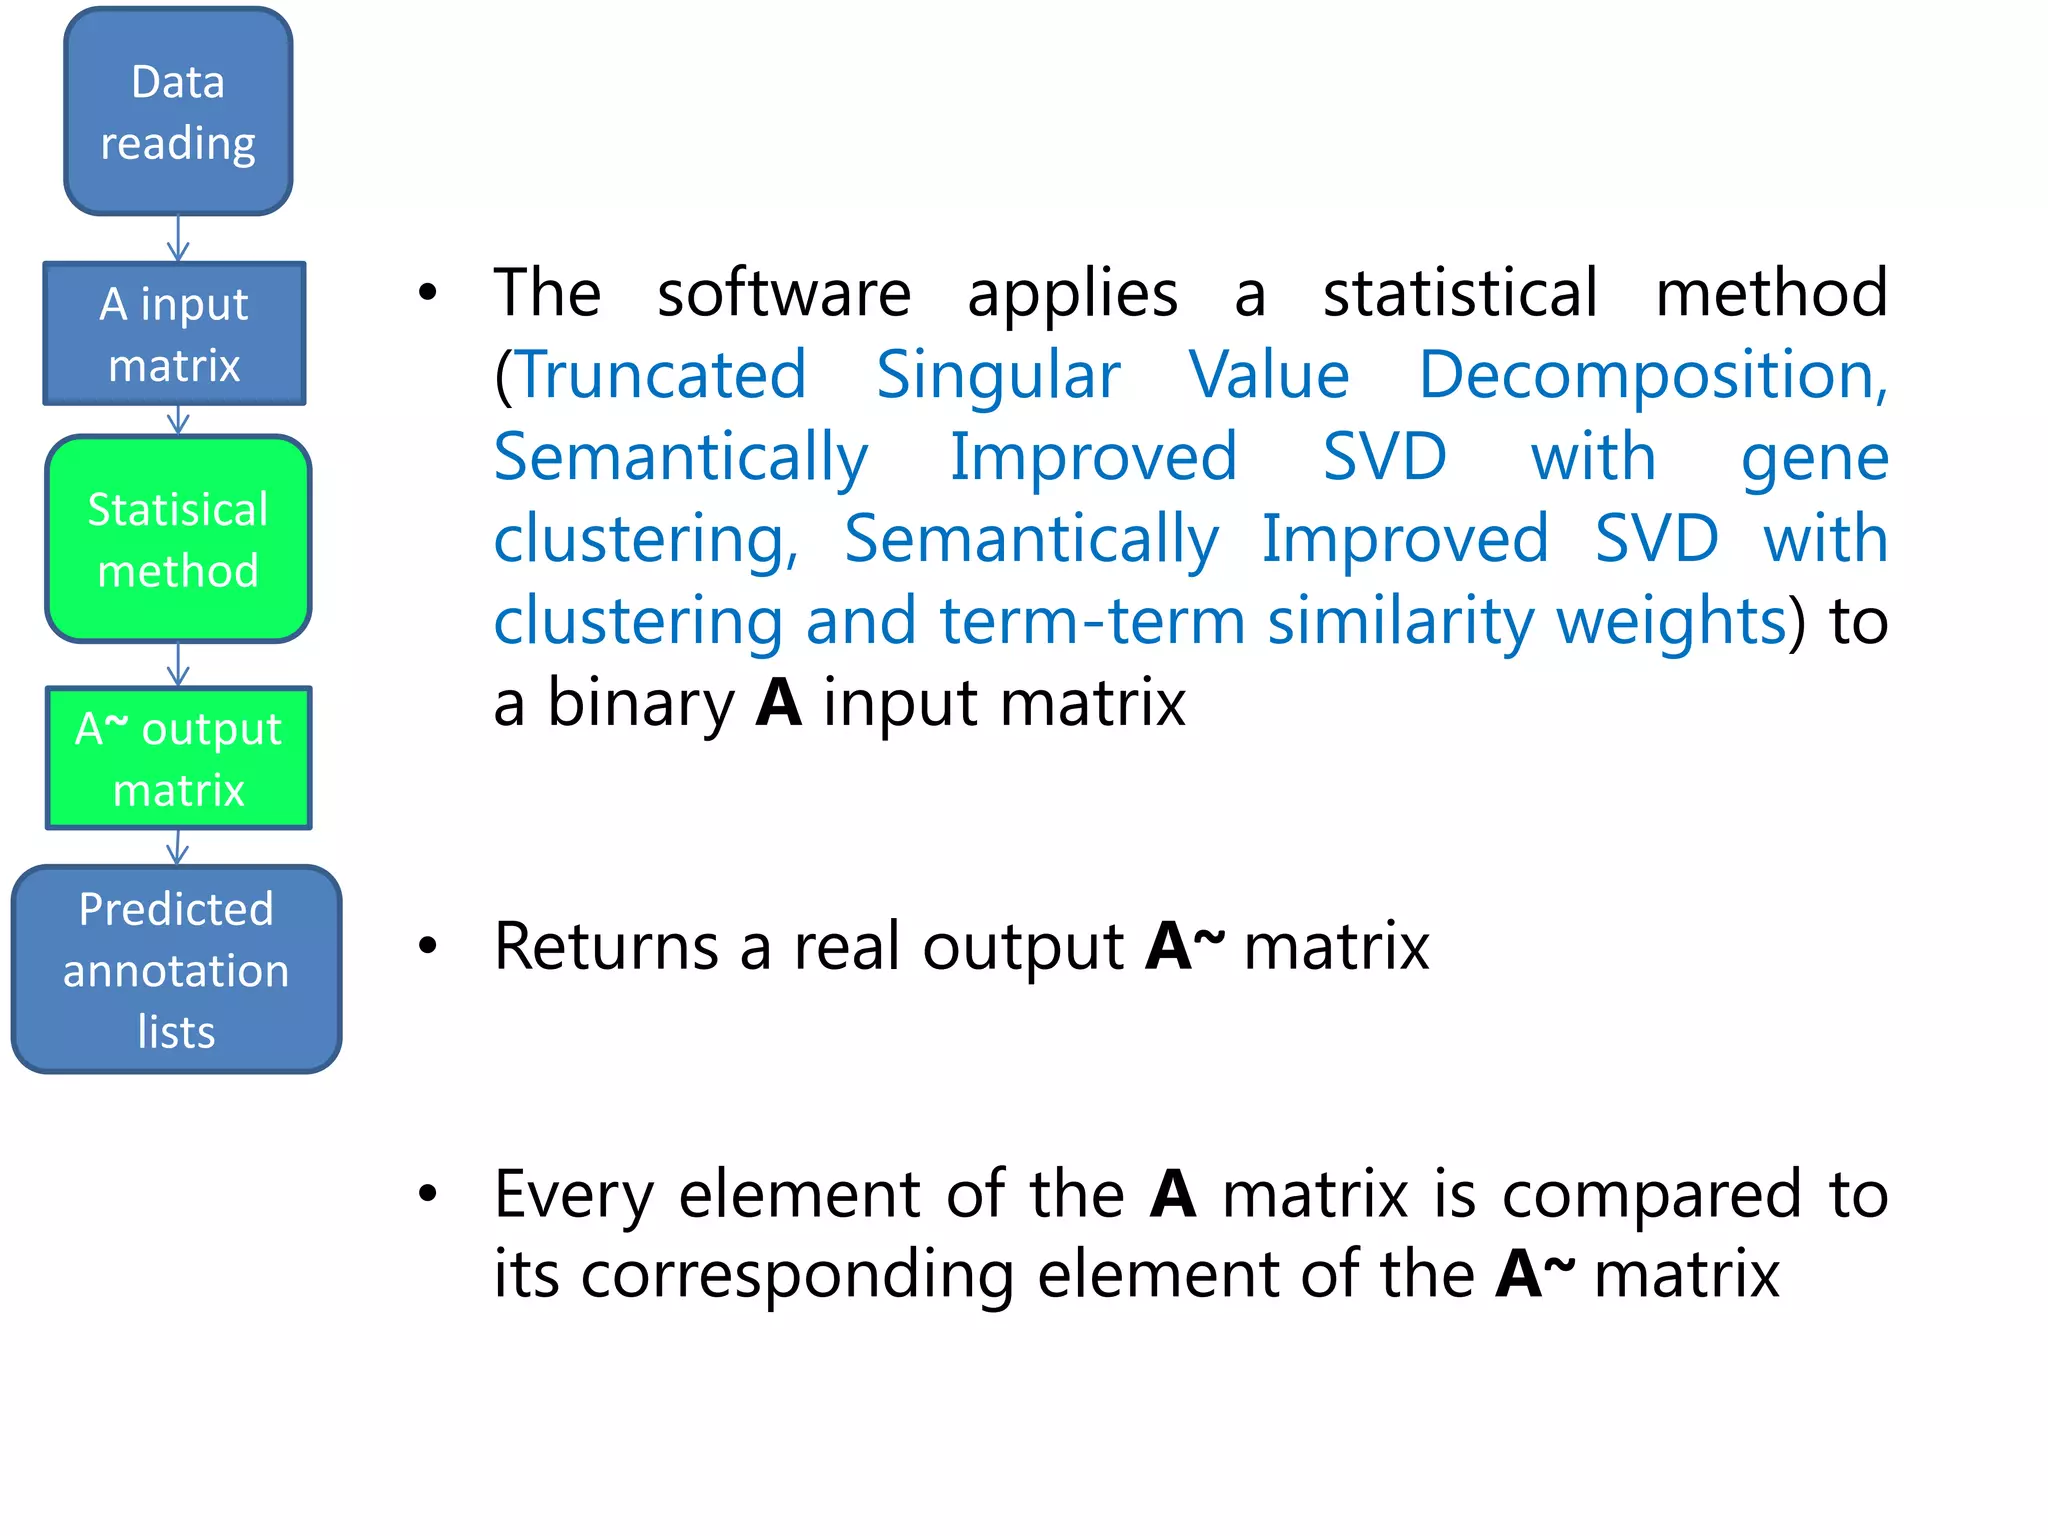
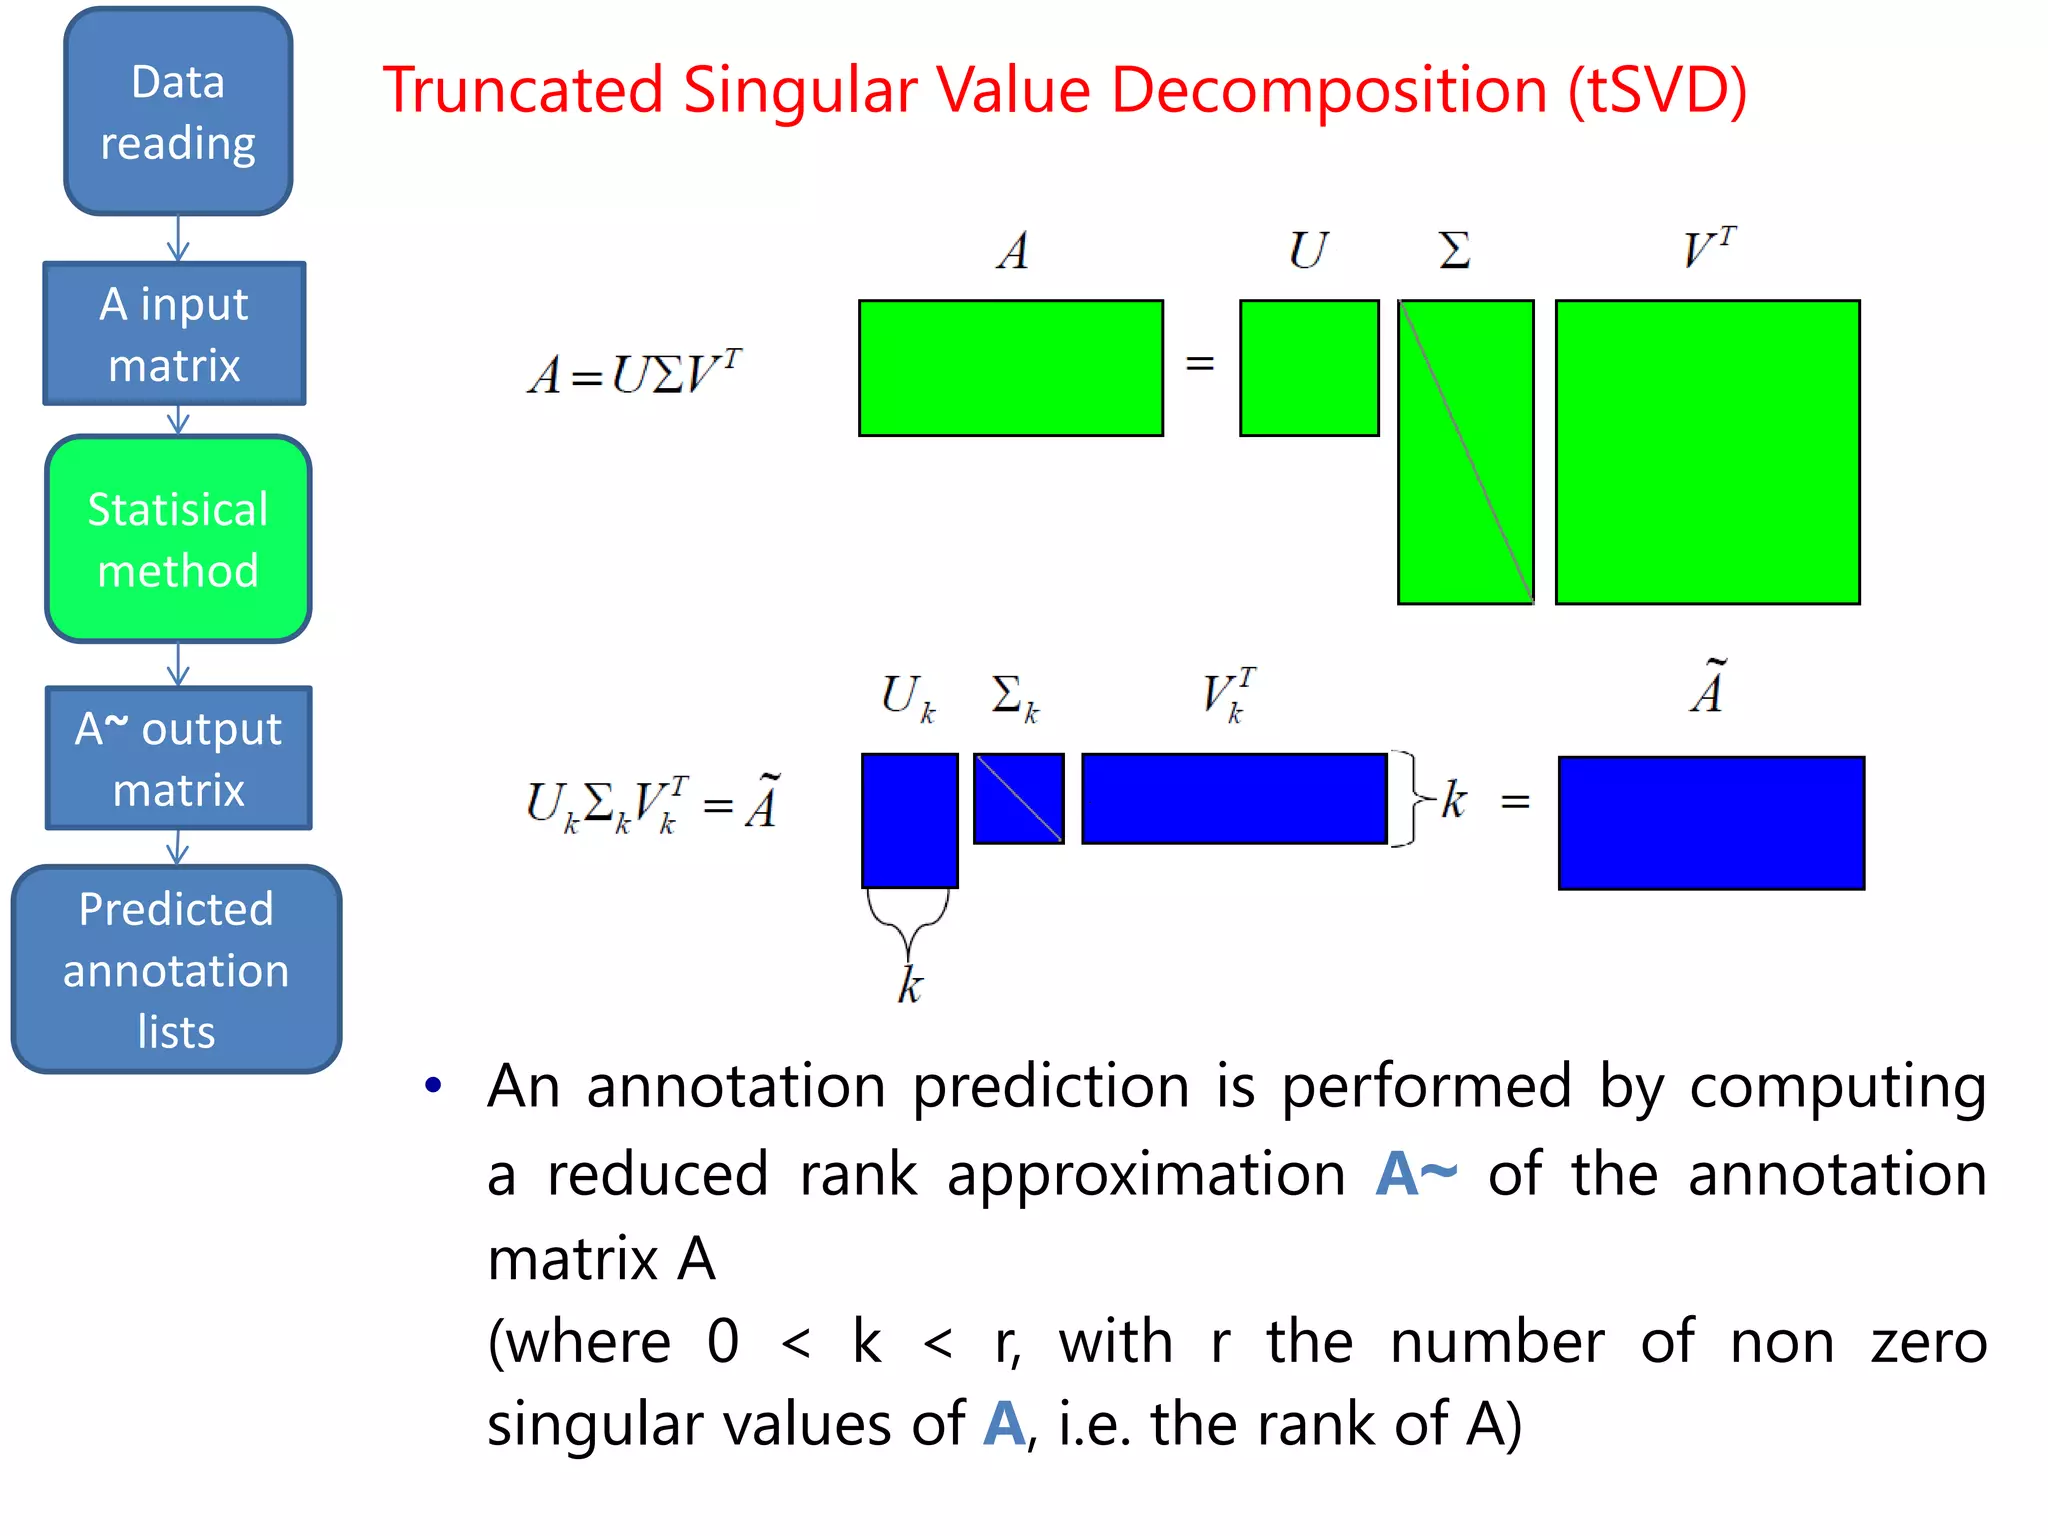
• Only the first most «important» k columns of A are
used for reconstruction
(where 0 < k < r, with r the number of non zero
singular values of A, i.e. the rank of A)
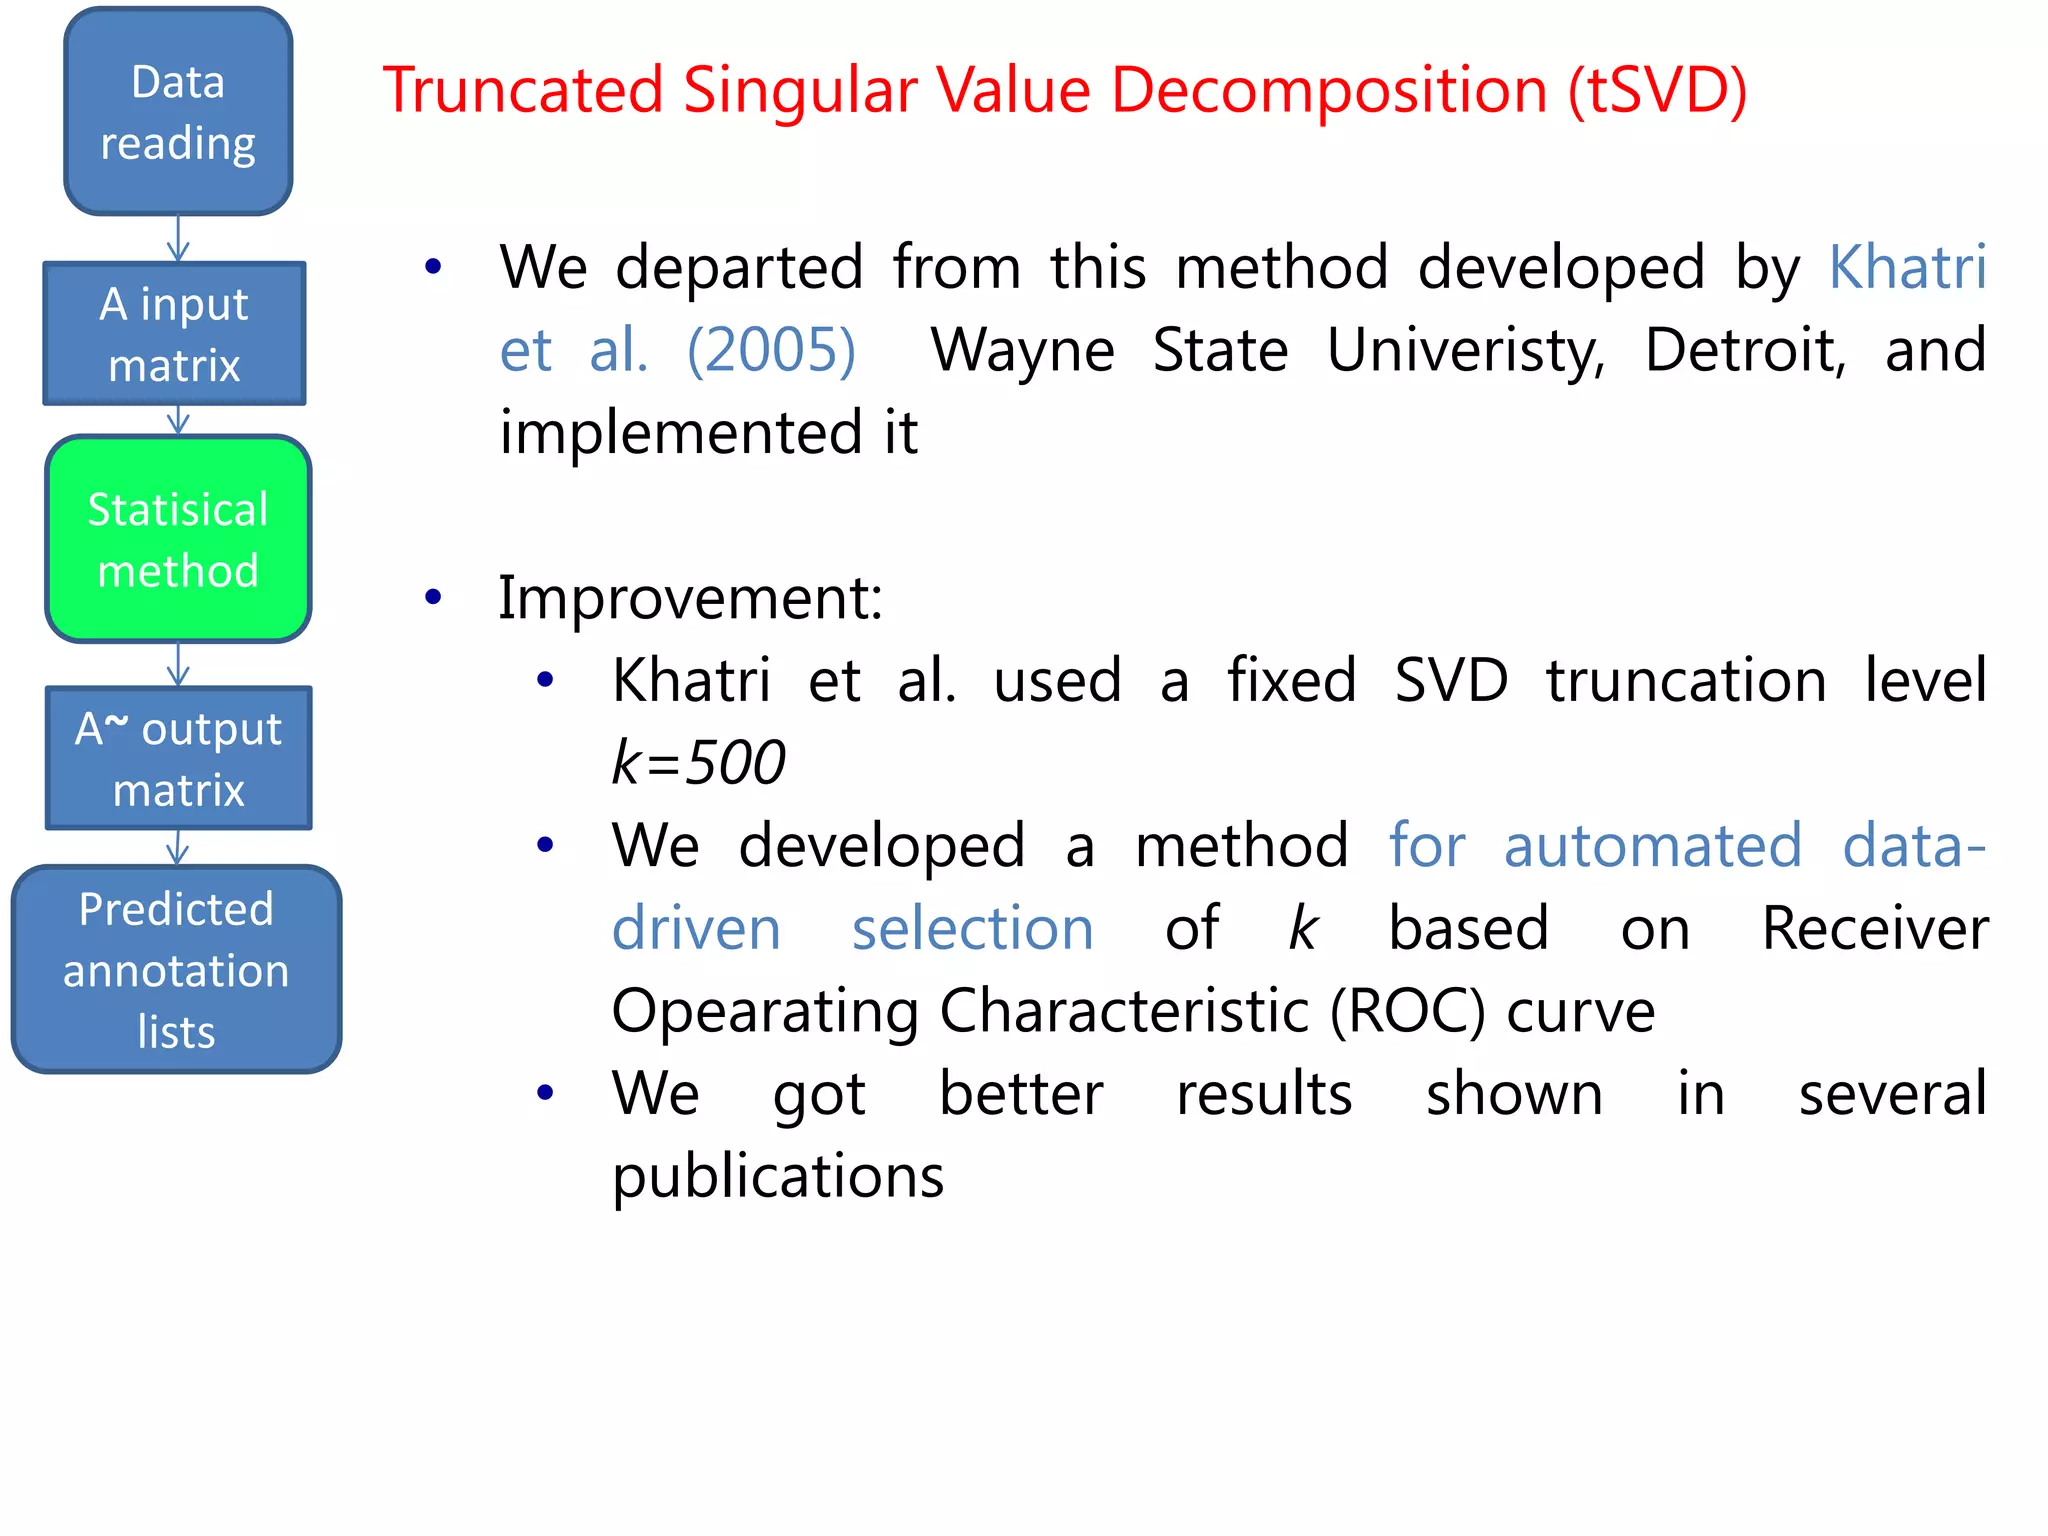
• In [P. Khatri et al. "A semantic analysis of the annotations of the
human genome“, Bioinformatics, 2005], the authors argued
that the study of the matrix A shows the semantic
relationships of the gene-function associations.
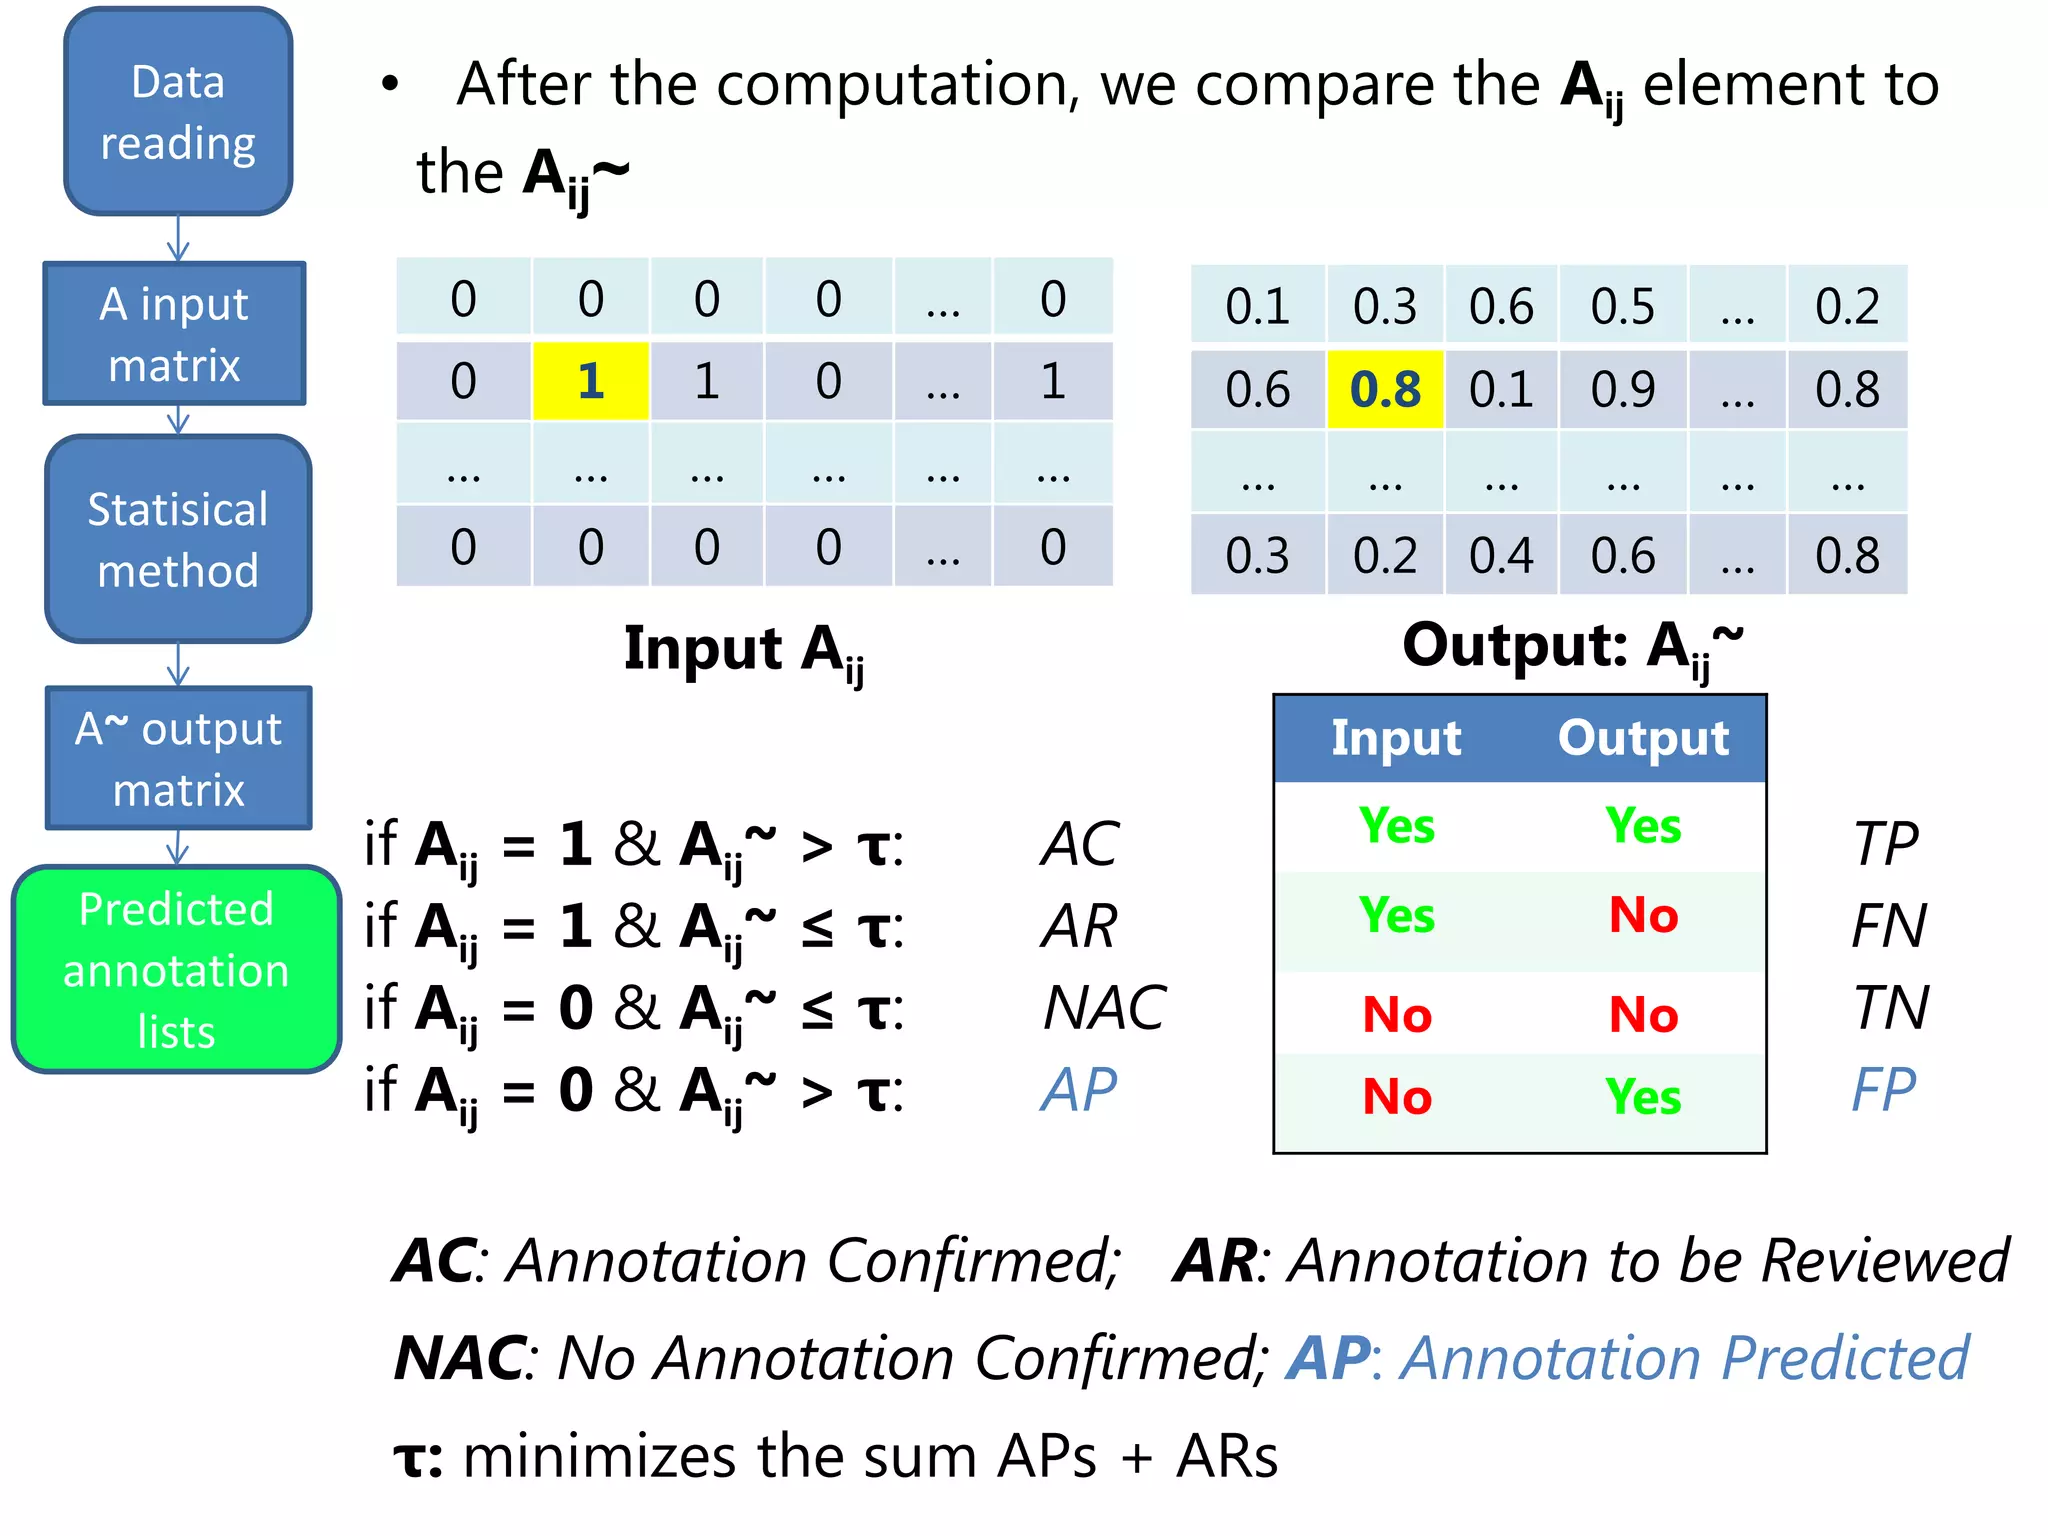
• A large value of a~ij suggests that gene i should be
annotated to term j, whereas a value close to zero
suggests the opposite.
Truncated Singular Value Decomposition (tSVD)](https://image.slidesharecdn.com/davidechiccobozza2014-03-20h0839-140320073943-phpapp02/75/Doctoral-Thesis-Dissertation-2014-03-20-PoliMi-13-2048.jpg)
![input
matrix output
Data
reading
Statisical
method
Predicted
annotation
lists
A input
matrix
A~ output
matrix
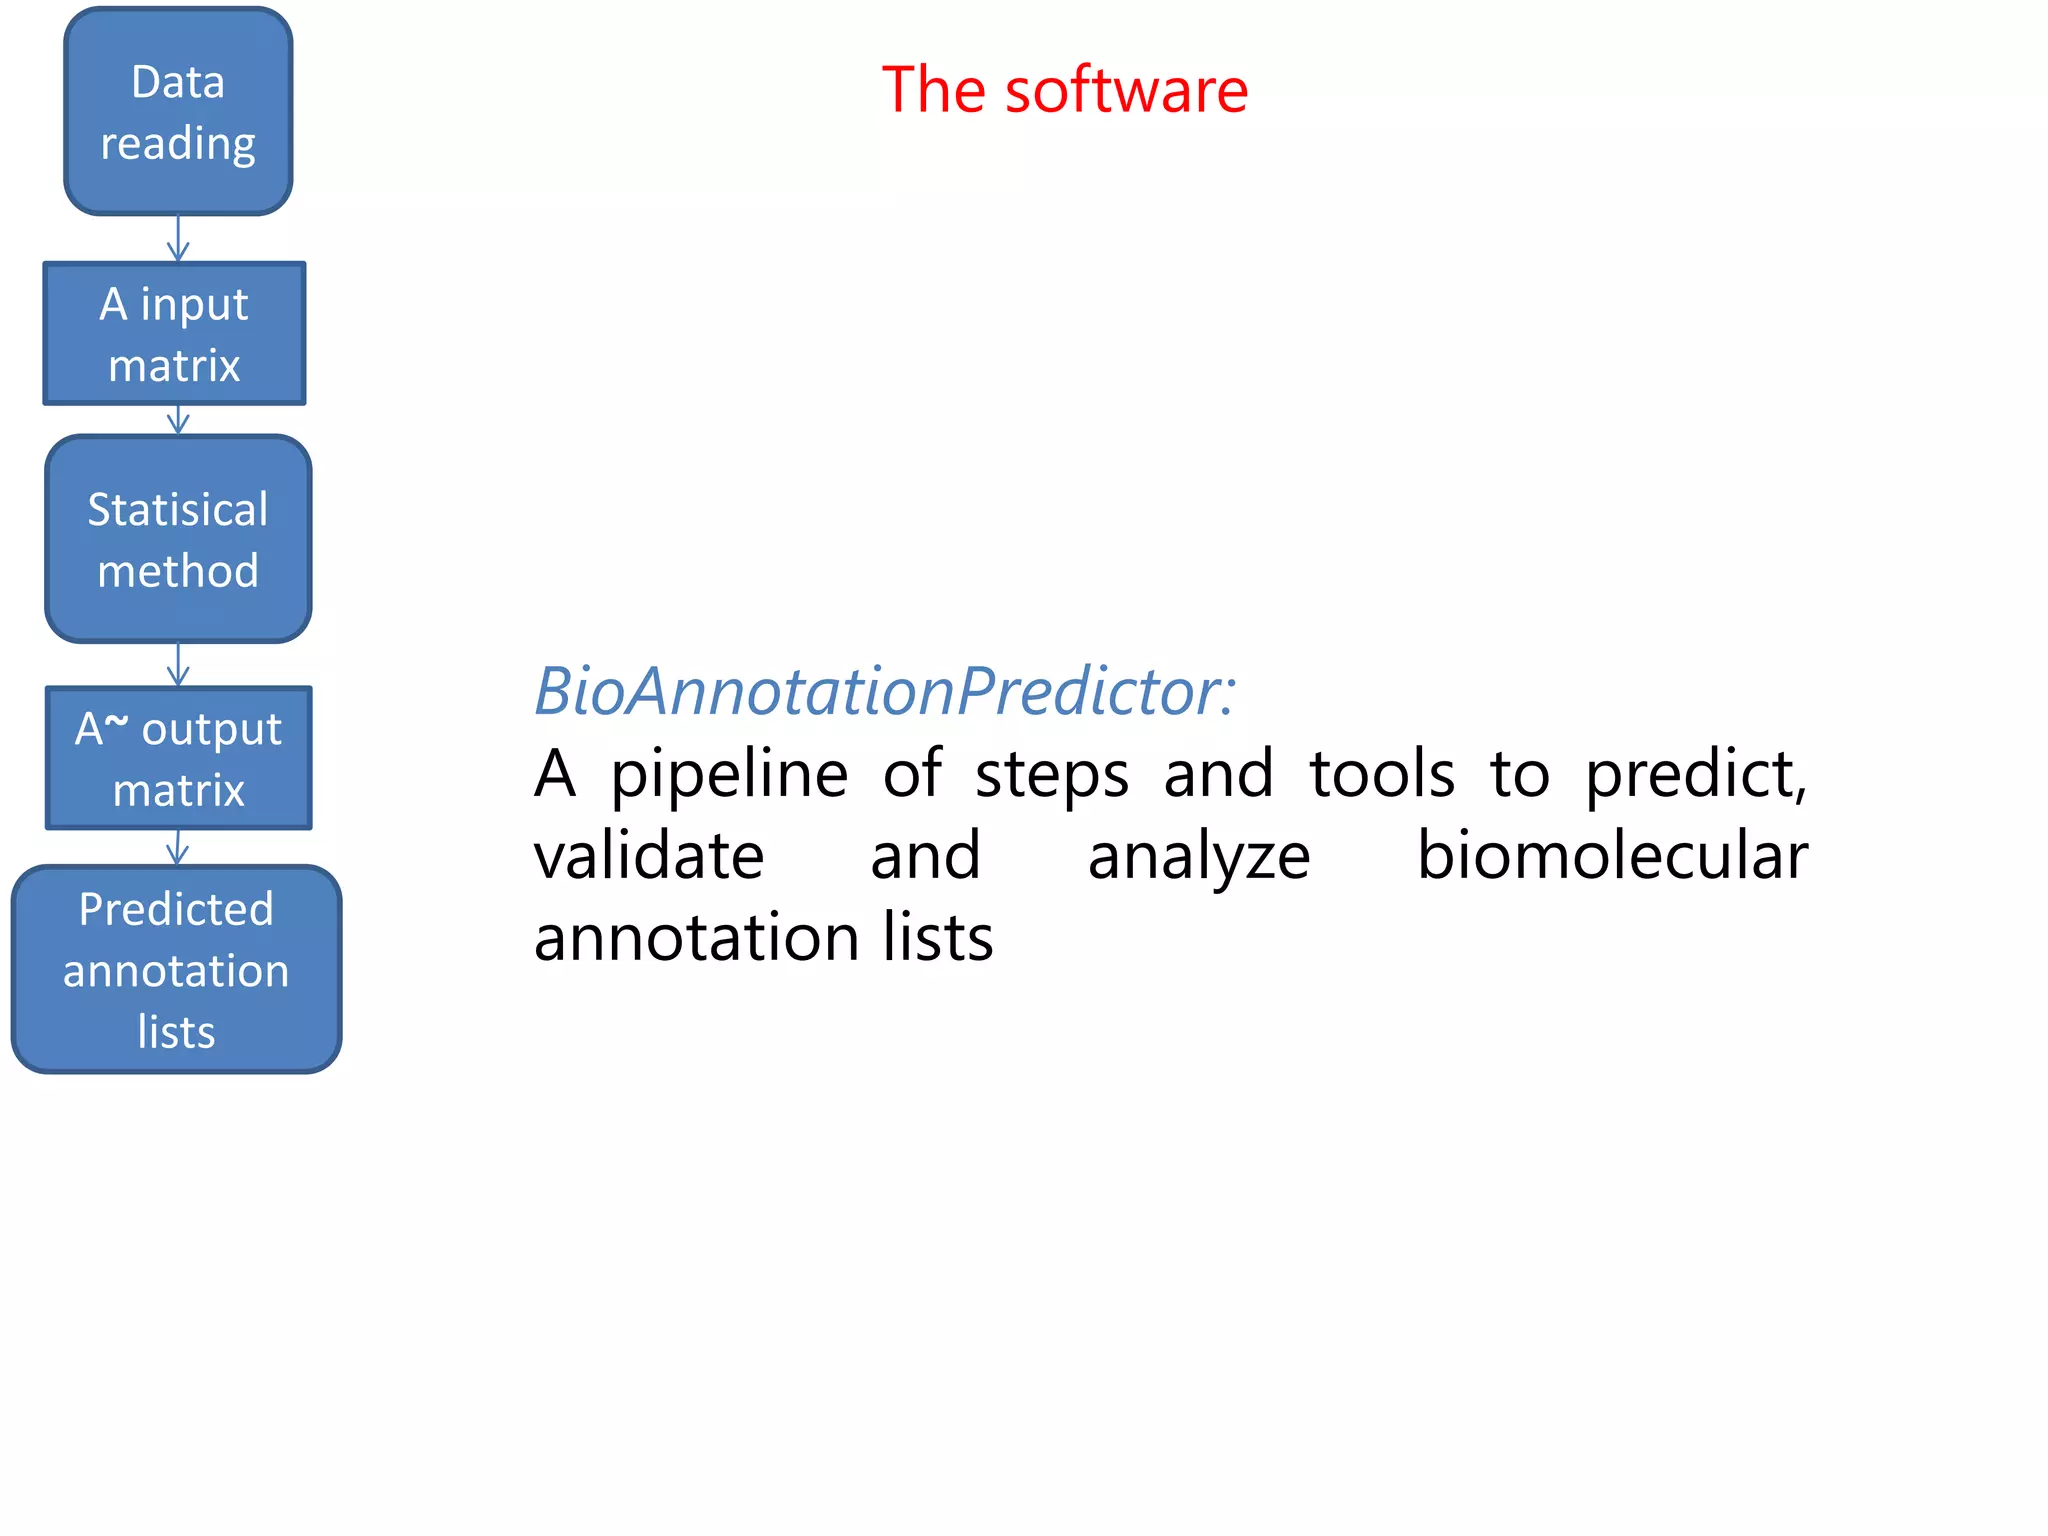
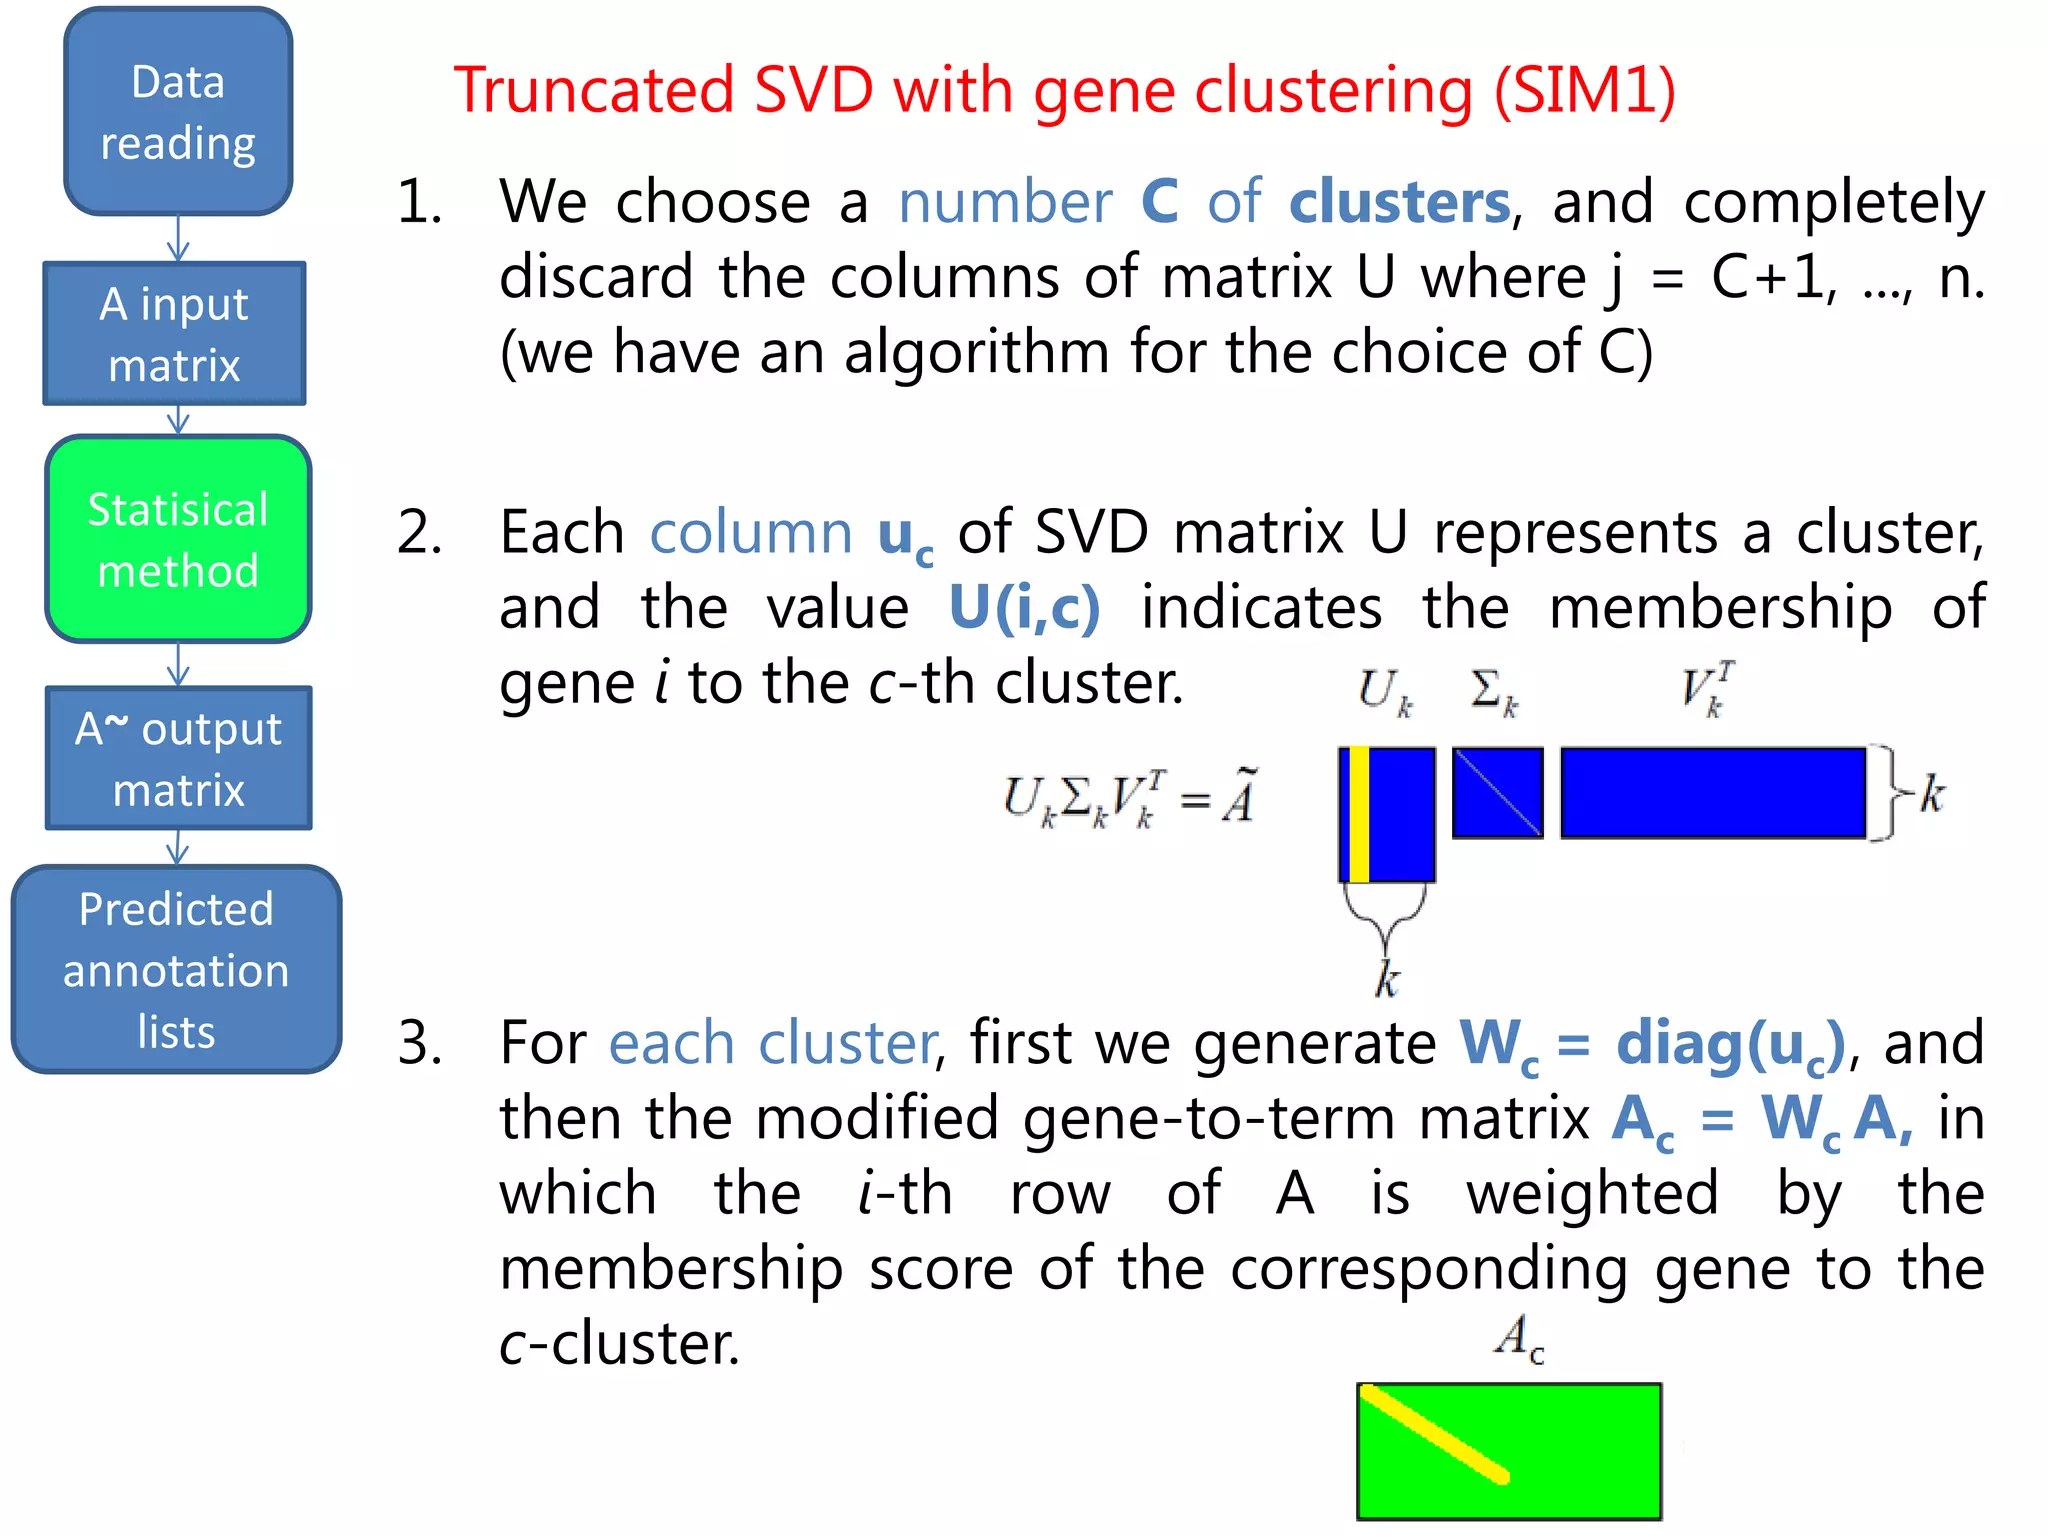
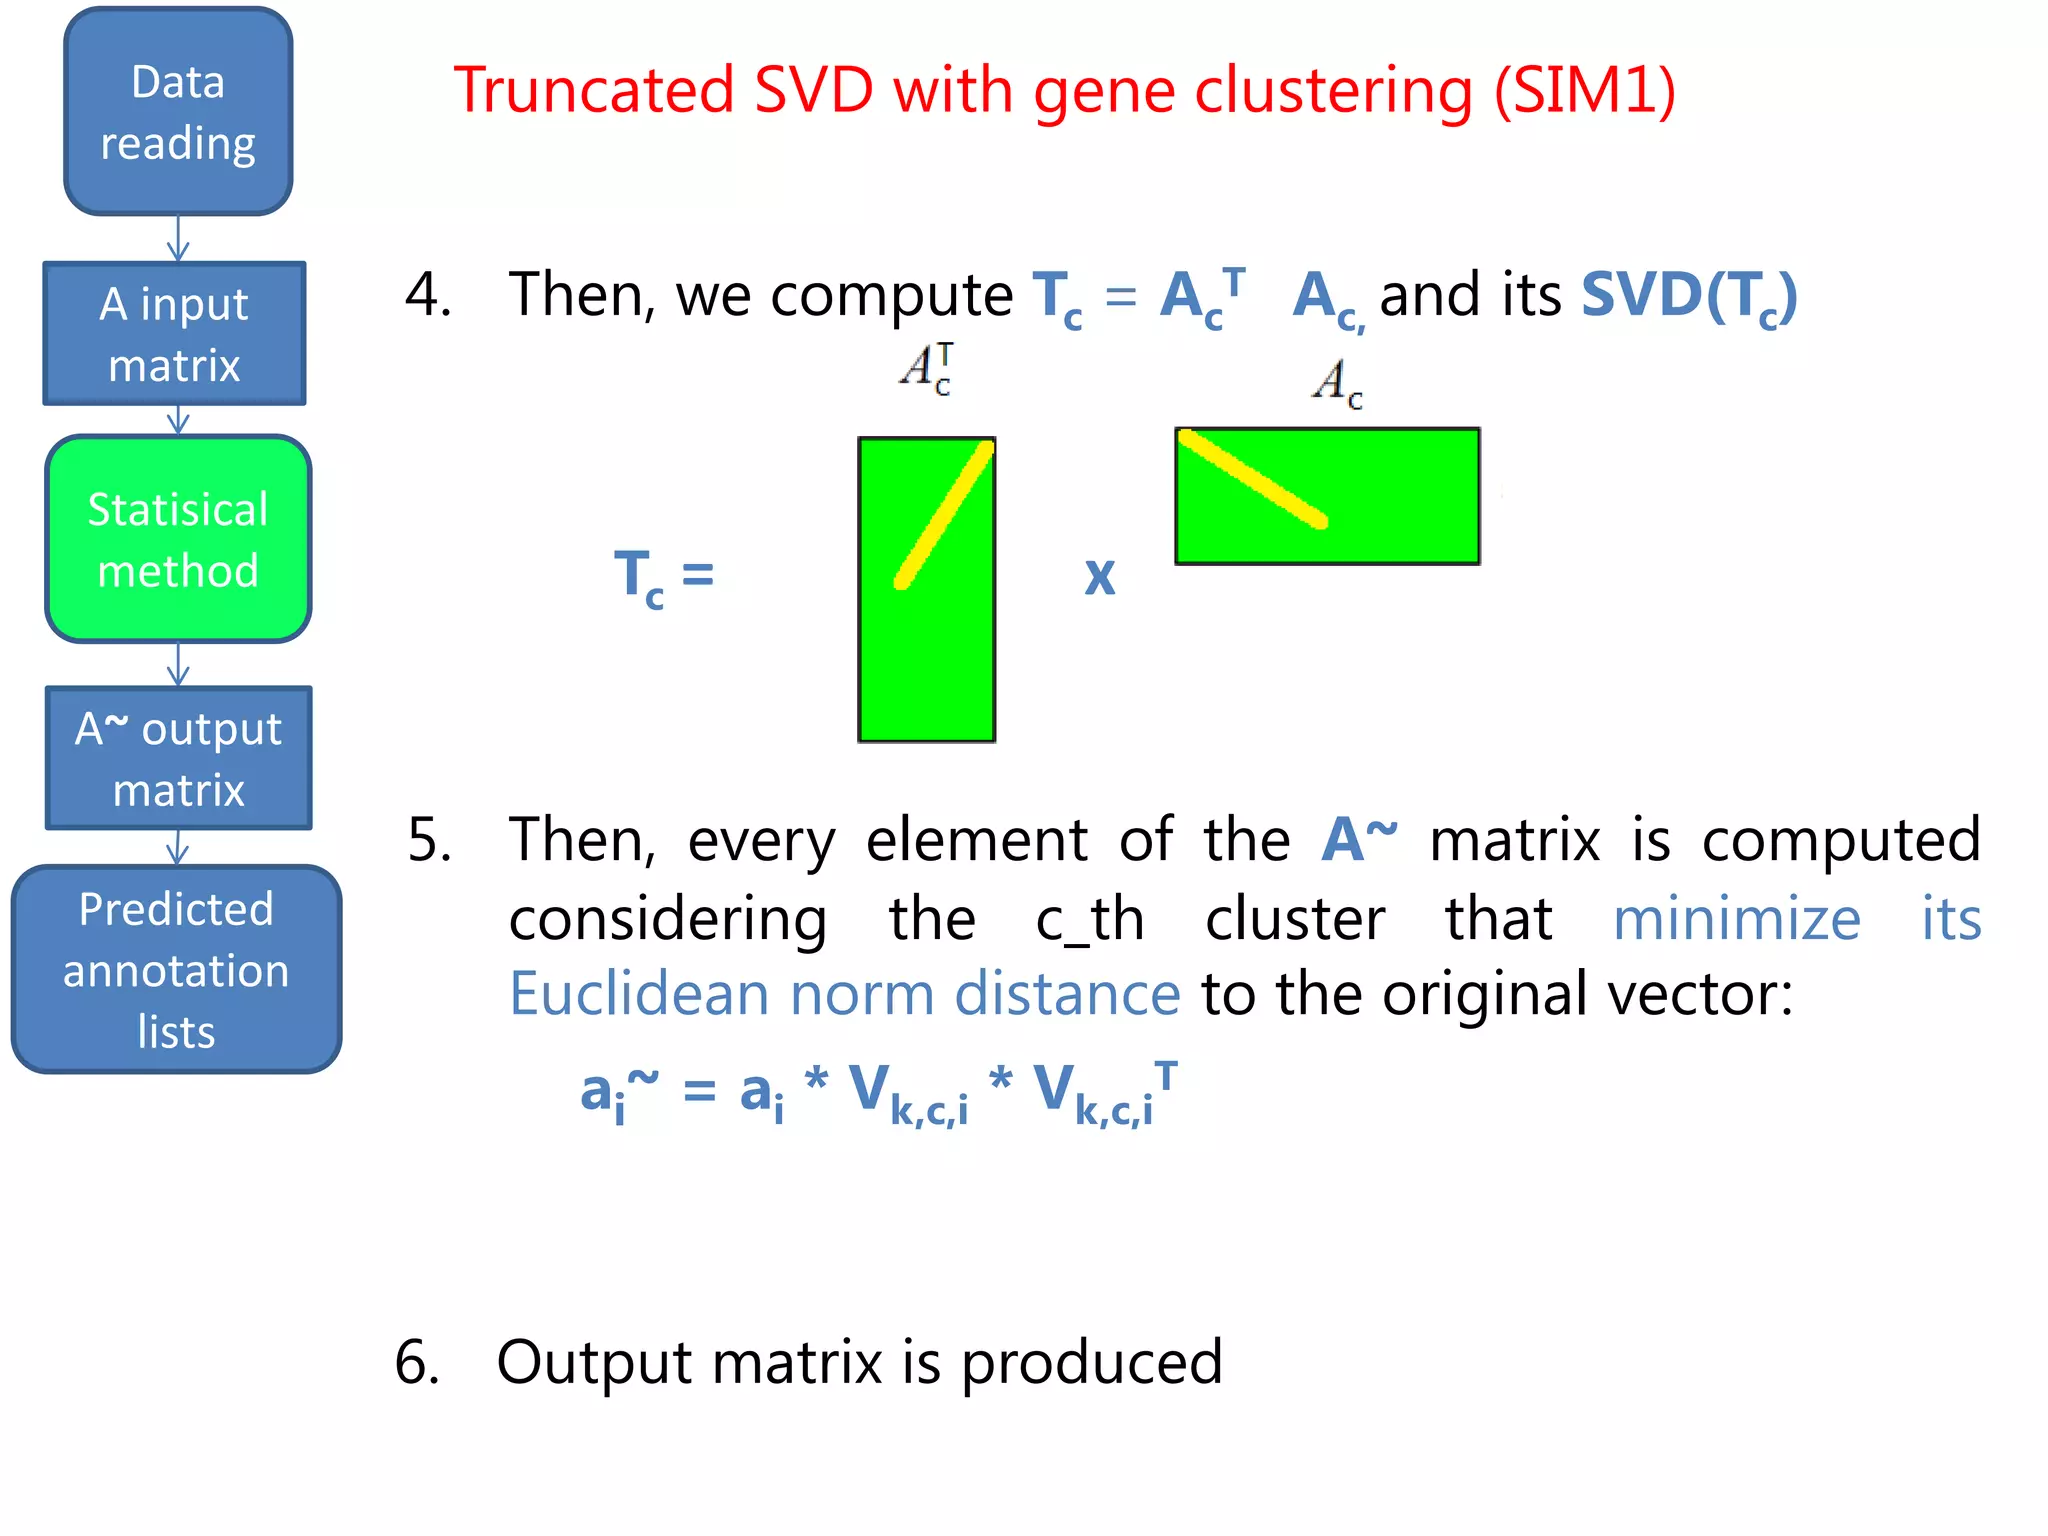
• Semantically improved (SIM1) version of the
Truncated SVD, based on gene clustering [P. Drineas et al.,
"Clustering large graphs via the singular value decomposition",
Machine Learning, 2004]
• Inspiring idea: similar genes can be grouped in
clusters, that have different weights
Truncated SVD with gene clustering (SIM1)](https://image.slidesharecdn.com/davidechiccobozza2014-03-20h0839-140320073943-phpapp02/75/Doctoral-Thesis-Dissertation-2014-03-20-PoliMi-15-2048.jpg)
![input
matrix output
Data
reading
Statisical
method
Predicted
annotation
lists
A input
matrix
A~ output
matrix
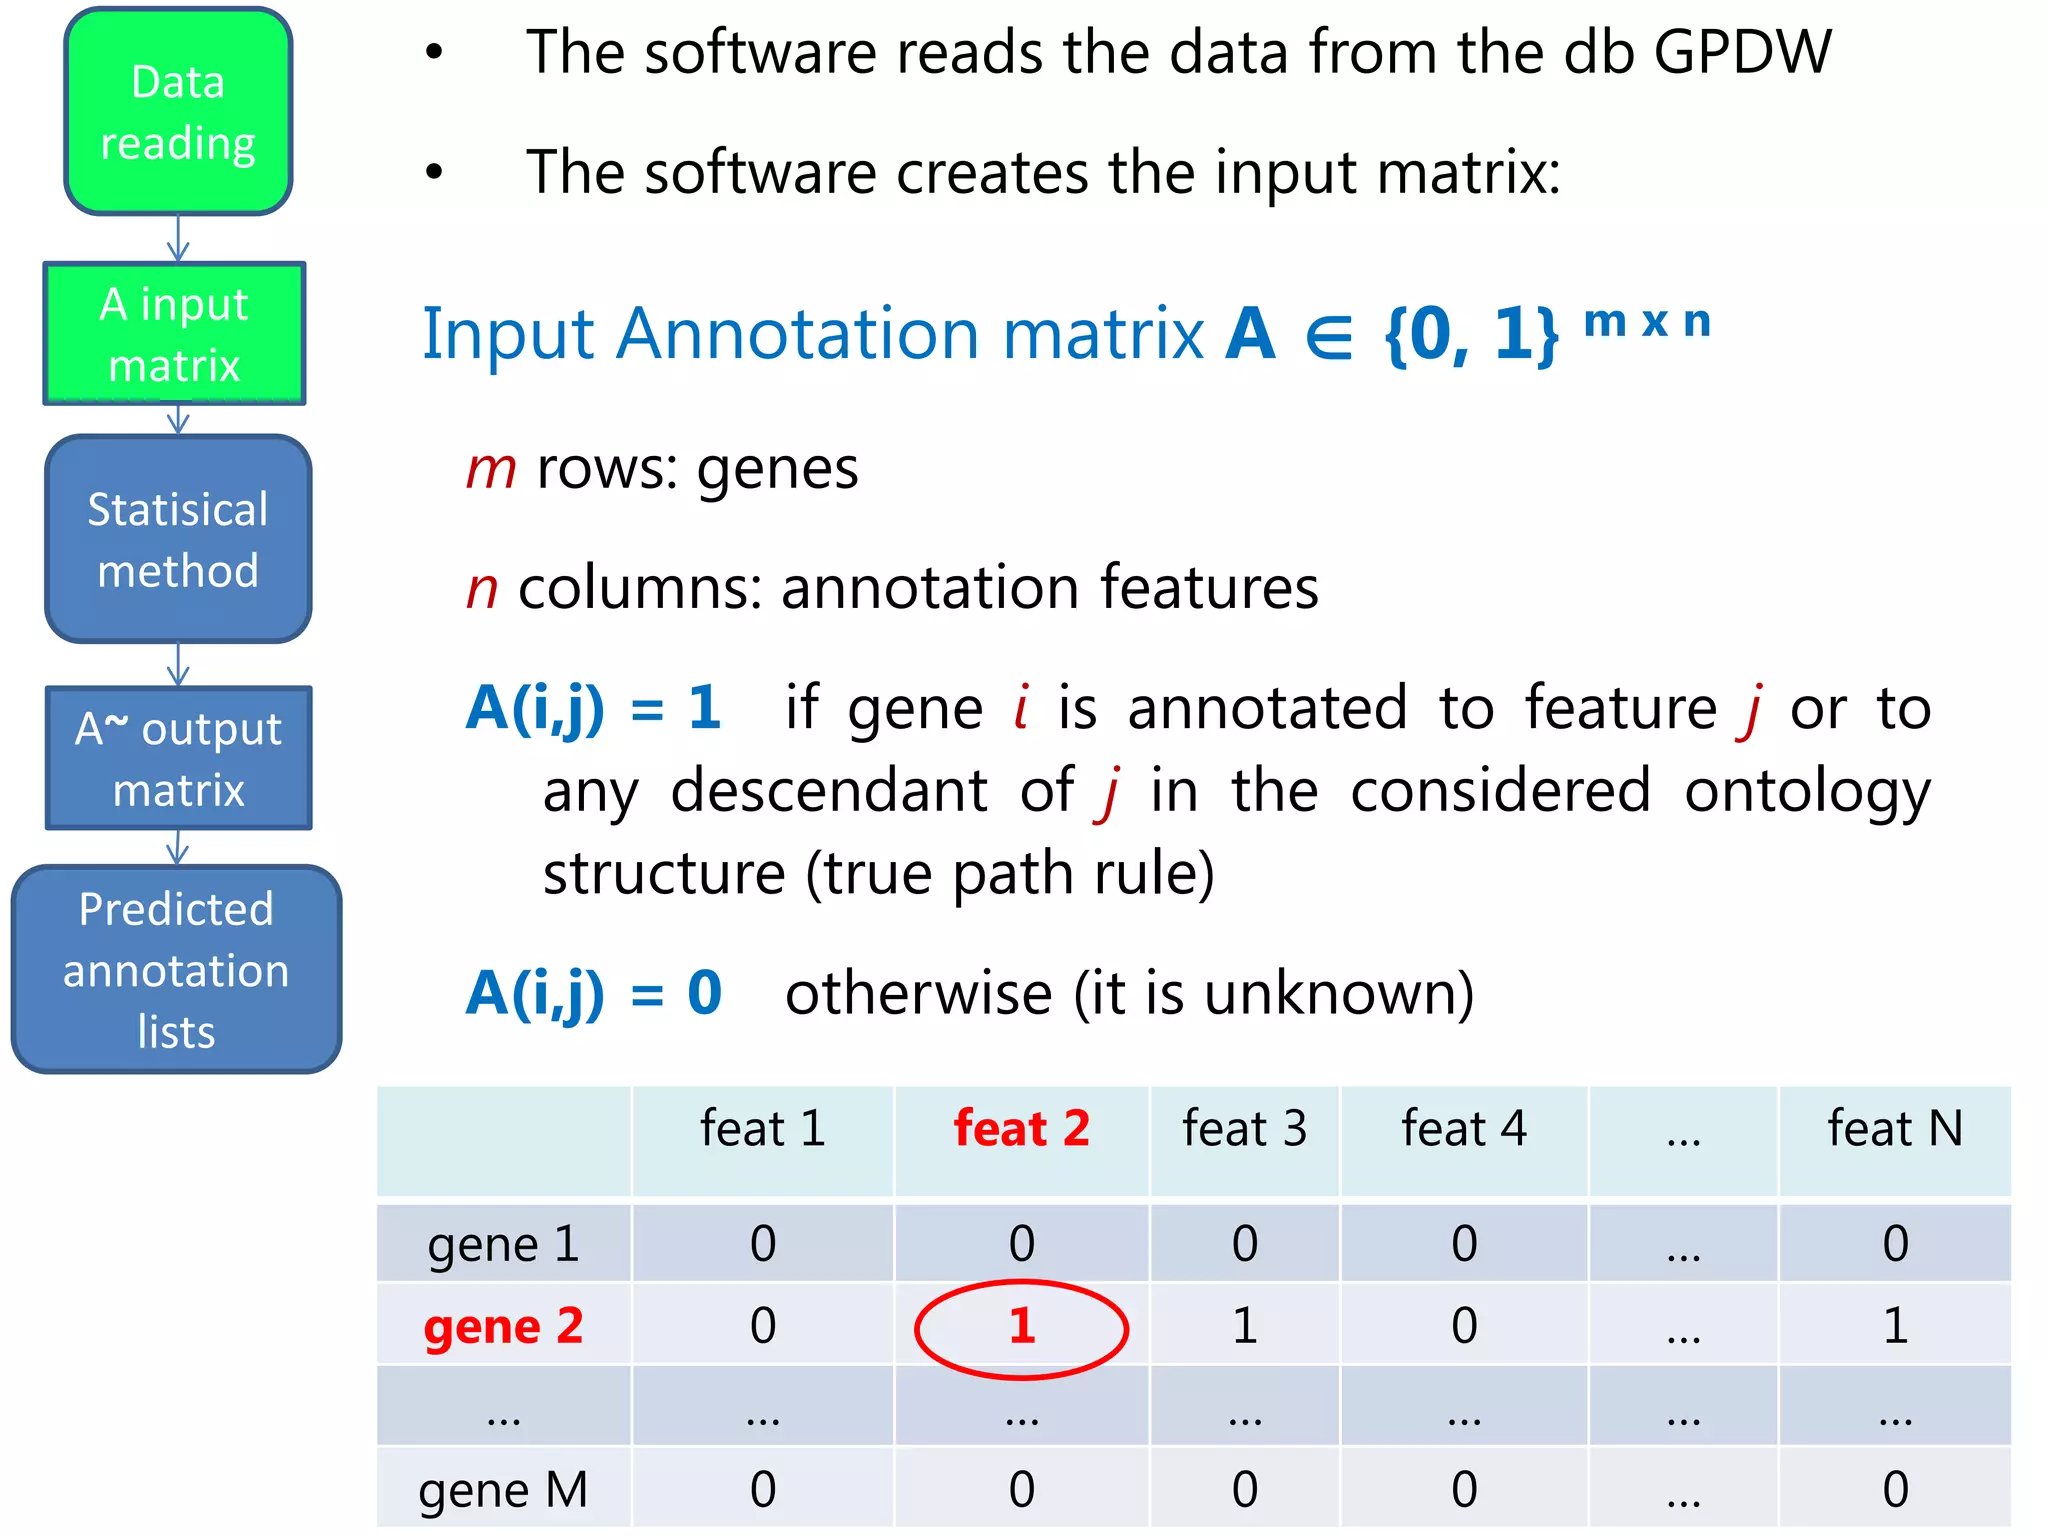
• Semantically improved (SIM2) version of the
Truncated SVD, based on gene clustering and term-
term similarity weights [P. Resnik, "Using information content to
evaluate semantic similarity in a taxonomy“, arXiv.org, 1995]
• Inspiring idea: functionally similar terms, should be
annotated to the same genes
Truncated SVD with gene clustering and term-
similarity weights (SIM2)](https://image.slidesharecdn.com/davidechiccobozza2014-03-20h0839-140320073943-phpapp02/75/Doctoral-Thesis-Dissertation-2014-03-20-PoliMi-18-2048.jpg)
![input
matrix output
Data
reading
Statisical
method
Predicted
annotation
lists
A input
matrix
A~ output
matrix
Truncated SVD with gene clustering and term-
similarity weights (SIM2)
In the algorithm shown before, we would add the
following step:
6. a) Furthermore, to effect more accurate clustering, we
compute the eigenvectors of the matrix G~ = ASAT
where real n*n matrix S is the term similarity matrix.
Starting from a pair of ontology terms, j1 and j2, the
term functional similarity S(j1, j2) can be calculated
using different methods.
Similarity is based on Resnik measure [P. Resnik, "Using
information content to evaluate semantic similarity in a
taxonomy", arXiv.org, 1995]](https://image.slidesharecdn.com/davidechiccobozza2014-03-20h0839-140320073943-phpapp02/75/Doctoral-Thesis-Dissertation-2014-03-20-PoliMi-19-2048.jpg)
![Final predictions
input
matrix
output
Data
reading
Statisical
method
A input
matrix
A~ output
matrix
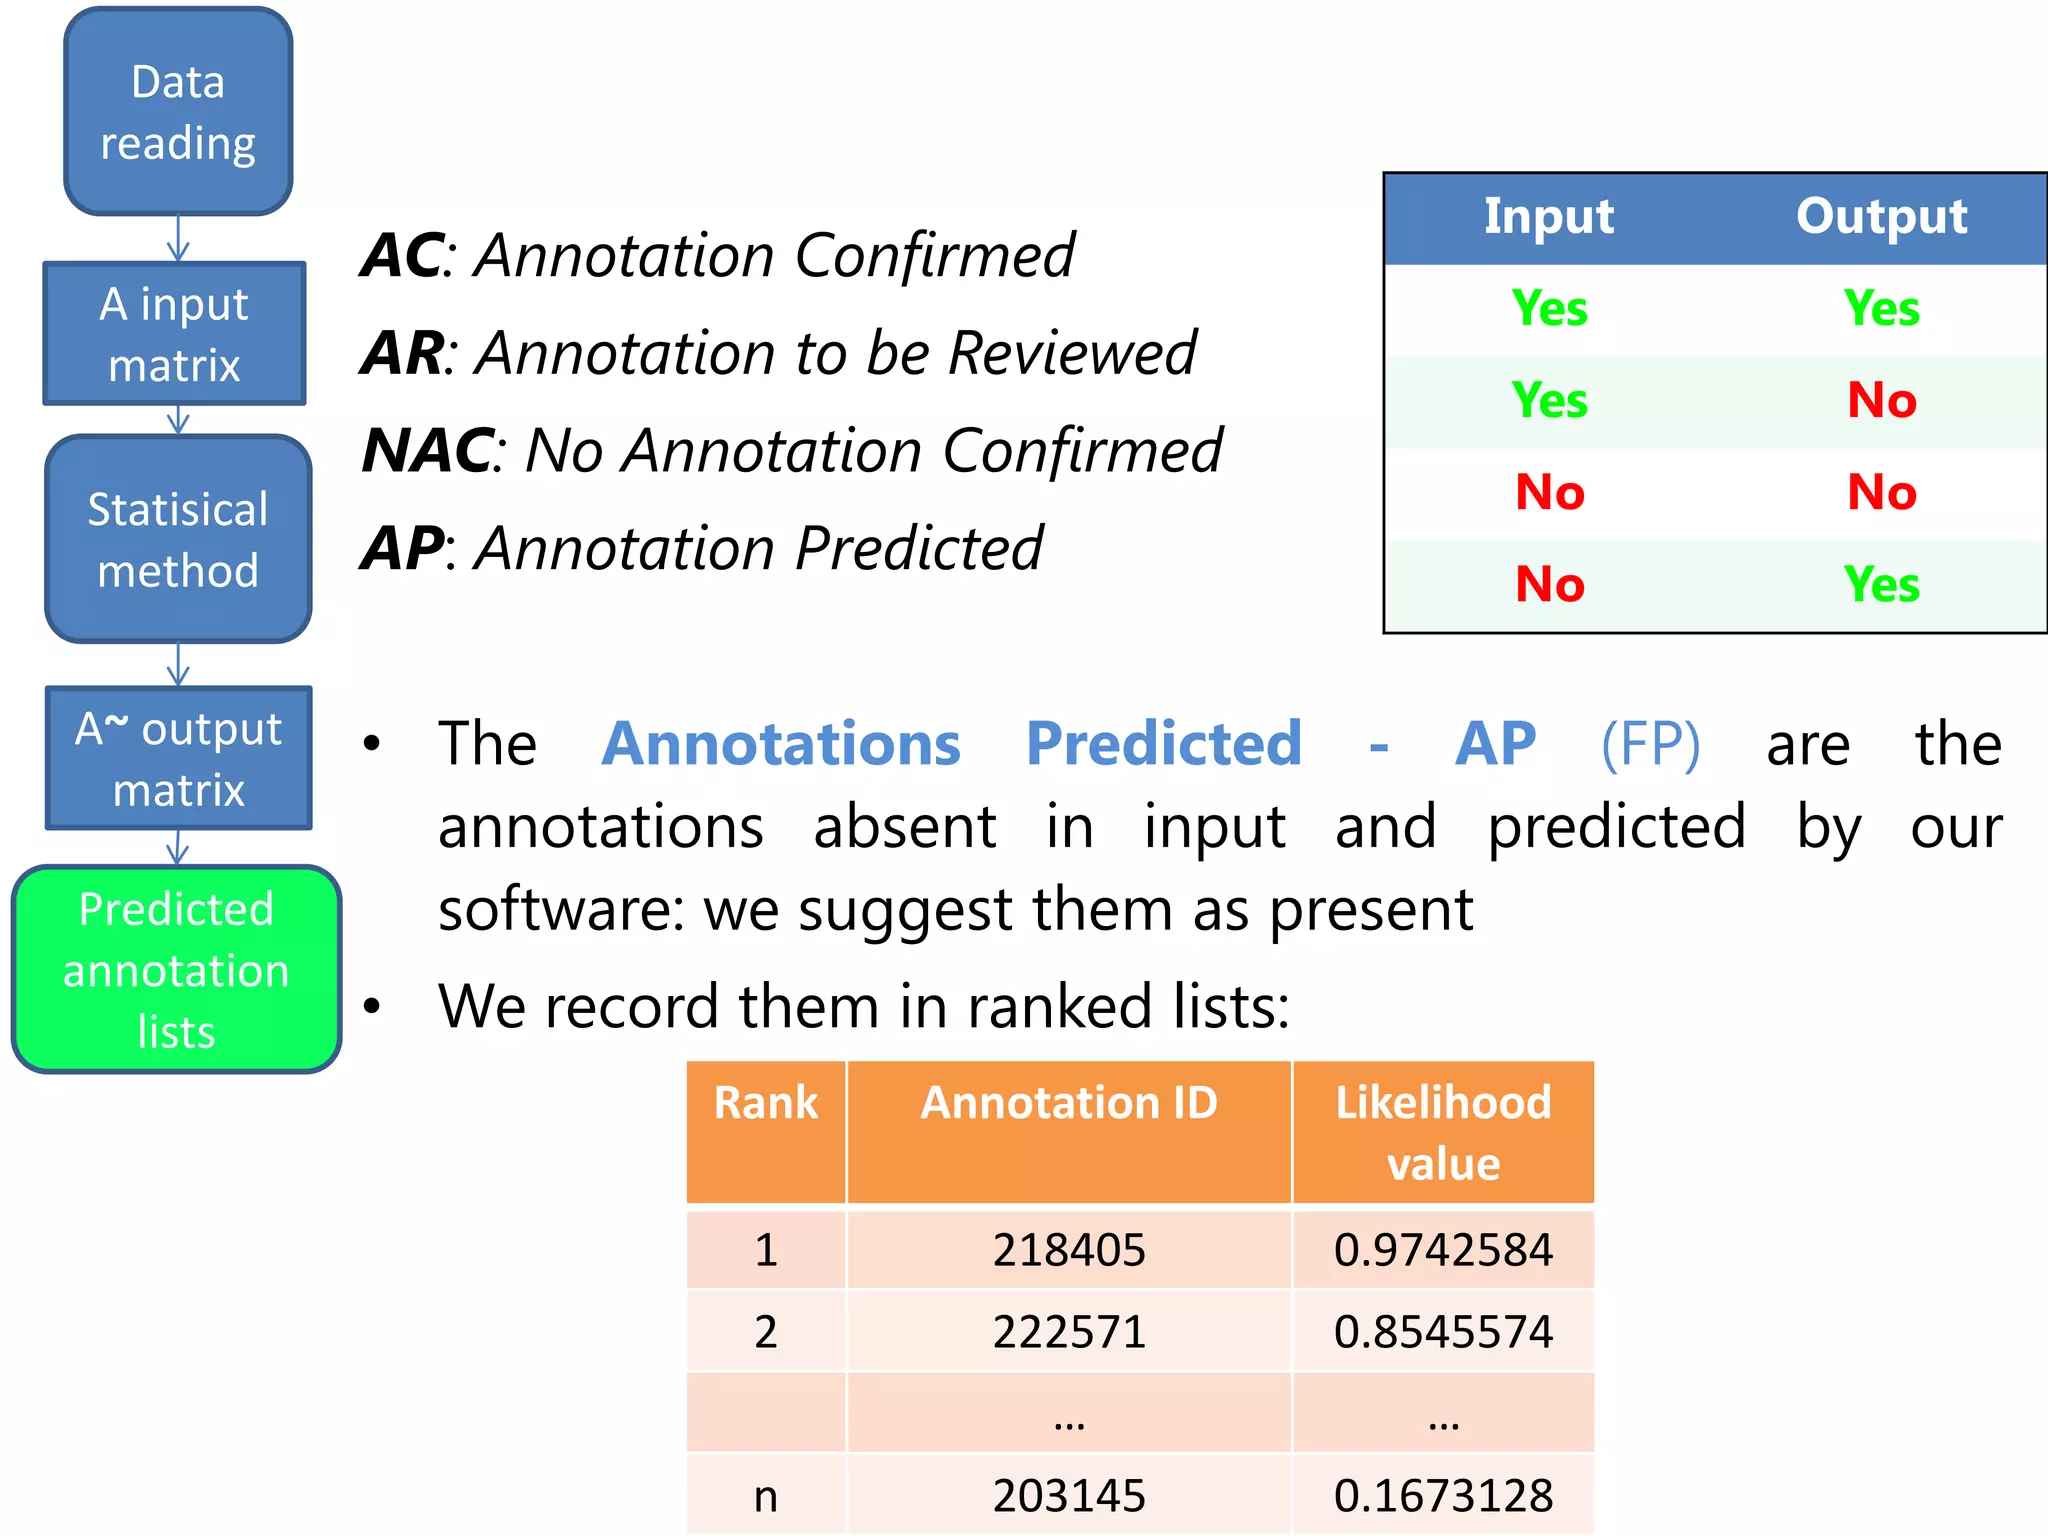
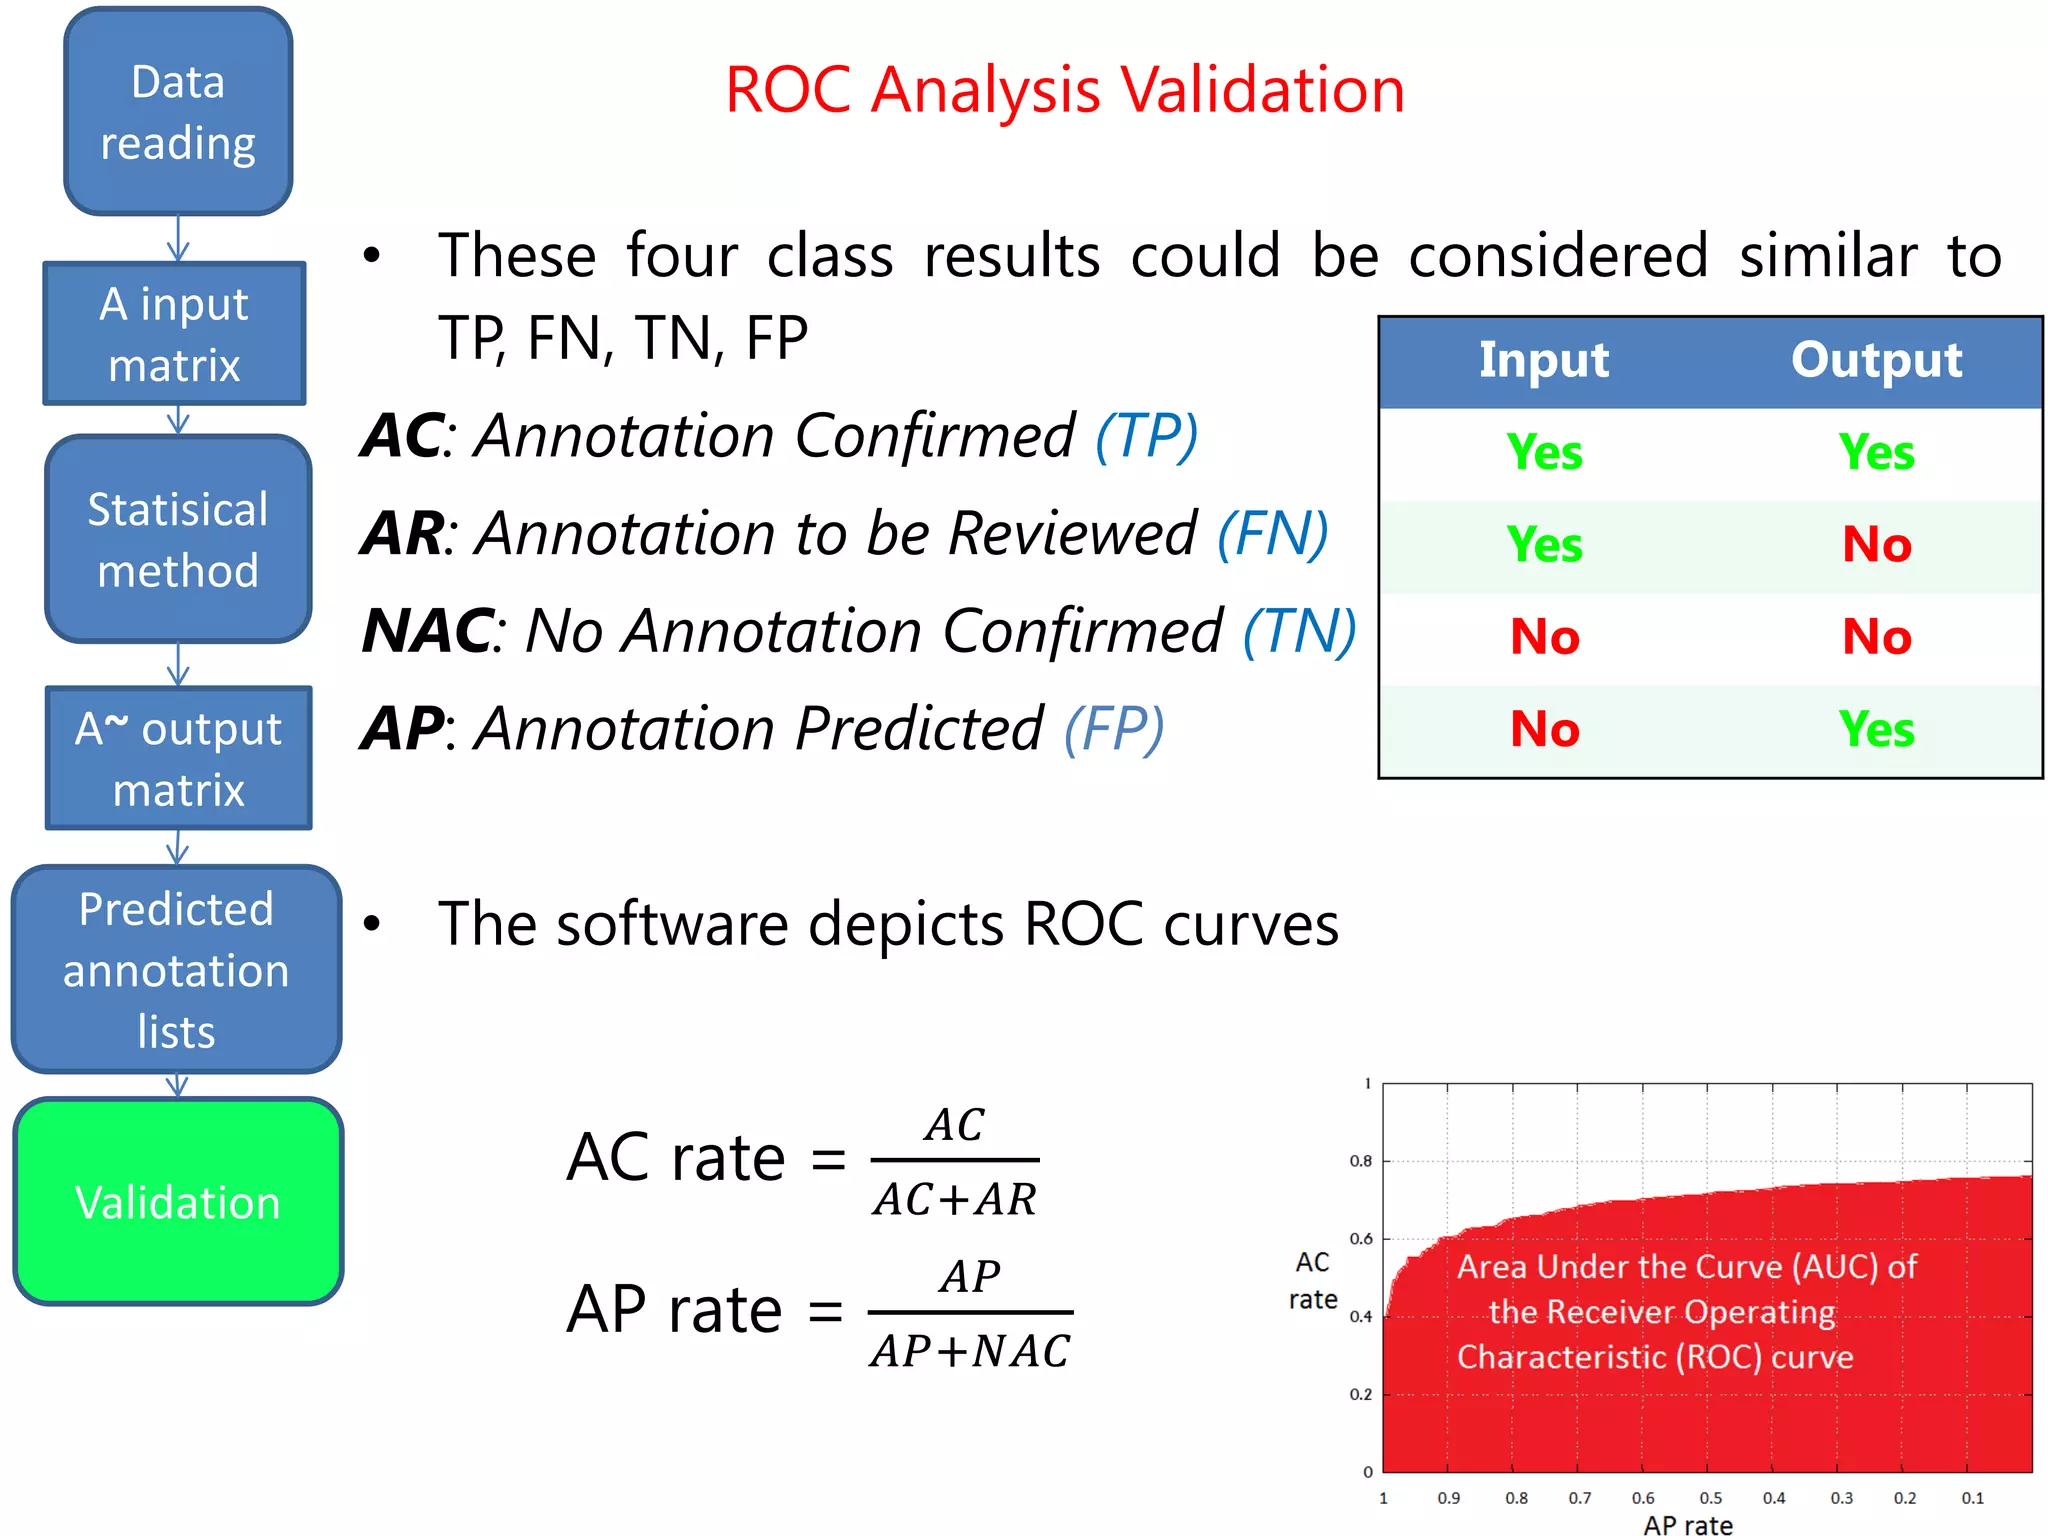
We finally get a list of the most likely predicted
annotations that have the following characteristics:
- predicted by all the three methods tSVD, SIM1,
SIM2
- prediction ranking in the first 50% of the list
- having at least one validated parent.
output
Predicted
annotation
lists
Gene symbol Feature term
PPME1 Organelle organization. [BP]
CHST14 Chondroitin sulfate proteoglycan biosynthetic process. [BP]
CHST14 Biopolymer biosynthetic process. [BP]
ROPN1B Microtubule-based agellum. [CC]
CHST14 Dermatan sulfate proteoglycan biosynthetic process. [BP]
CPA2 Proteolysis involved in cellular protein catabolic process. [BP]
PPME1 Chromosome organization. [BP]
CNOT2 Positive regulation of cellular metabolic process. [BP]
Validation](https://image.slidesharecdn.com/davidechiccobozza2014-03-20h0839-140320073943-phpapp02/75/Doctoral-Thesis-Dissertation-2014-03-20-PoliMi-37-2048.jpg)
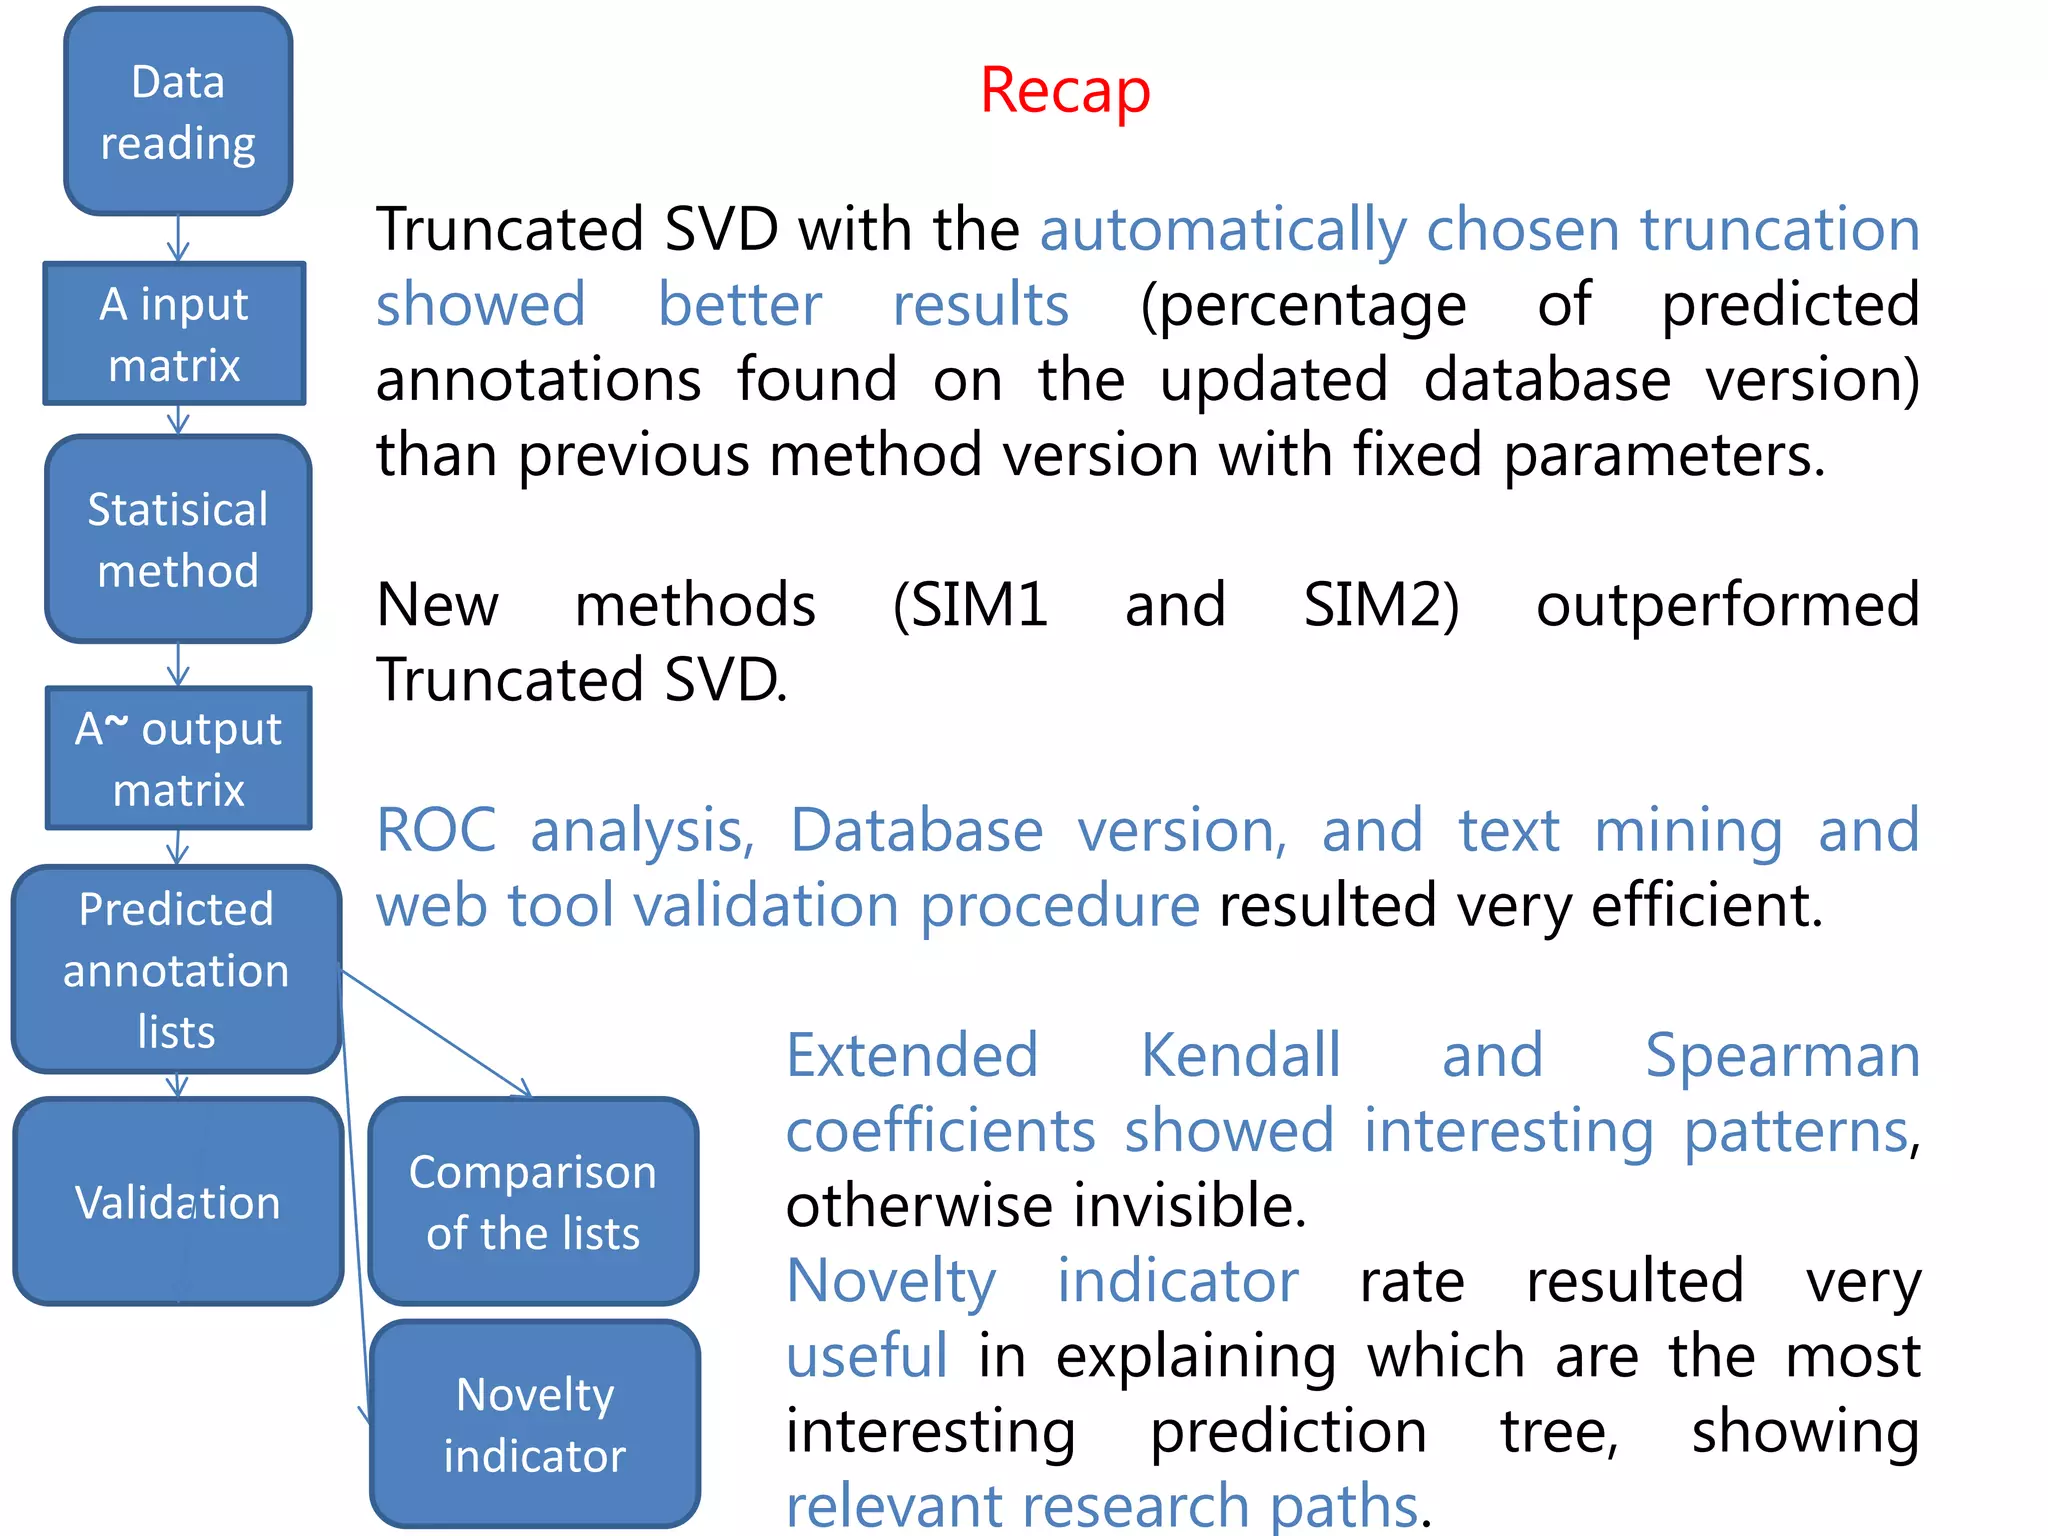
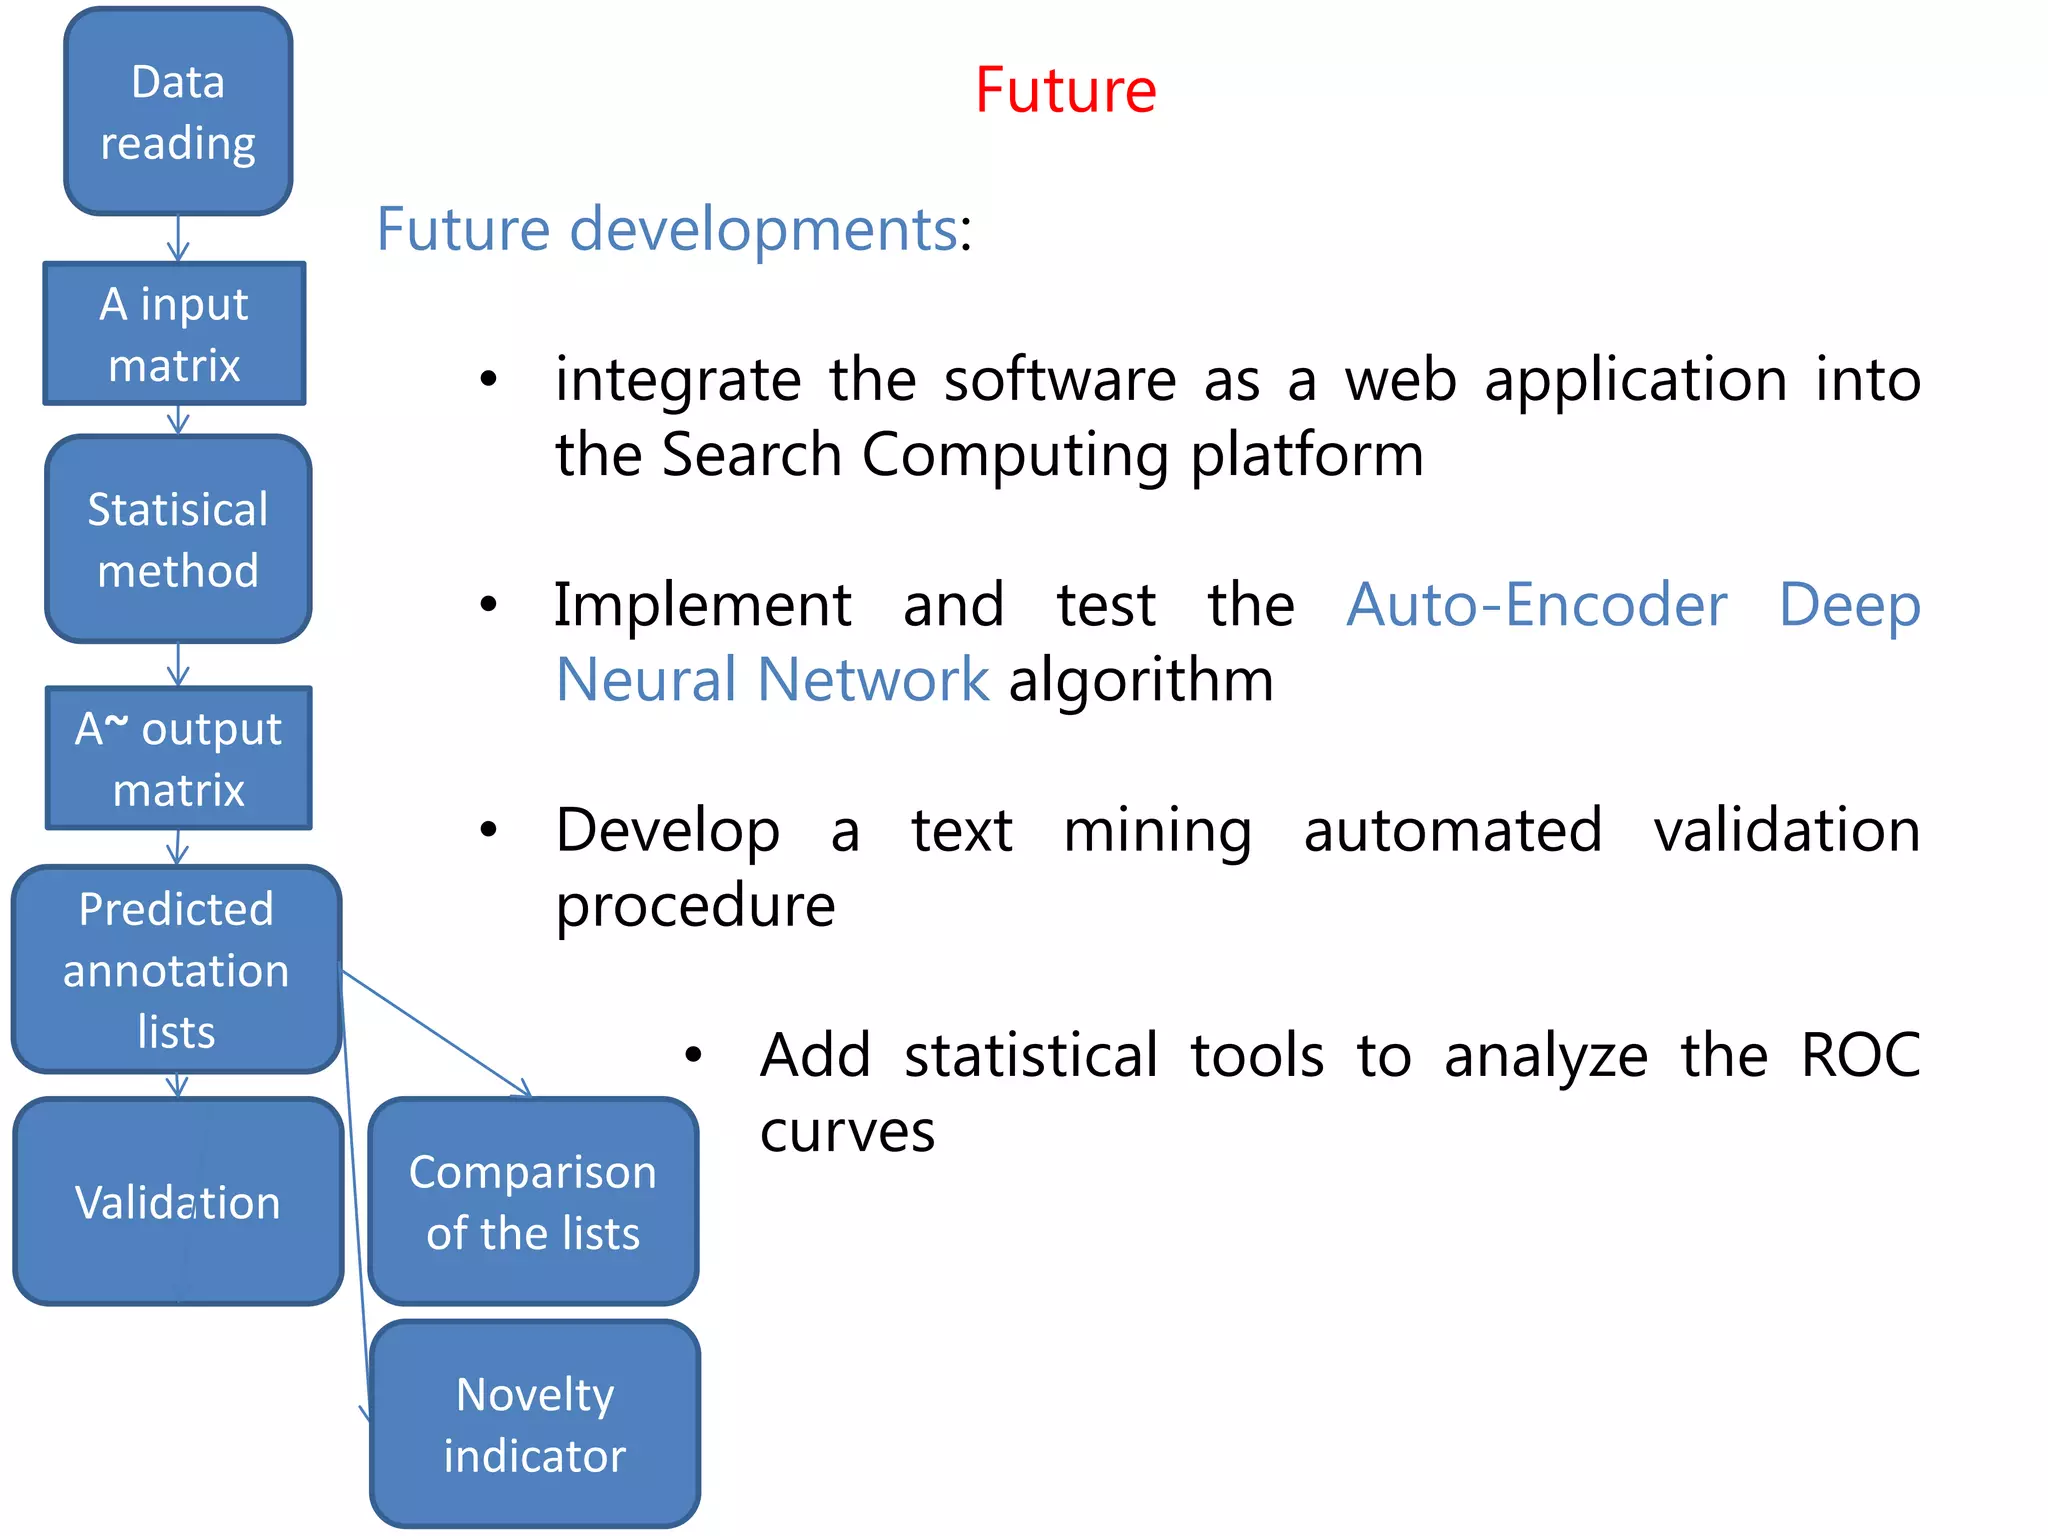

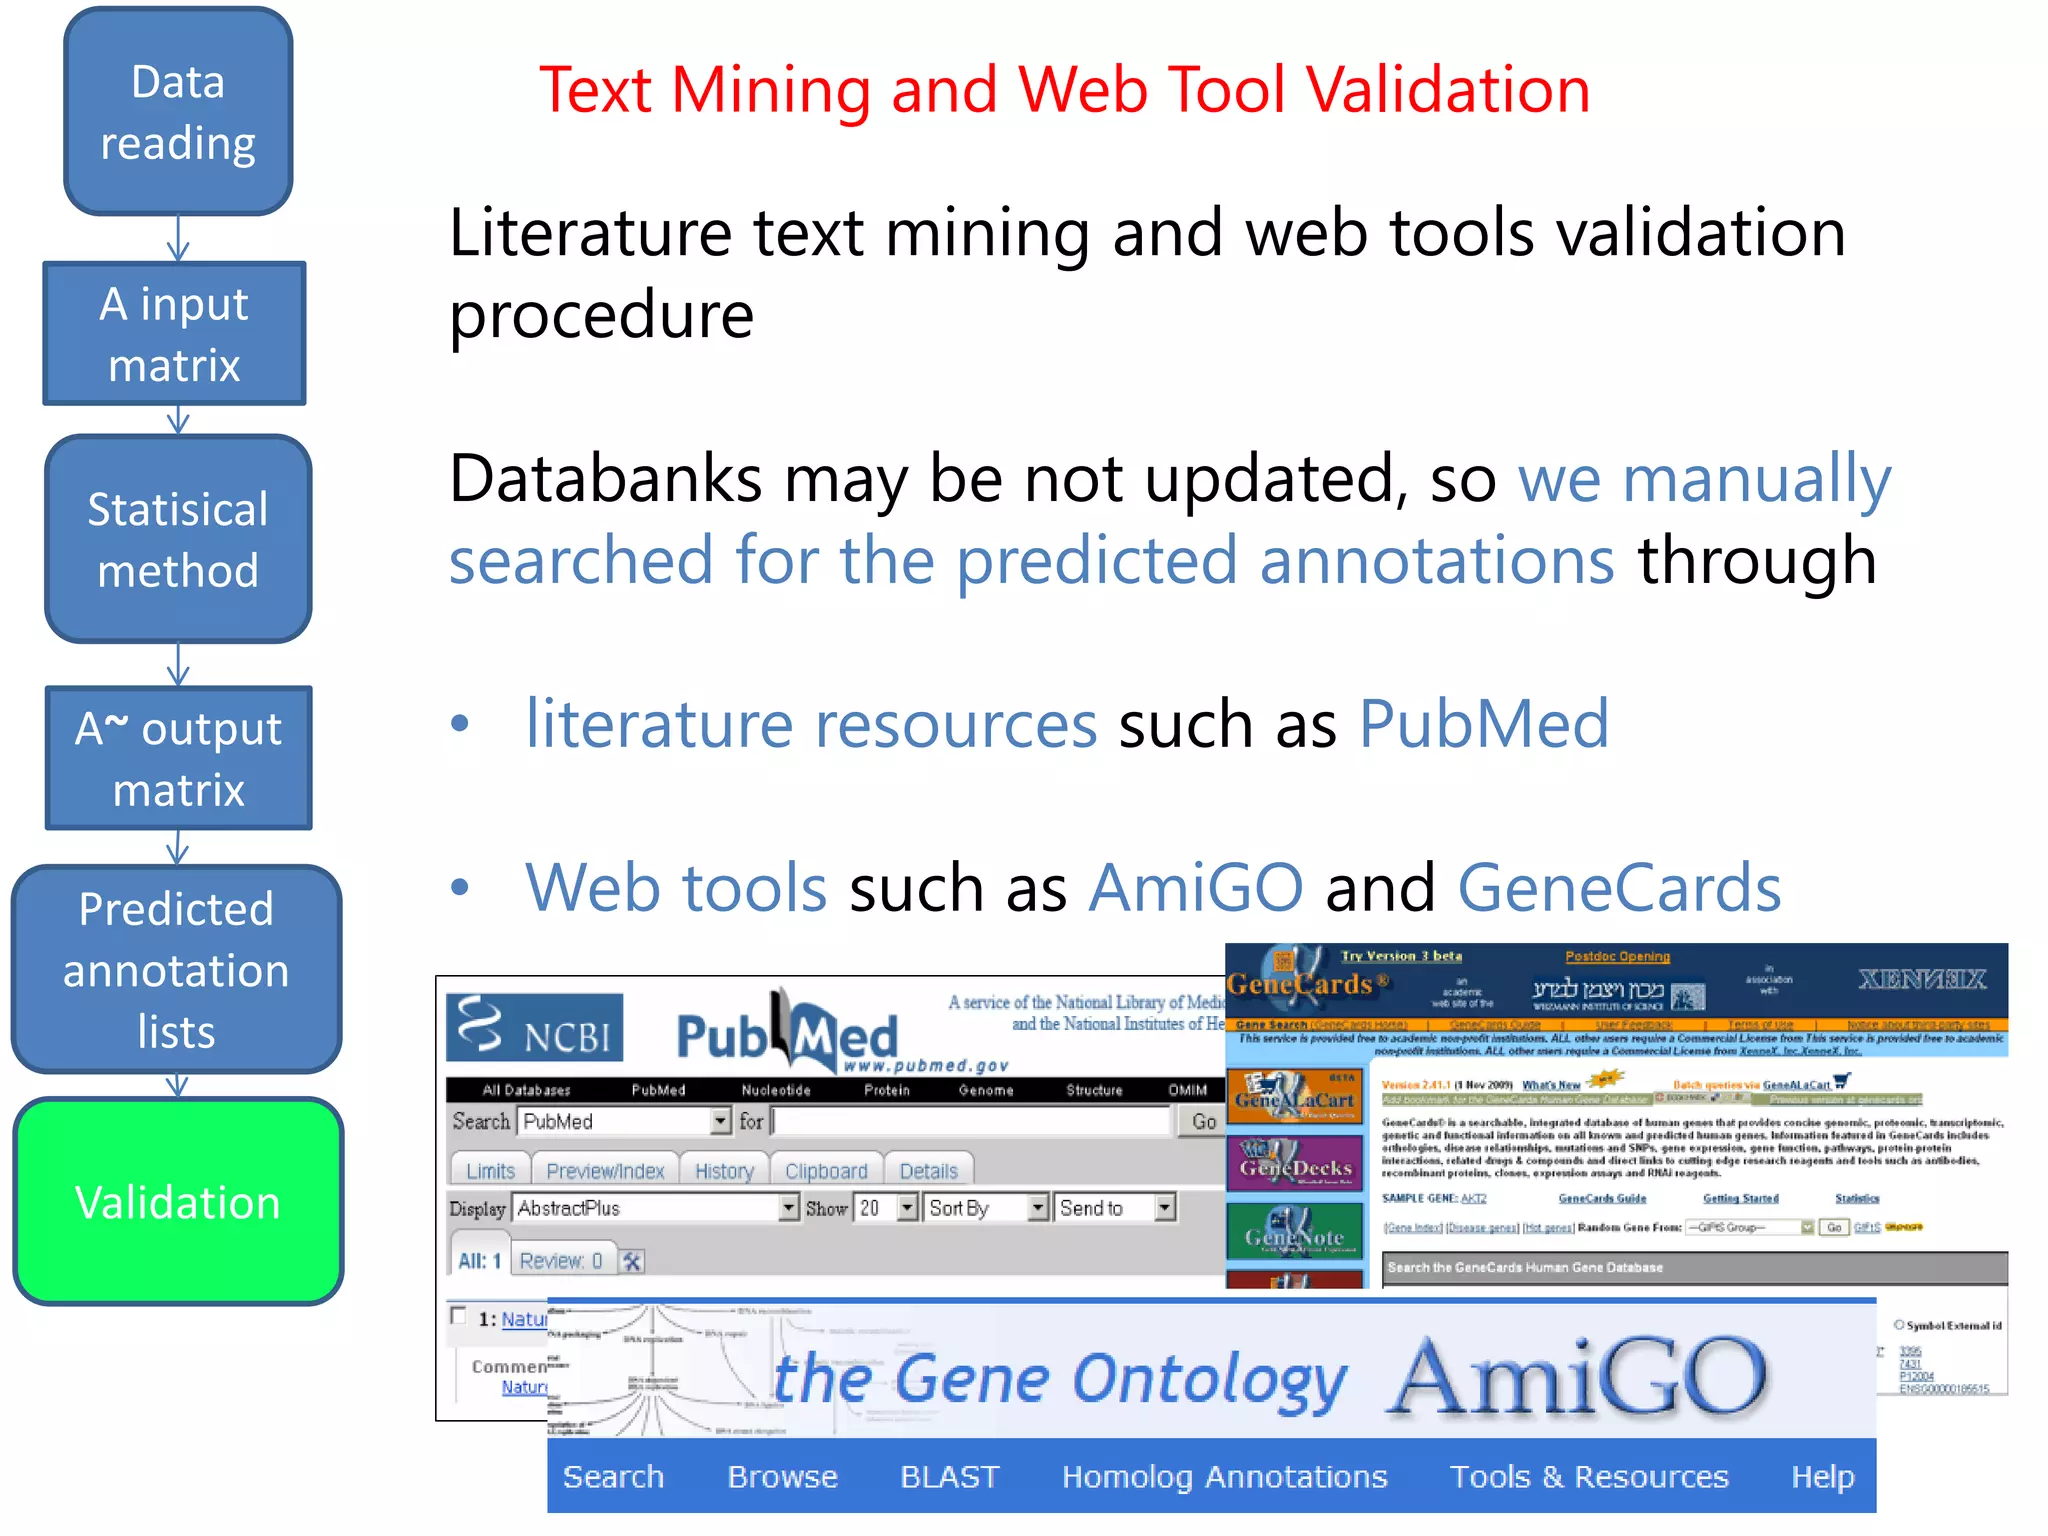
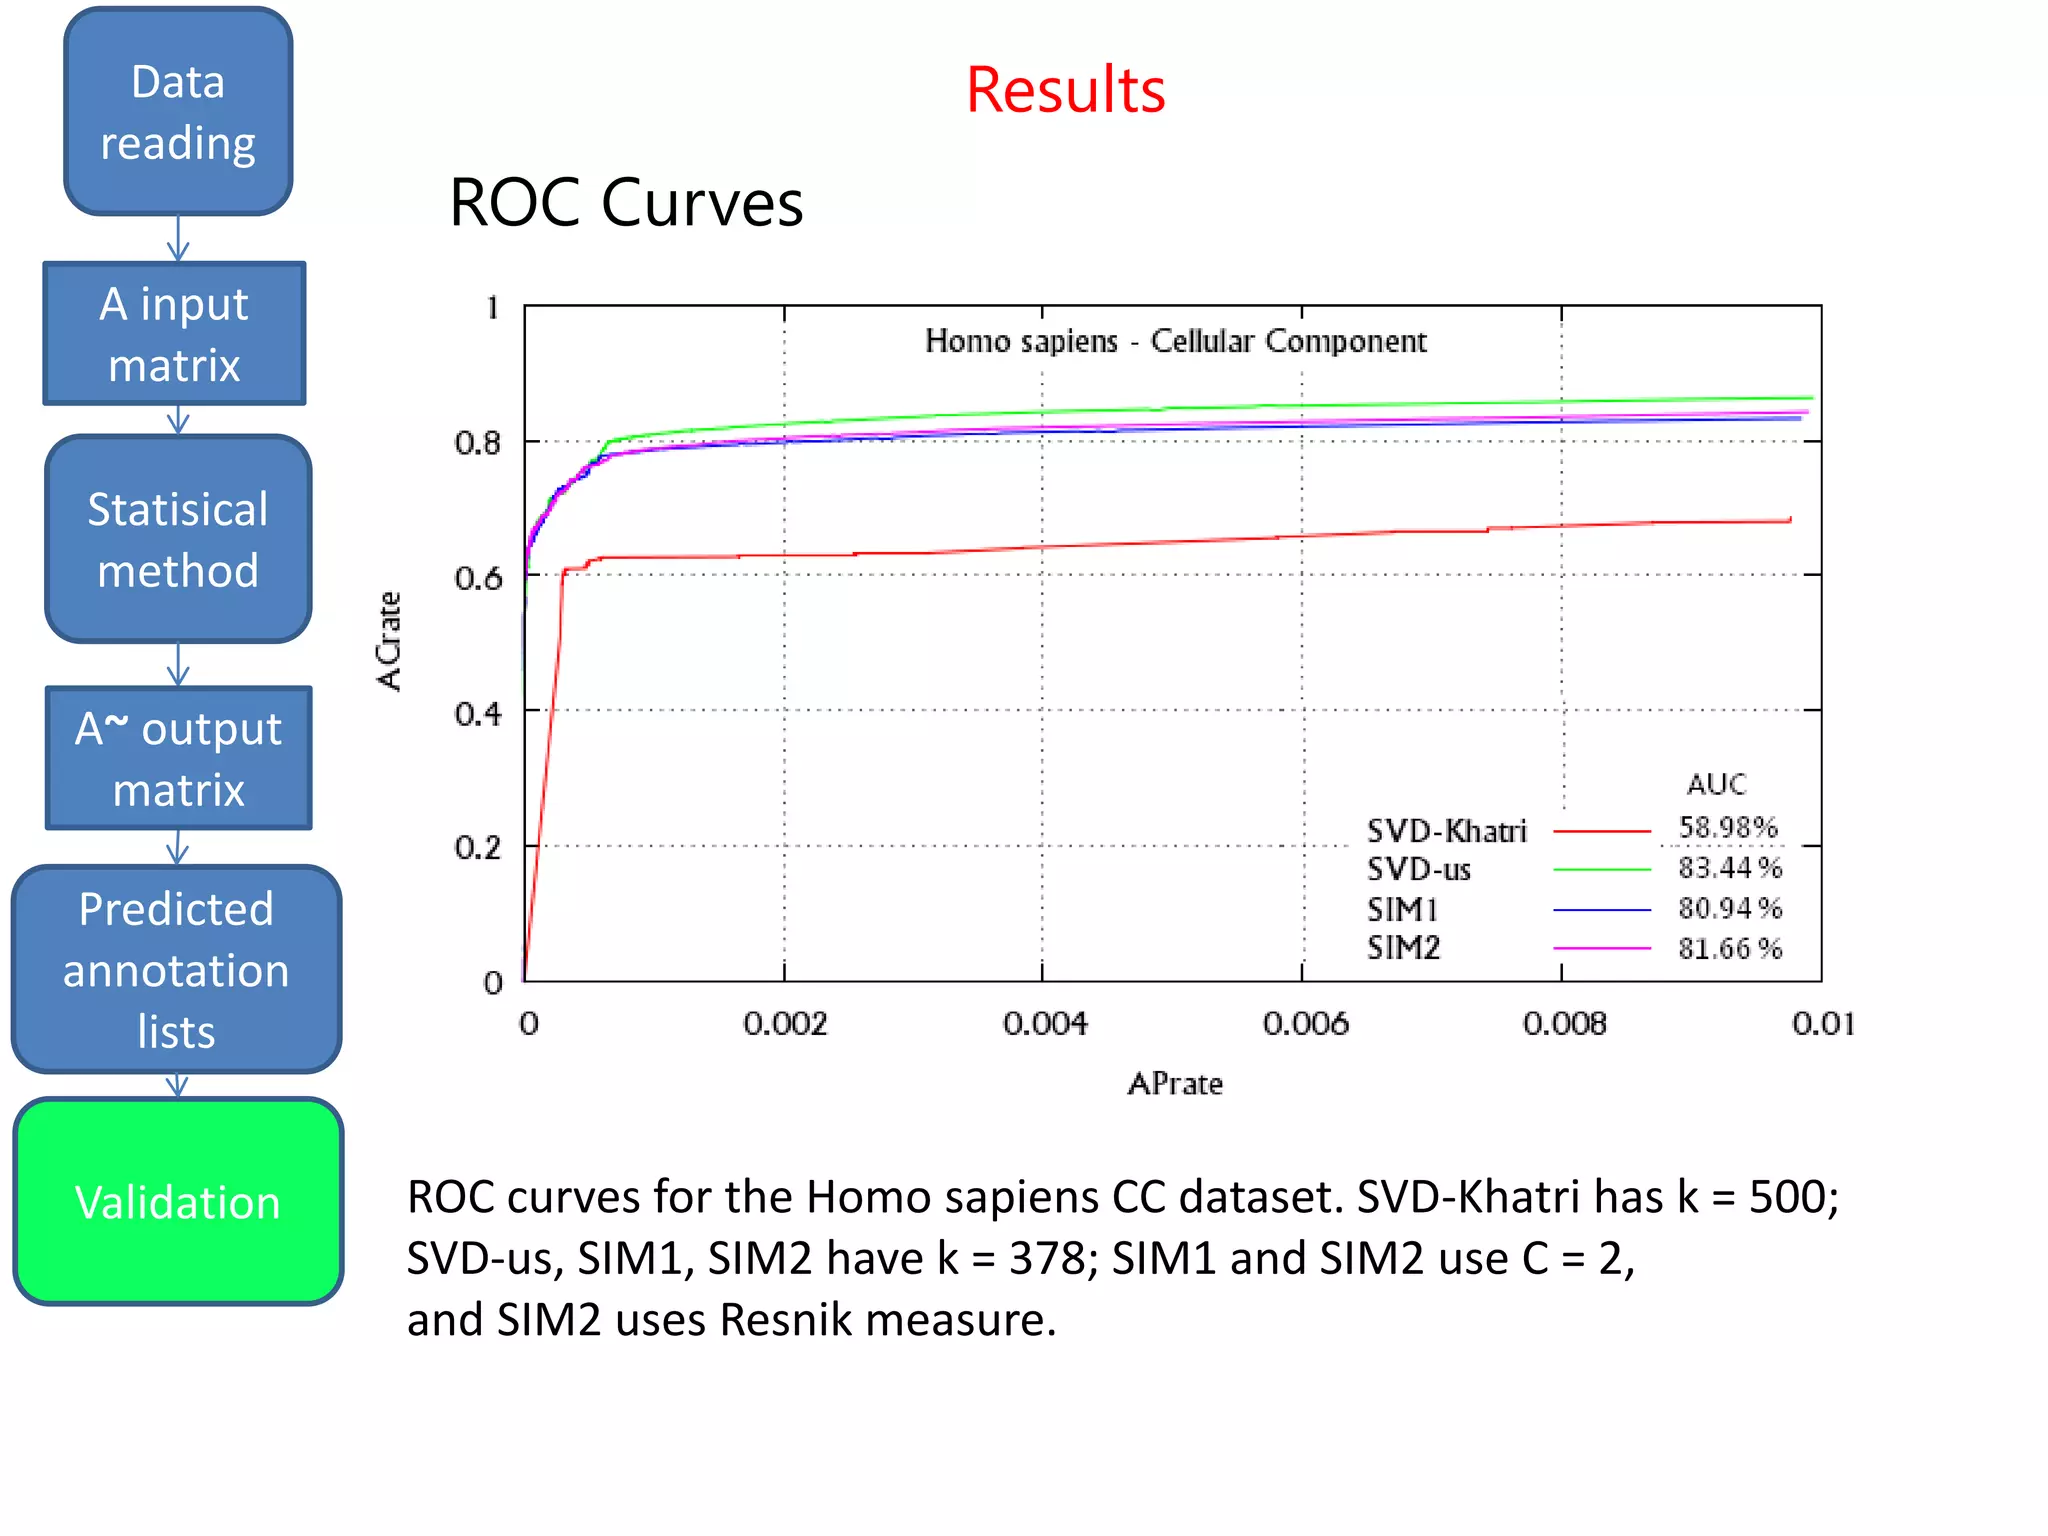
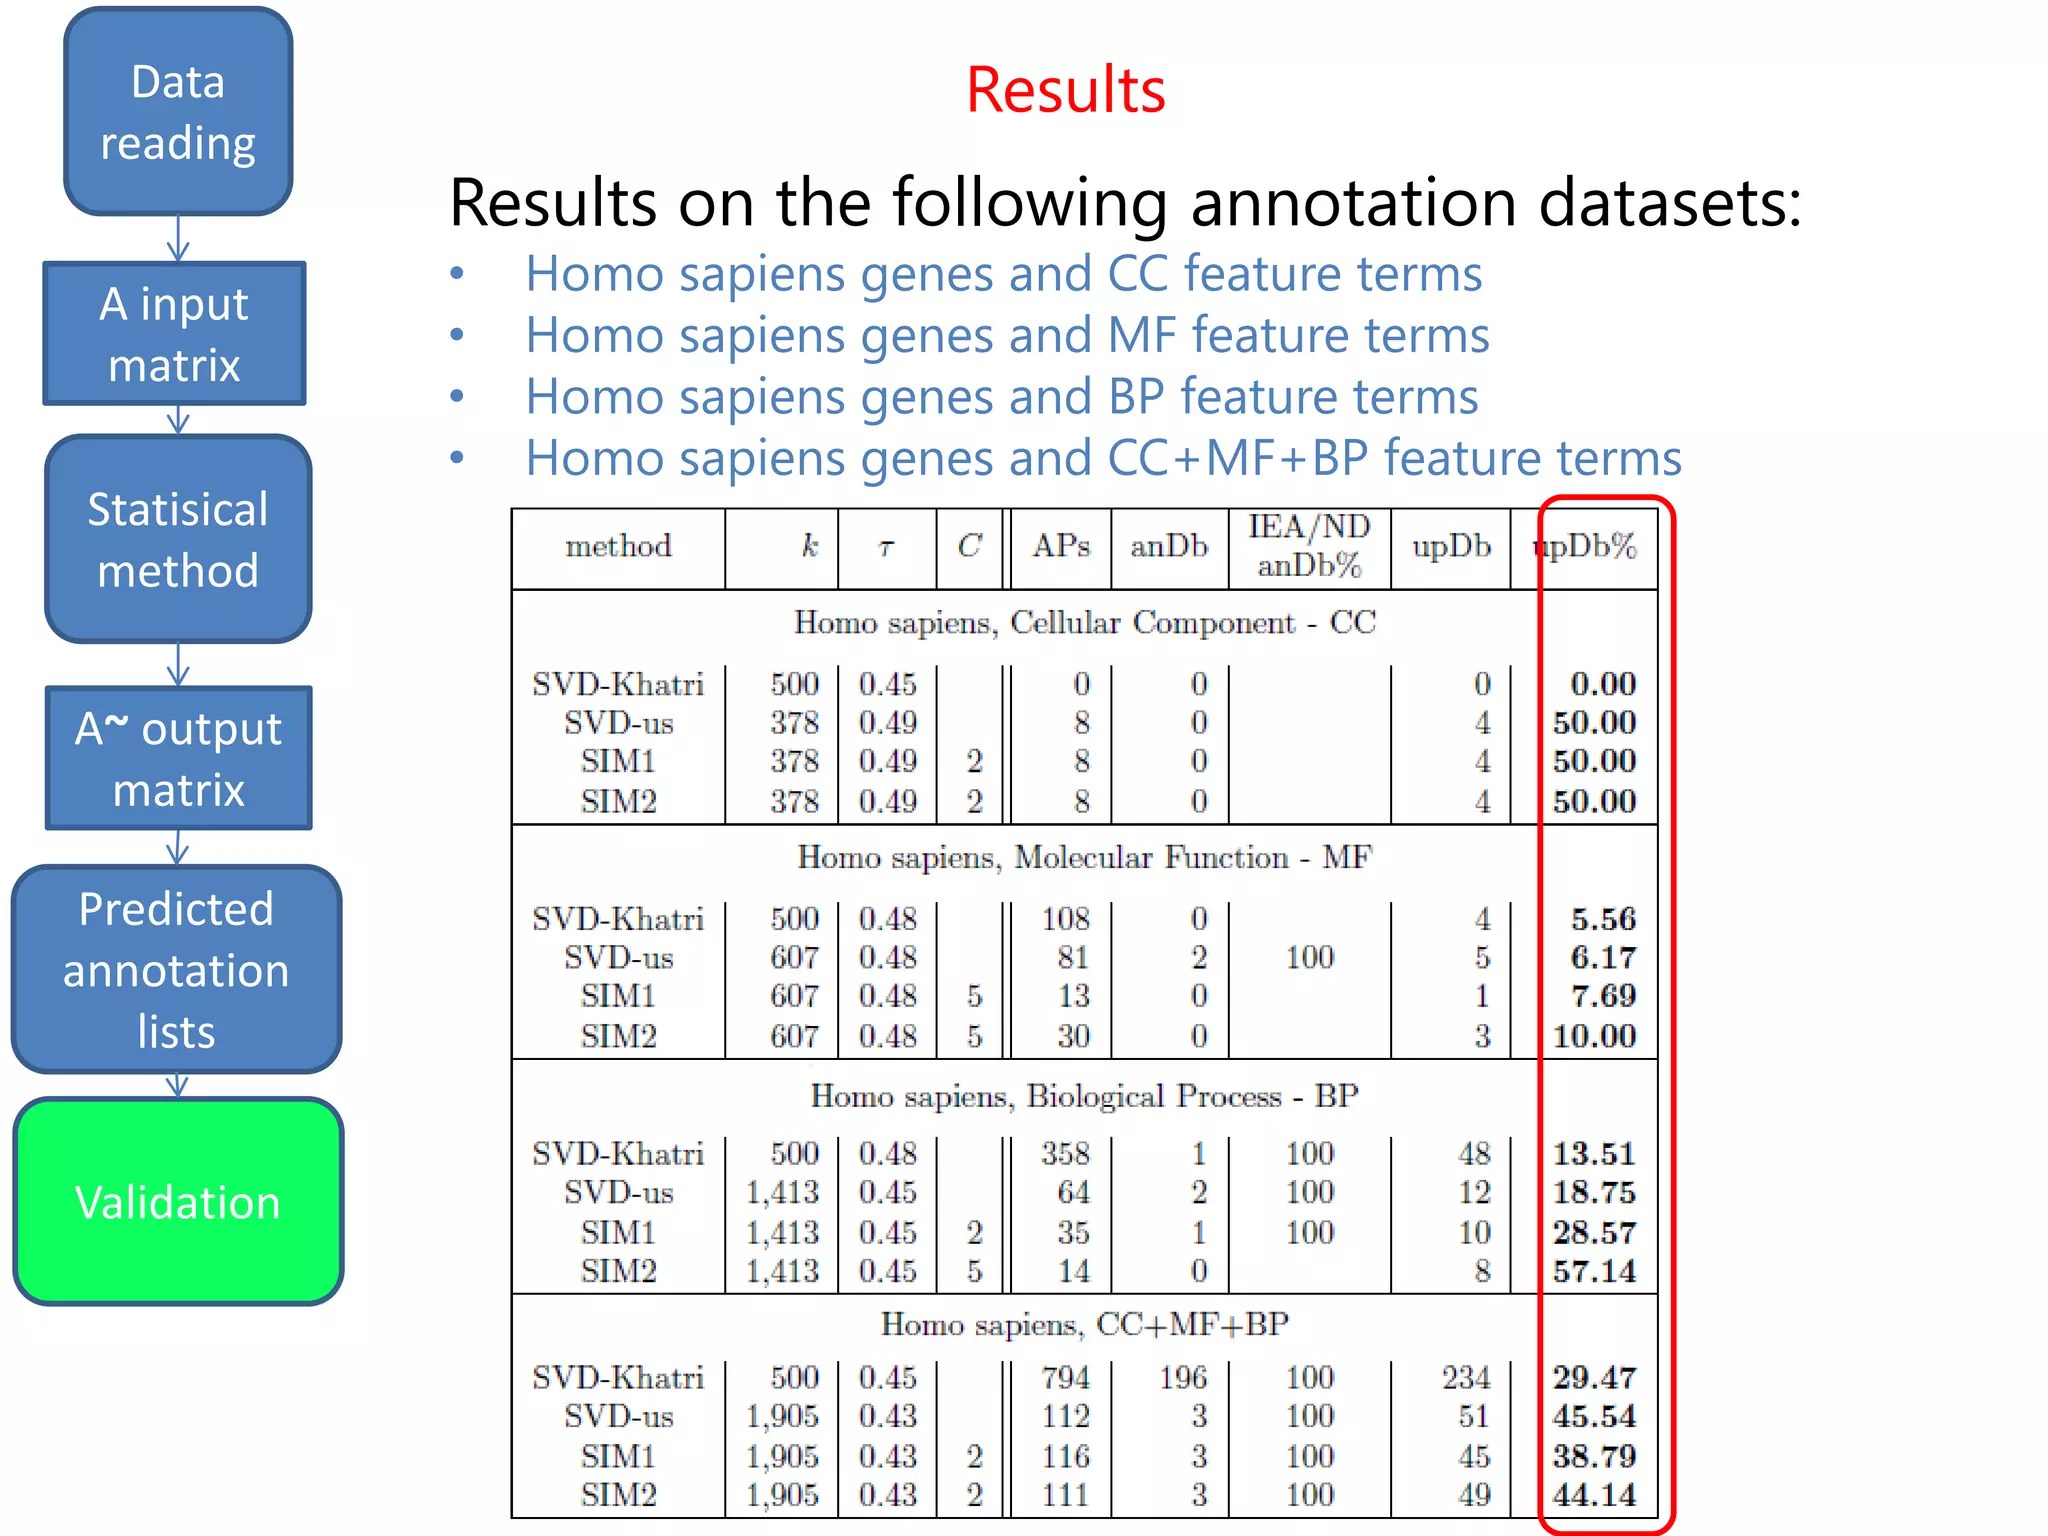
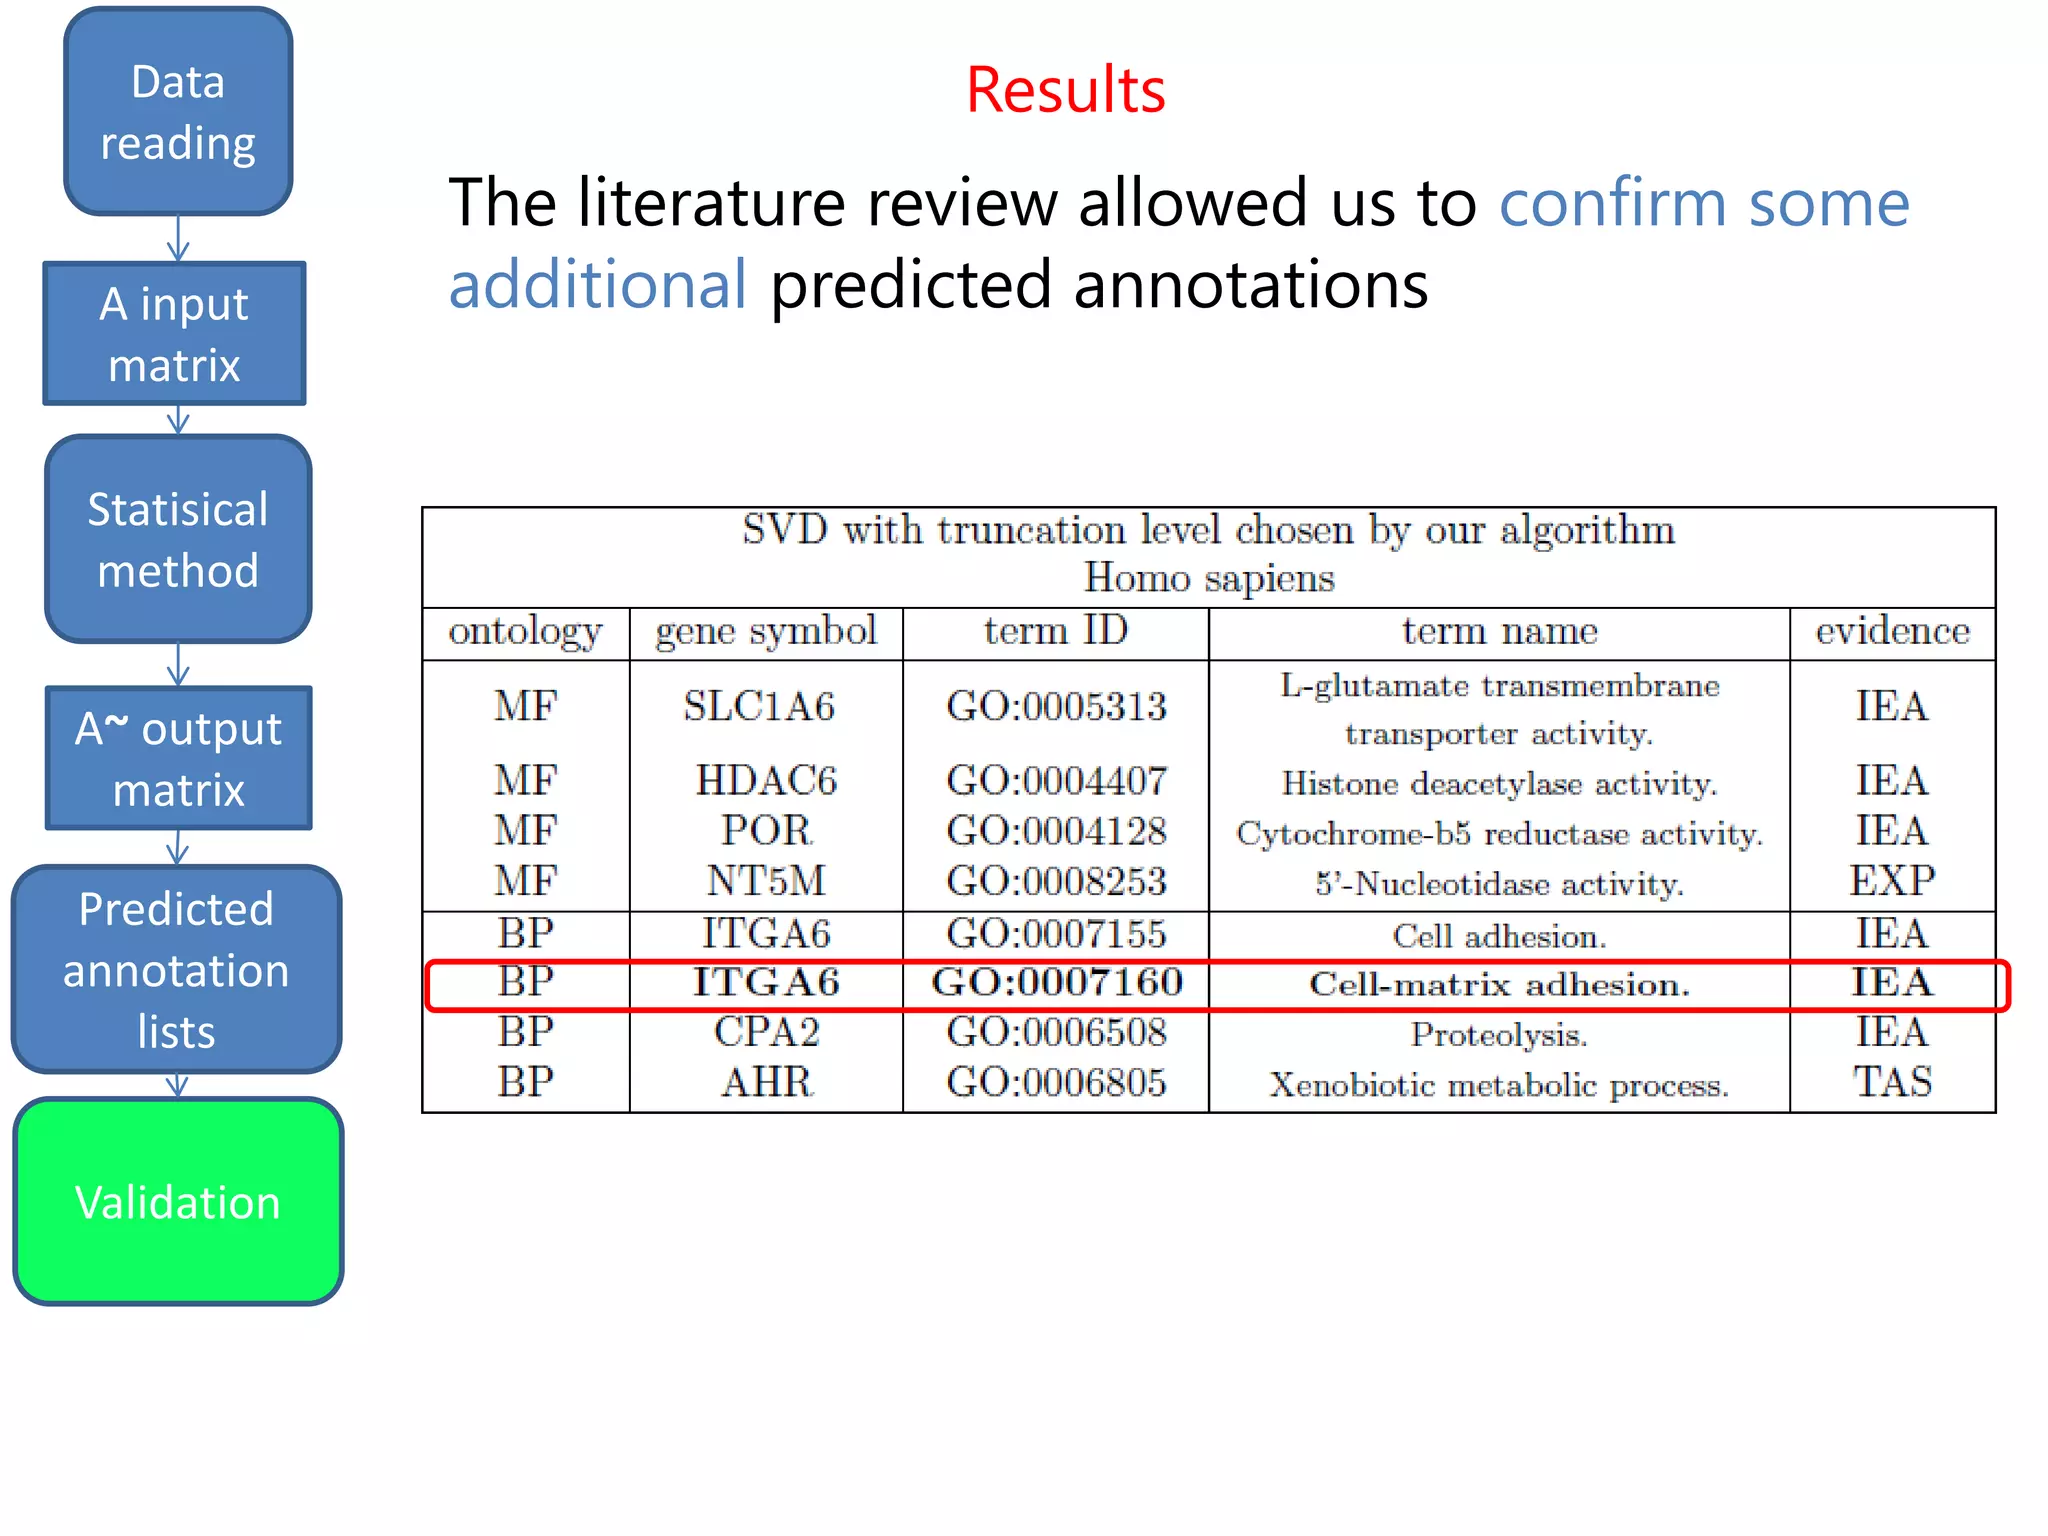
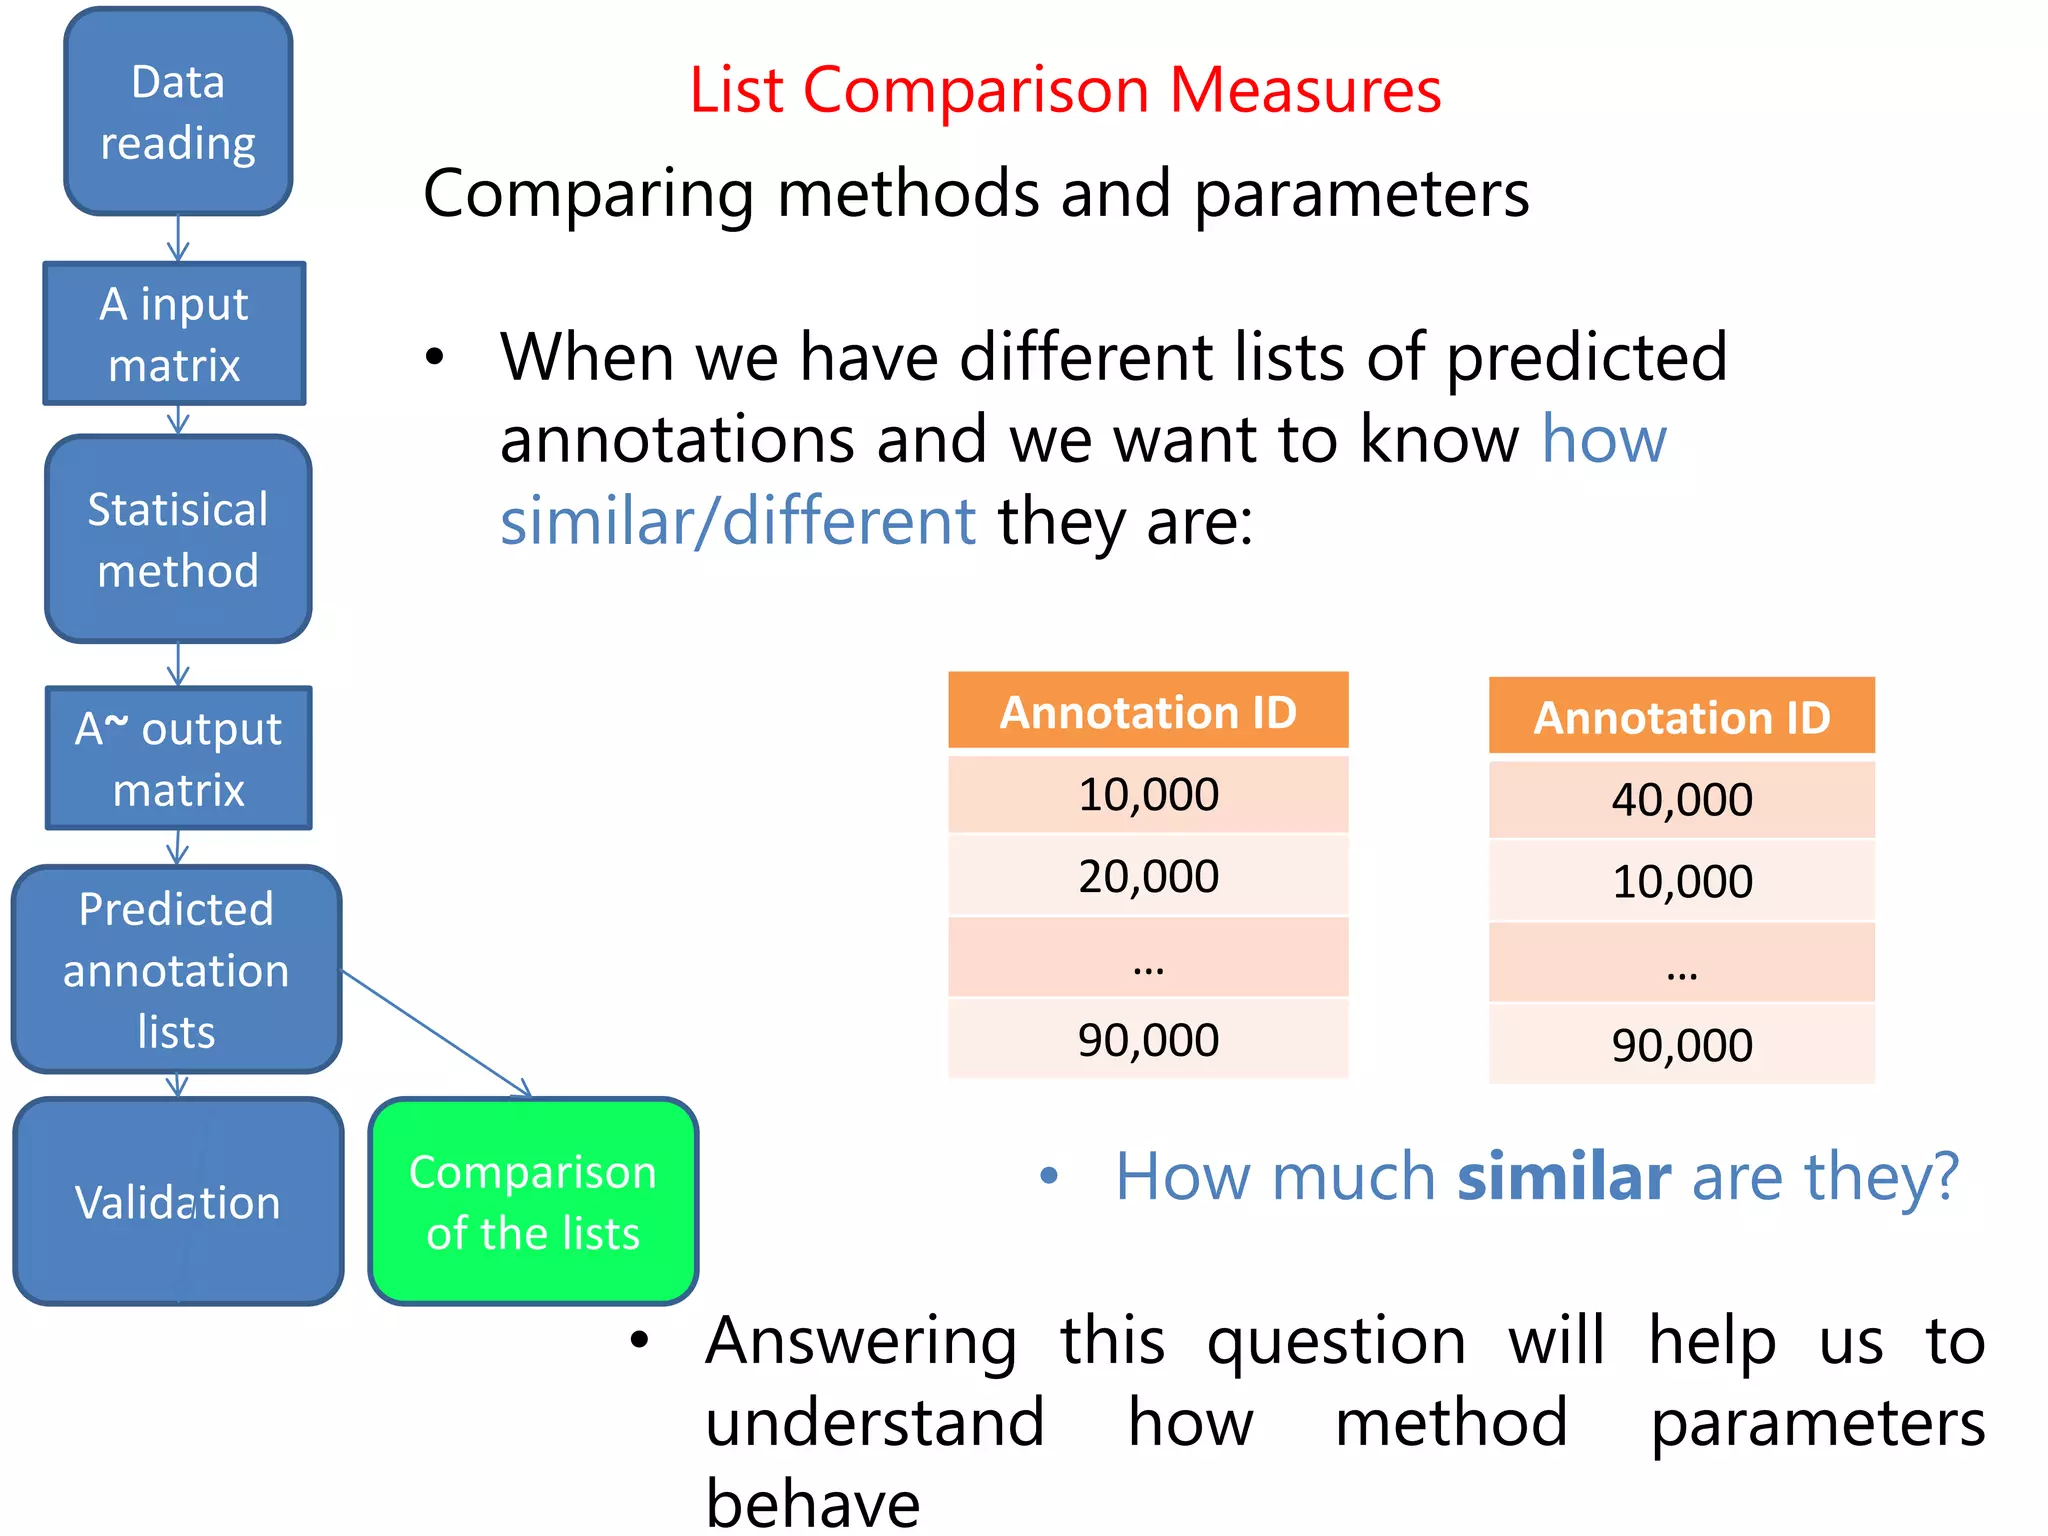
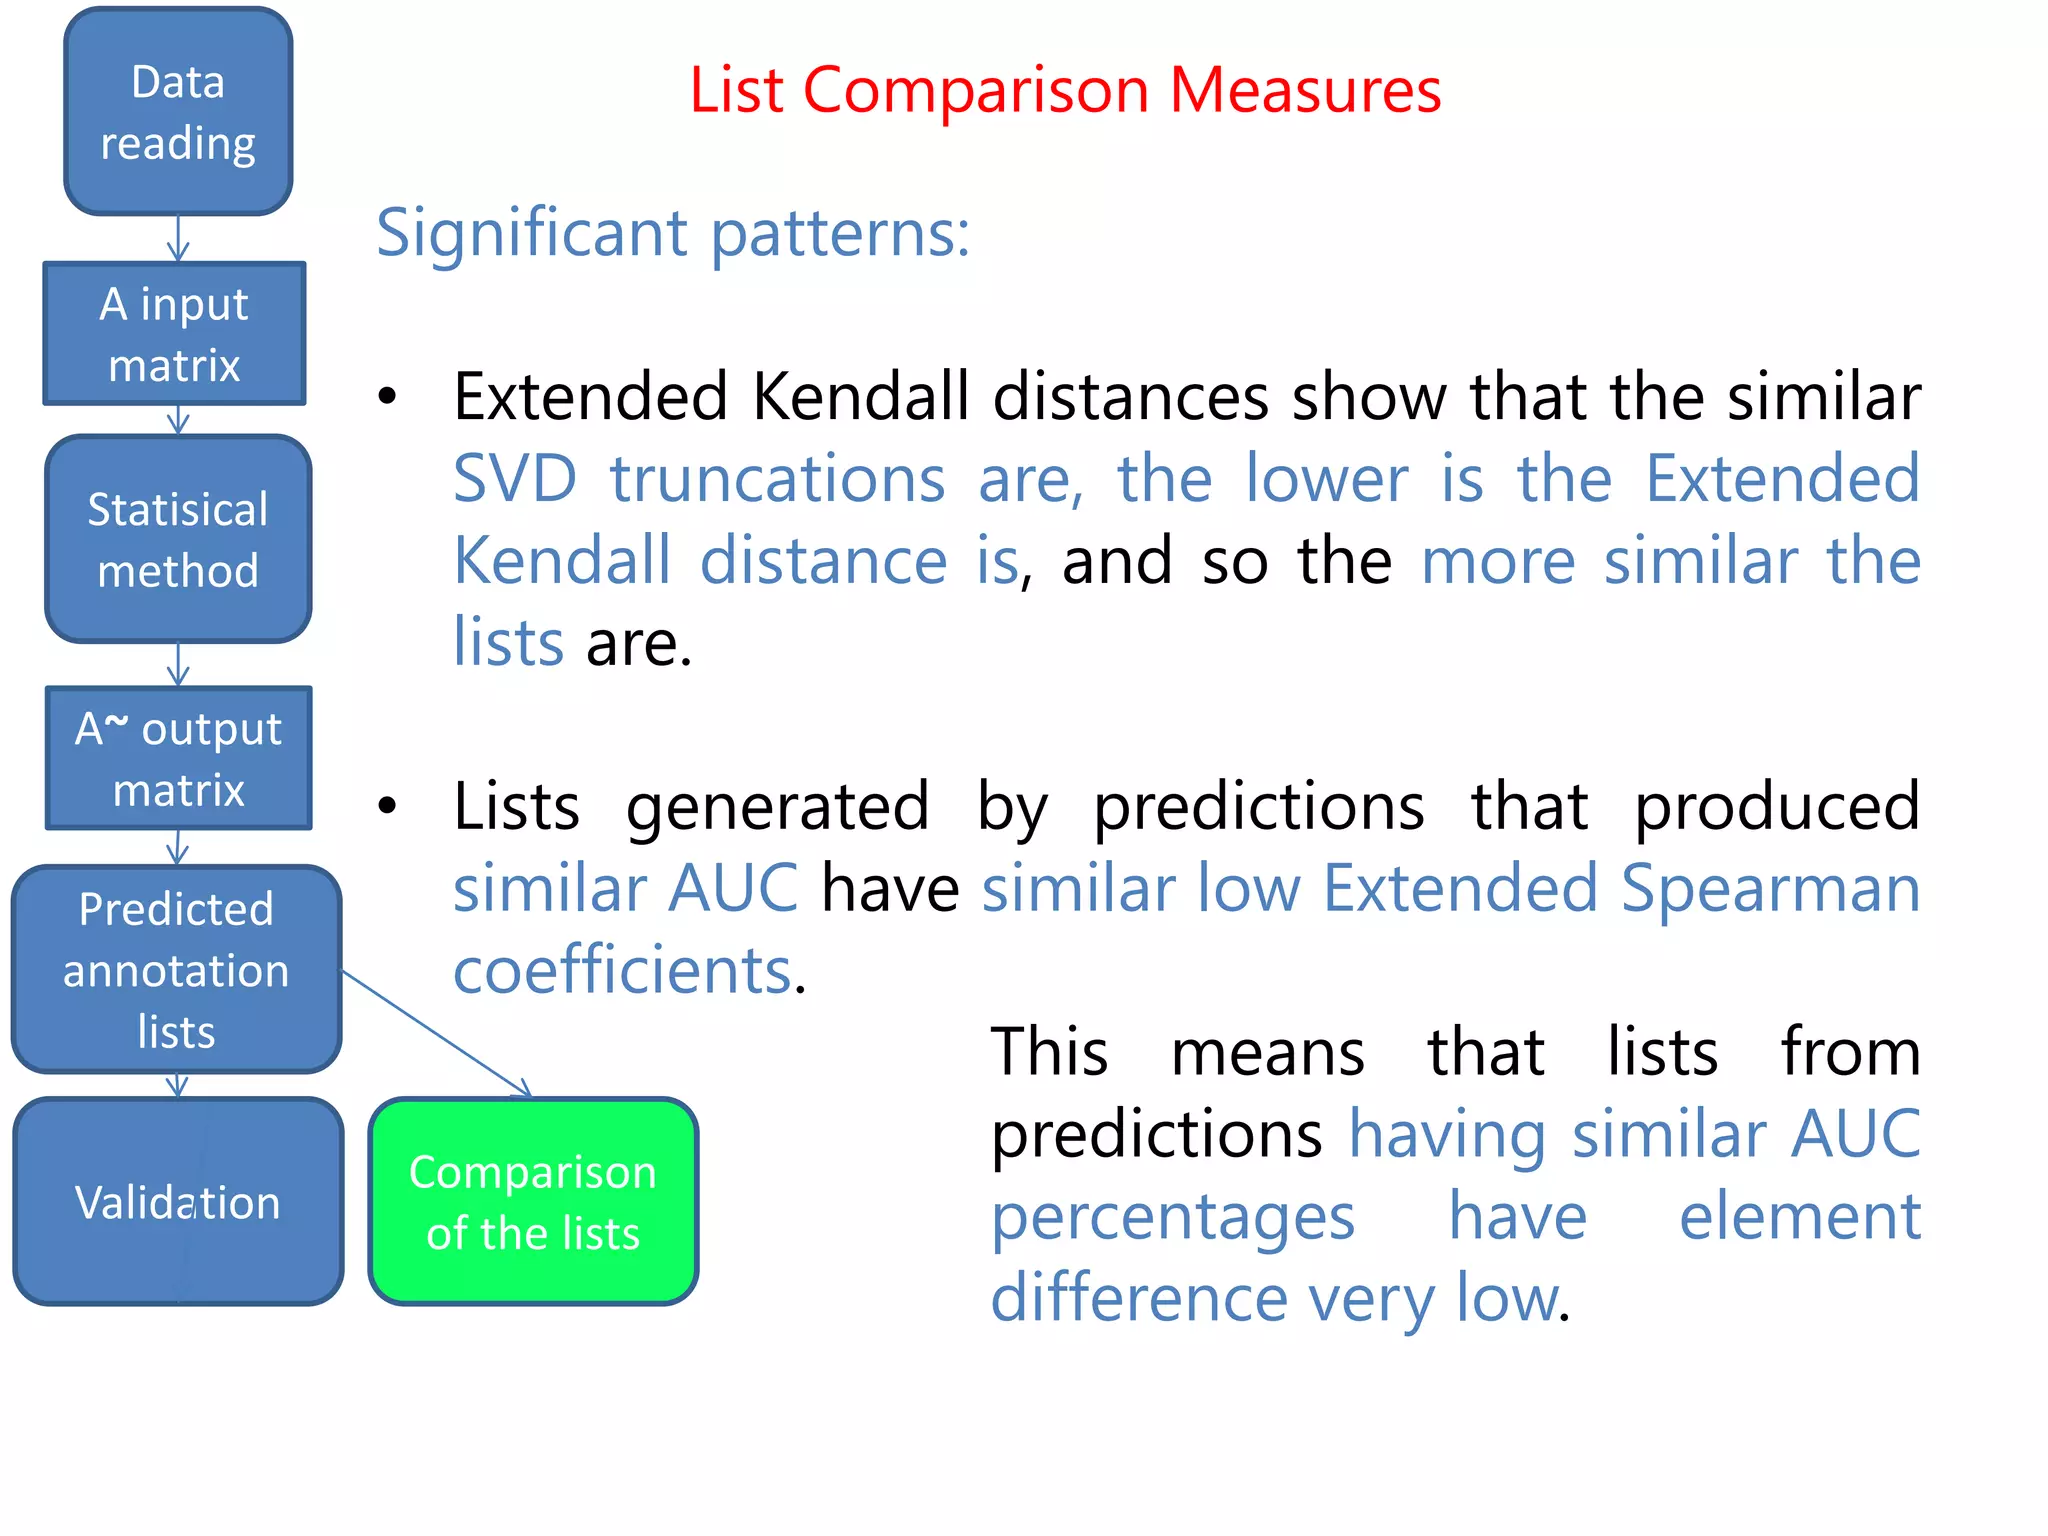
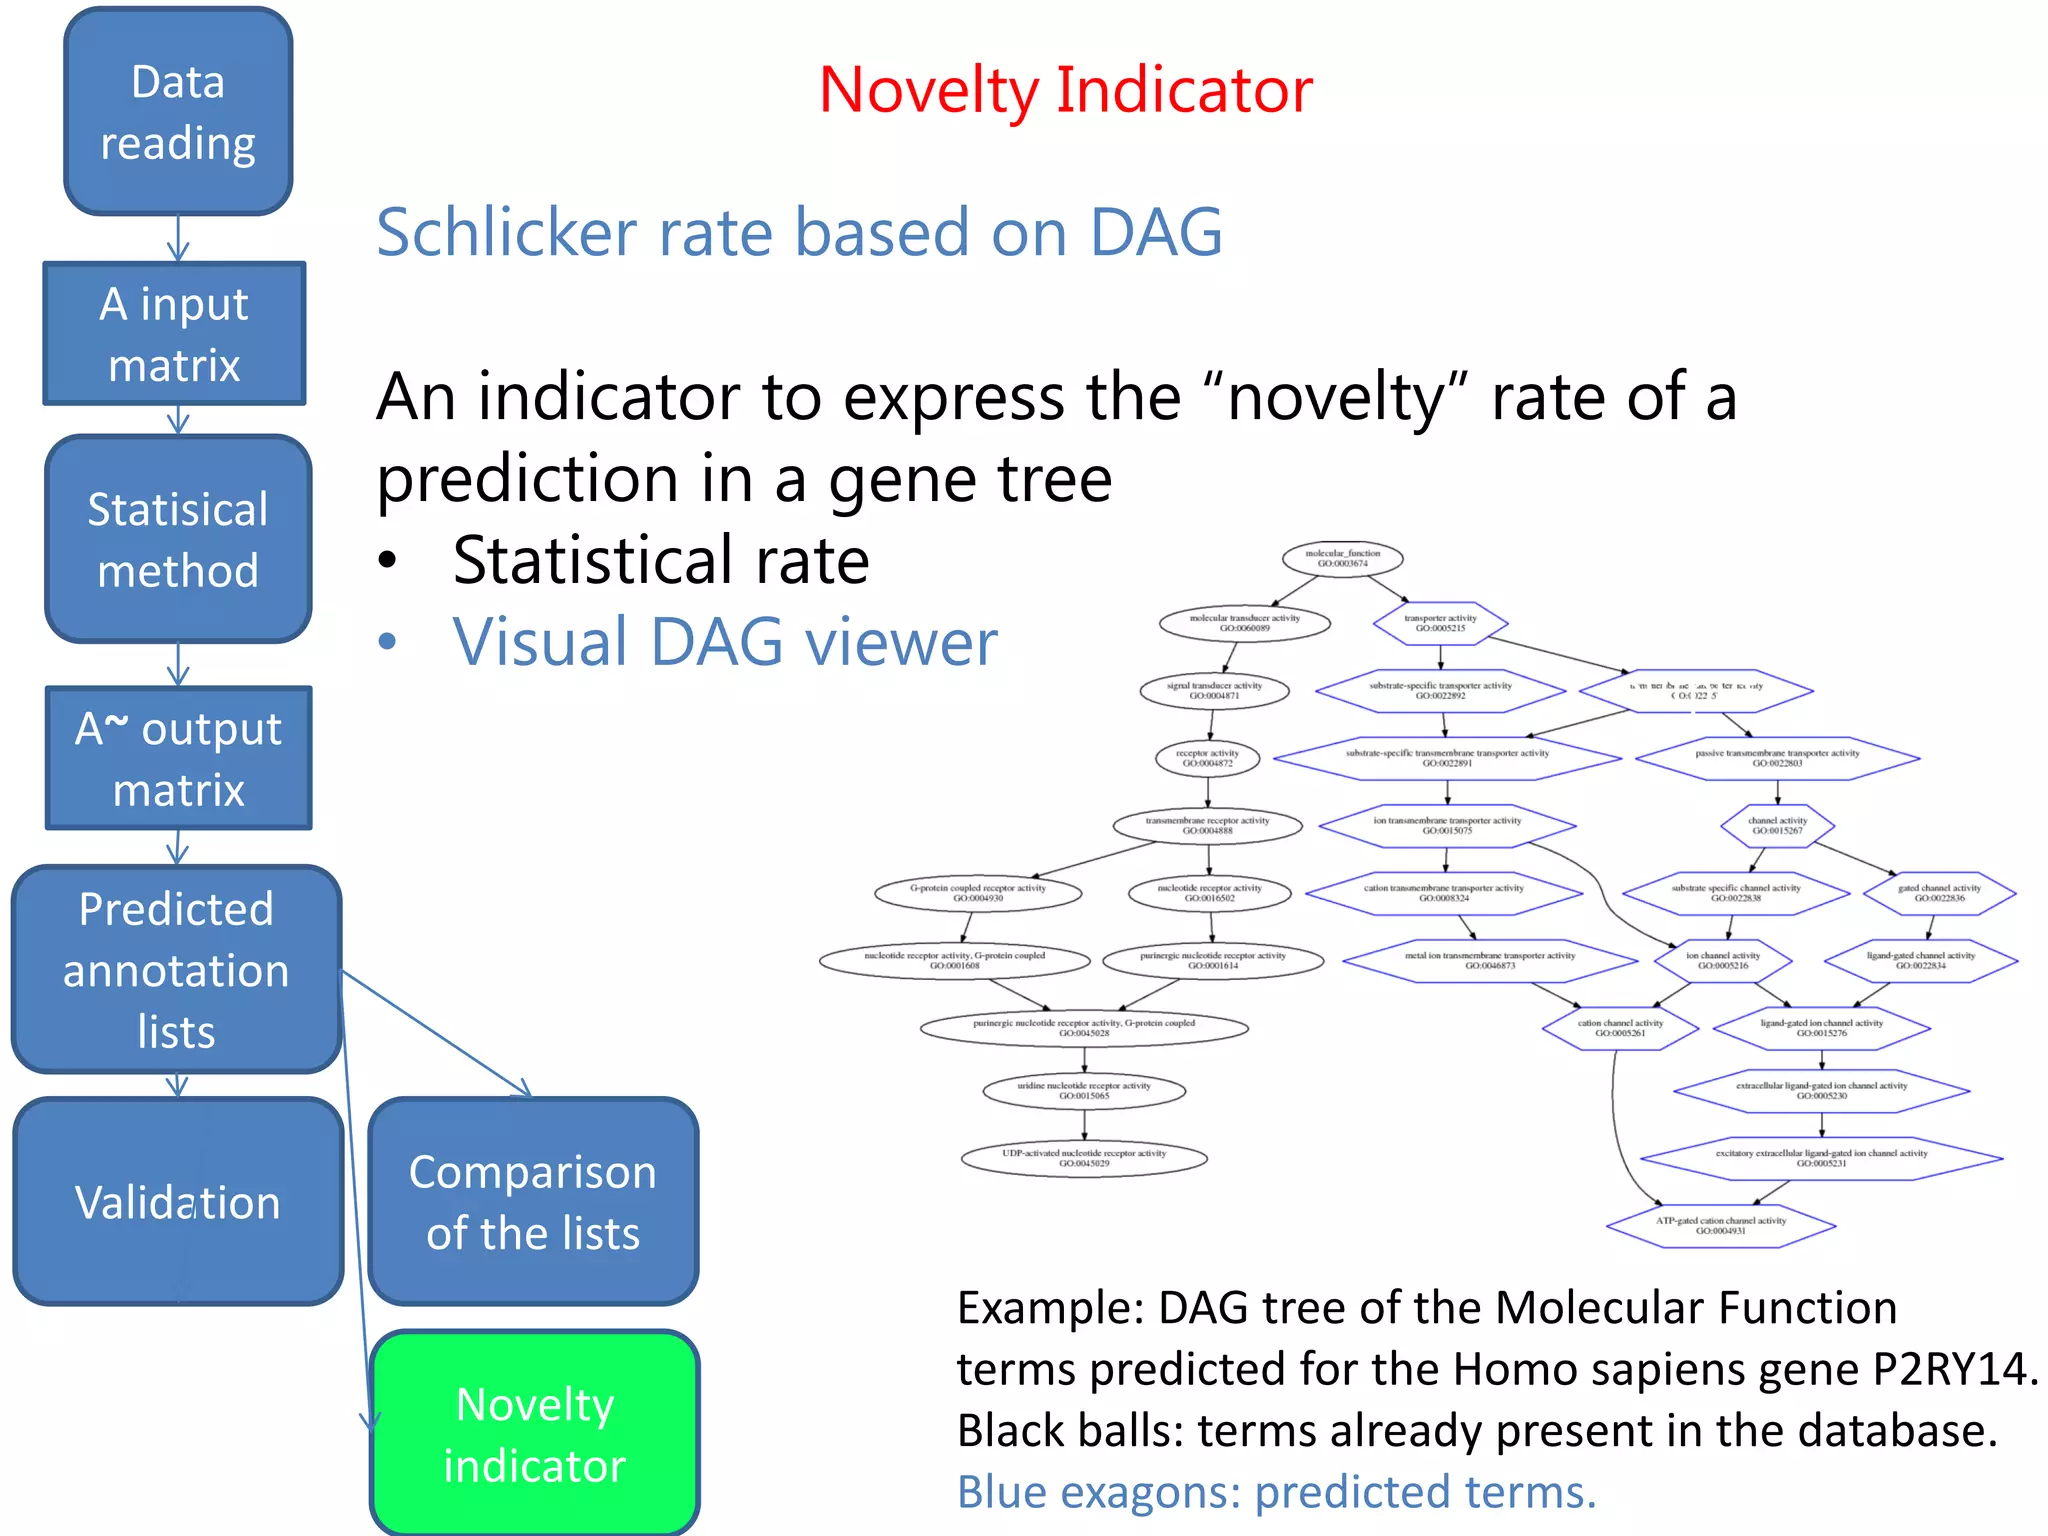
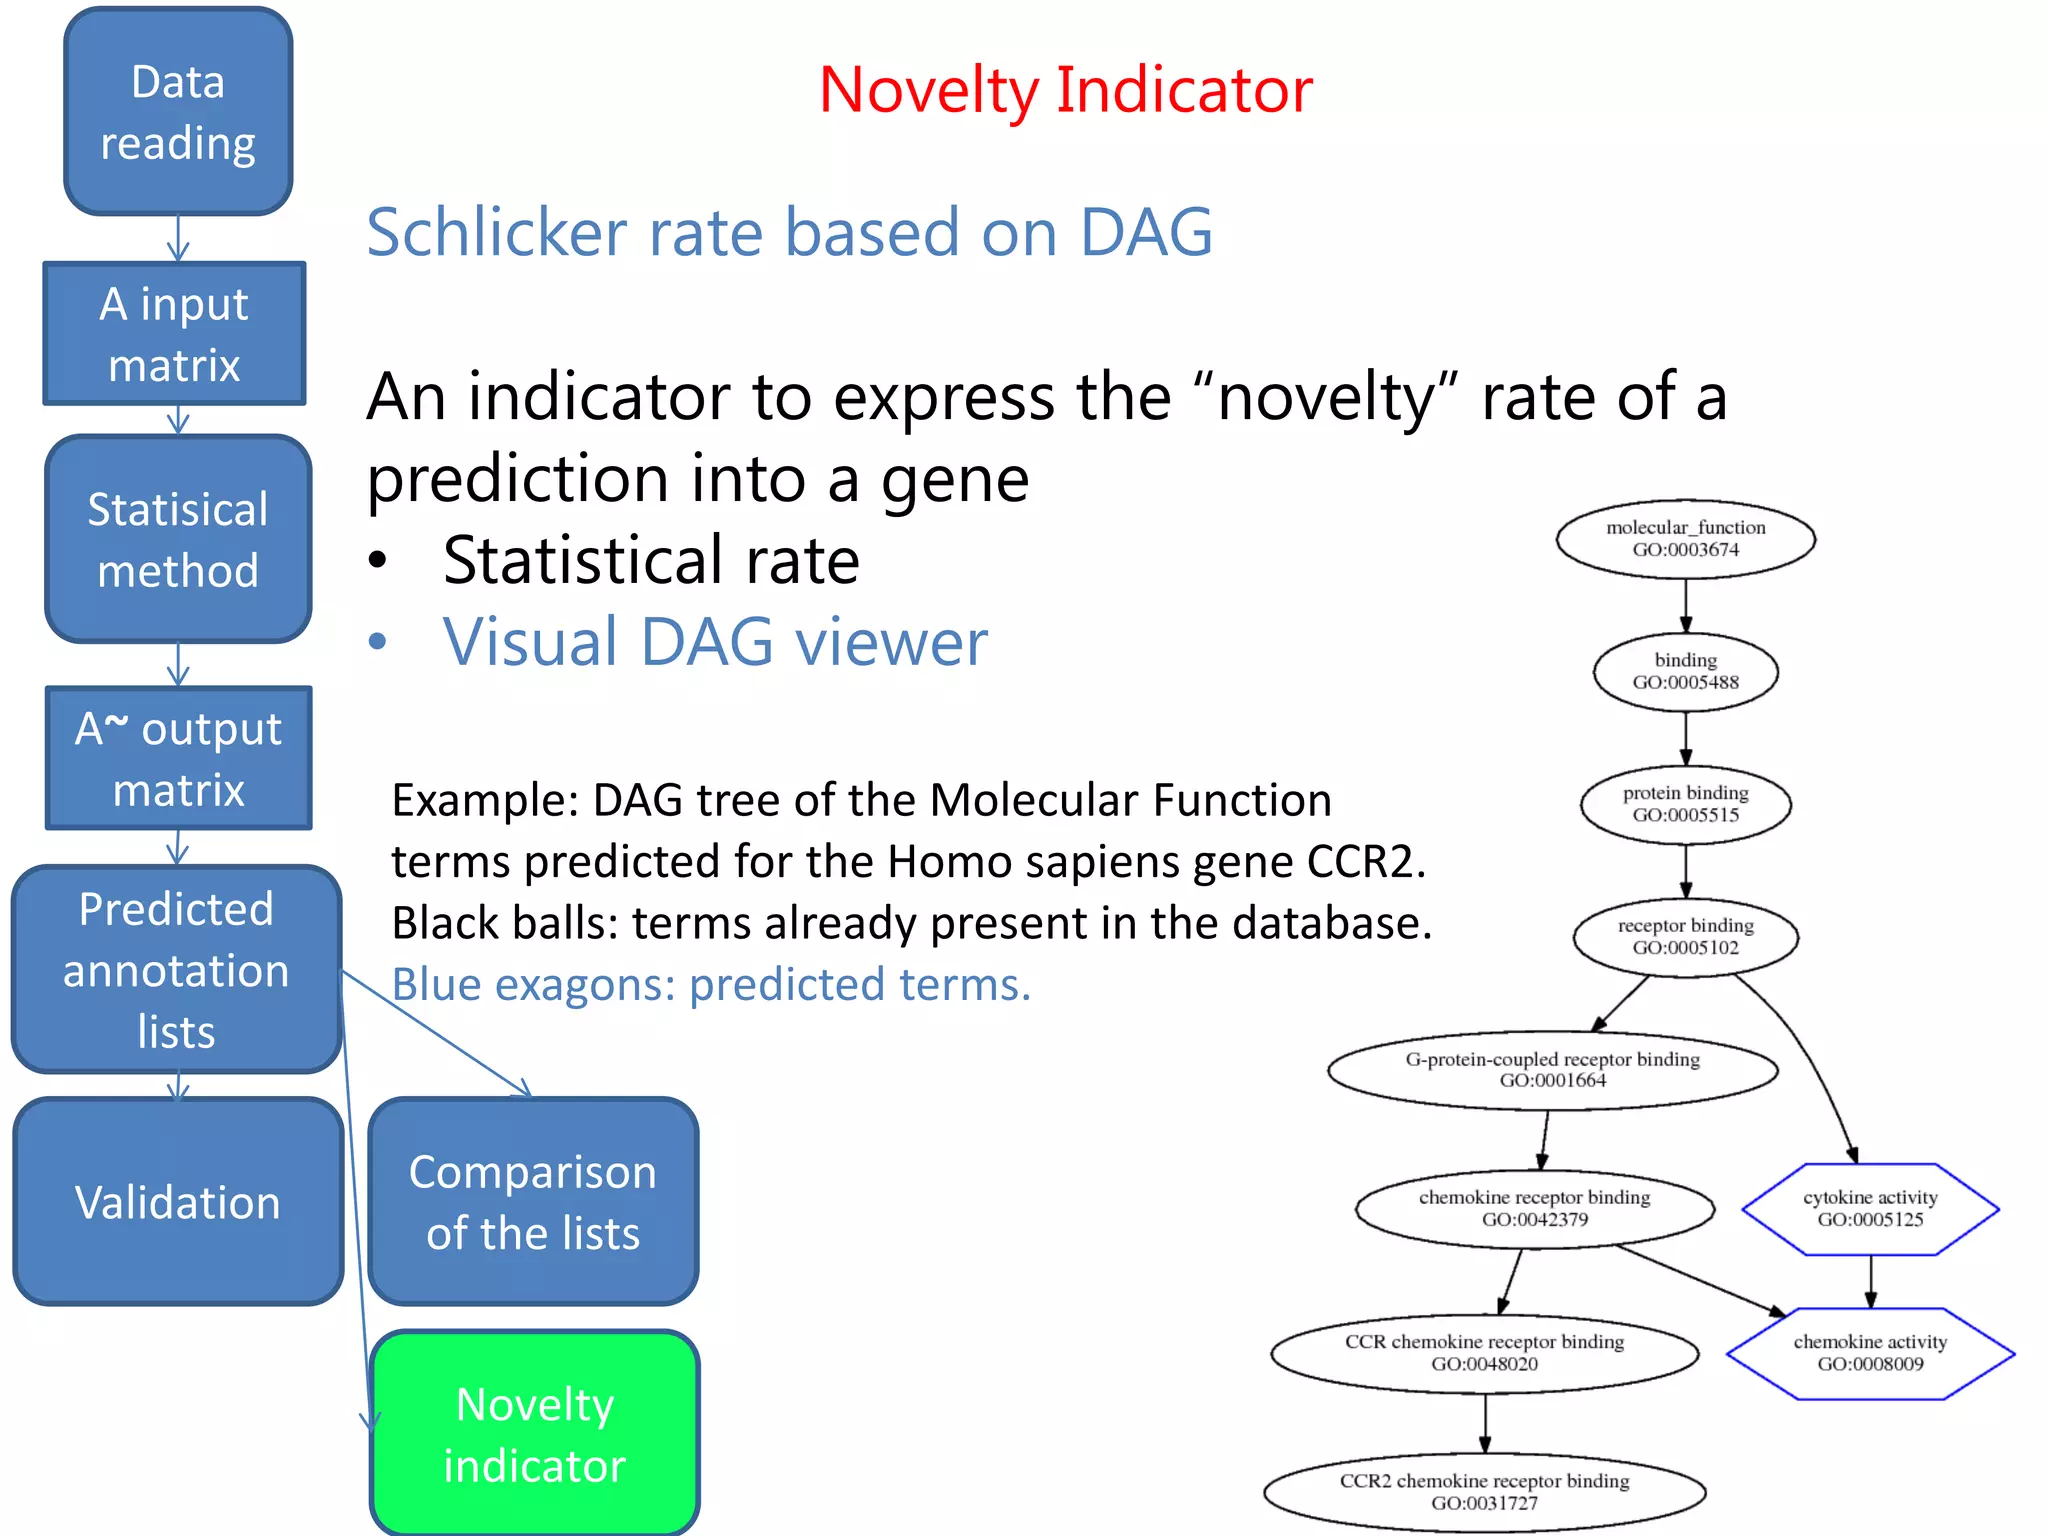
The document details the use of machine learning methods for predicting gene functions, focusing on the development of a software called bioannotationpredictor that creates prioritized lists of computationally predicted annotations. It discusses the challenges of incomplete databases, the methodologies employed (including various statistical methods), and the validation procedures like ROC curve analysis and literature validation. The work aims to enhance the reliability of gene annotations by combining various predictive algorithms and validation techniques.