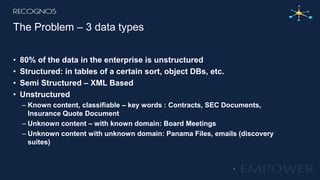
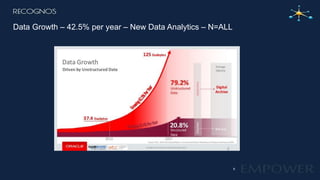
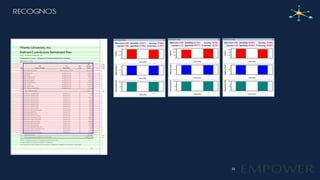
This document provides an overview of how to prepare unstructured data for business intelligence and data analytics. It discusses structured, semi-structured, and unstructured data types. It then introduces Recognos' platform called ETI, which uses human-assisted machine learning to extract and integrate data from unstructured documents. ETI can extract data from documents that contain classifiable content through predefined field definitions and templates. It also discusses the challenges of extracting tables and derived fields that require semantic analysis. The document concludes with examples of using extracted data for compliance applications and creating data teams to manage the extraction process over time.
Text Analytics Market Insights: What's Working and What's NextSeth Grimes
Text analytics software and business processes apply natural language processing to extract business insights from text sources like social media, online content, and enterprise data. The document discusses what is currently working well in text analytics, such as its application in conversation, customer experience, finance, healthcare, and media, as well as its use of techniques like bag-of-words modeling and entity extraction. The document also outlines emerging areas for text analytics, such as analysis of narrative, argumentation, integration of multiple data sources and languages, and understanding of affect and emotion.
An Introduction to Text Analytics: 2013 Workshop presentationSeth Grimes
This document provides an introduction to text analytics. It discusses perspectives on text analytics from different roles like IT support, researchers, and solution providers. It explains how text analytics can boost business results by analyzing unstructured text data from sources like emails, social media, surveys etc. It discusses how text analytics transforms information retrieval to information access by extracting semantics, entities, topics and relationships from text. It also provides definitions and explanations of key concepts in text analytics like entities, features, metadata, natural language processing, information extraction, categorization, classification and evaluation metrics.
This document summarizes an analysis of unstructured data and text analytics. It discusses how text analytics can extract meaning from unstructured sources like emails, surveys, forums to enhance applications like search, information extraction, and predictive analytics. Examples show how tools can extract entities, relationships, sentiments to gain insights from sources in domains like healthcare, law enforcement, and customer experience.
This document provides an introduction to text analytics using IBM SPSS Modeler. It defines key terms related to text analytics and outlines the main steps in the text analytics process: extraction, categorization, and visualization. It then provides a tutorial on using IBM SPSS Modeler to perform text analytics, including sourcing text, extracting concepts and relationships, categorizing records, and visualizing results. Templates and resources are described that can be used to start an interactive workbench session in Modeler for exploring text analytics.
The document discusses predictive text analytics, including predicting text completions, disambiguating text, and correcting errors. It also discusses extracting entities, concepts, facts, and sentiments from unstructured text sources for applications like search, knowledge discovery, and predictive analytics. Key challenges include the complexity of human language with features like ambiguity and context.
Text analytics is used to extract structured data from unstructured text sources like social media posts, reviews, emails and call center notes. It involves acquiring and preparing text data, processing and analyzing it using algorithms like decision trees, naive bayes, support vector machines and k-nearest neighbors to extract terms, entities, concepts and sentiment. The results are then visualized to support data-driven decision making for applications like measuring customer opinions and providing search capabilities. Popular tools for text analytics include RapidMiner, KNIME, SPSS and R.
Text Analytics Applied (LIDER roadmapping presentation)Seth Grimes
This document summarizes Seth Grimes' presentation on text analytics at the 2nd LIDER roadmapping workshop in Madrid on May 8, 2014. The presentation covered various applications of text analytics including customer experience management, online commerce, and e-discovery. It also discussed the types of textual data that can be analyzed such as emails, social media posts, reviews and surveys. The document provided information on important capabilities for text analytics solutions such as information extraction, sentiment analysis and integration with other systems.
Seth Grimes gave a presentation on text analytics at IIeX in Atlanta on June 16, 2015. The presentation discussed the history of text analytics from early computers that could process documents in the 1950s to recent advancements in analyzing social media, online reviews, and other unstructured text data sources. Grimes also covered current and future trends in text analytics, including the growth of social media and big data, new machine learning and language processing techniques, and an increasing need for multi-lingual support.
Lexalytics Text Analytics Workshop: Perfect Text AnalyticsLexalytics
This document summarizes and promotes the text analytics capabilities of Perfect Text Analytics. It discusses how Perfect is fast, usable, consistent, provides new knowledge, is inclusive of all text, and is trainable. Customer use cases are presented in reputation management, politics, market intelligence, hospitality, financial services, pharma, and opinion mining. The document outlines planned enhancements over the next year, including sarcasm detection, foreign language support, and more customizable tools. Overall, it argues that text analytics can provide valuable insights across many industries when combined with business logic.
This video will give you an idea about Data science for beginners.
Also explain Data Science Process , Data Science Job Roles , Stages in Data Science Project
This document provides an introduction to data science. It discusses why data science is important and covers key techniques like statistics, data mining, and visualization. It also reviews popular tools and platforms for data science like R, Hadoop, and real-time systems. Finally, it discusses how data science can be applied across different business domains such as financial services, telecom, retail, and healthcare.
This document provides an introduction to data science, including:
- Why data science has gained popularity due to advances in AI research and commoditized hardware.
- Examples of where data science is applied, such as e-commerce, healthcare, and marketing.
- Definitions of data science, data scientists, and their roles.
- Overviews of machine learning techniques like supervised learning, unsupervised learning, deep learning and examples of their applications.
- How data science can be used by businesses to understand customers, create personalized experiences, and optimize processes.
This is an introduction to text analytics for advanced business users and IT professionals with limited programming expertise. The presentation will go through different areas of text analytics as well as provide some real work examples that help to make the subject matter a little more relatable. We will cover topics like search engine building, categorization (supervised and unsupervised), clustering, NLP, and social media analysis.
Data science combines fields like statistics, programming, and domain expertise to extract meaningful insights from data. It involves preparing, analyzing, and modeling data to discover useful information. Exploratory data analysis is the process of investigating data to understand its characteristics and check assumptions before modeling. There are four types of EDA: univariate non-graphical, univariate graphical, multivariate non-graphical, and multivariate graphical. Python and R are popular tools used for EDA due to their data analysis and visualization capabilities.
A set of ideas on the use of artificial intelligence for data curation that has been presented at the Pharma-IT conference (London, 2017), in the artificial intelligence track.
It begins with some broad discussion about semantic web, knowledge representation, machine learning and artificial intelligence. It the focus on how a "data curation" problem can be framed and hints at some possible examples.
This document outlines the course structure and content for a Data Science course. The 5 modules cover: 1) introductions to data science concepts and statistical inference using R; 2) exploratory data analysis and machine learning algorithms; 3) feature generation/selection and additional machine learning algorithms; 4) recommendation systems and dimensionality reduction; 5) mining social network graphs and data visualization. The course aims to teach students to define data science fundamentals, demonstrate the data science process, explain necessary machine learning algorithms, illustrate data analysis techniques, and follow ethics in data visualization.
Provenance and Reuse of Open Data (PILOD 2.0 June 2014)Rinke Hoekstra
The document summarizes a converts' rally held at Carnegie Hall in New York City on September 14, 1908 by the Evangelistic Committee. It discusses ingredients for publishing open data, including using URIs, versioning, repeatable transformations, choosing an appropriate level of detail, combining vocabularies, contextualizing information, and provenance. Provenance, or the origin and history of data, is a key issue in publishing open government data and builds trust for application developers and the public. Standards like the W3C PROV ontology can help represent provenance.
The document discusses data curation from data lakes. It describes the data lake paradigm of collecting all data and making it searchable. It then discusses the importance of data curation and normalization to generate value from large and diverse datasets. Examples are provided showing how sample annotations can be normalized and structured to enable complex queries across multiple datasets. The document reflects on challenges around quantifying the value of data curation and need for curation as data volumes increase.
1) The document discusses a self-study approach to learning data science through project-based learning using various online resources.
2) It recommends breaking down projects into 5 steps: defining problems/solutions, data extraction/preprocessing, exploration/engineering, model implementation, and evaluation.
3) Each step requires different skillsets from domains like statistics, programming, SQL, visualization, mathematics, and business knowledge.
With the continuously increasing number of datasets published in the Web of Data and form part of the Linked Open Data Cloud, it becomes more and more essential to identify resources that correspond to the same real world object in order to interlink web resources and set the basis for large-scale data integration. This requirement becomes apparent in a multitude of domains ranging from science (marine research, biology, astronomy, pharmacology) to semantic publishing and cultural domains. In this context, instance matching is of crucial importance.
It is though essential at this point to develop, along with instance and entity matching systems, benchmarks to determine the weak and strong points of those systems, as well as their overall quality in order to support users in deciding the system to use for their needs. Hence, well defined, and good quality benchmarks are important for comparing the performance of the developed instance matching systems.
In this tutorial we aim at:
- Discussing the state-of-the-art instance matching benchmarks
- Presenting the benchmark design principles
- Providing an analysis of the performance results of instance matching systems for the presented benchmarks
- Presenting the research directions that should be exploited for the creation of novel benchmarks to answer the needs of the Linked Data paradigm.
Please click here for the Tutorial web-page: http://www.ics.forth.gr/isl/BenchmarksTutorial/
Statistical analysis and data mining both involve analyzing data, but have different objectives. Statistical analysis aims to describe datasets, while data mining aims to model data to predict, simulate, and optimize. Statistical analysis uses established methodology and hypothesis testing on structured data, while data mining uses heuristics to uncover hidden patterns in large, complex datasets. Data science incorporates techniques from statistics, data mining, and other fields to extract meaningful knowledge from data.
This workshop was presented in Riyadh, SA in 21-22 Jan 2019, with the collaboration with Riyadh Data Geeks group.
To learn more about the workshop please see this website:
http://bit.ly/2Ucjmm5
Data analytics beyond data processing and how it affects Industry 4.0Mathieu d'Aquin
The document discusses how data analytics is moving beyond just data processing to affect Industry 4.0. It summarizes the research areas and industry partnerships of the Insight Centre for Data Analytics in NUI Galway, including linked data, machine learning, and media analytics. Key applications discussed are monitoring energy consumption using stream processing and event detection, predicting future behavior through machine learning, and detecting and classifying anomalies to inform predictive maintenance decisions.
"Searching for Meaning: The Hidden Structure in Unstructured Data". Presentation by Trey Grainger at the Southern Data Science Conference (SDSC) 2018. Covers linguistic theory, application in search and information retrieval, and knowledge graph and ontology learning methods for automatically deriving contextualized meaning from unstructured (free text) content.
Mining Unstructured Data:Practical Applications, from the Strata O'Reilly Mak...Peter Wren-Hilton
Alyona Medelyan (Pingar), Anna Divoli (Pingar)
presented at Strata O'Reilly Making Data Work Conference on March 1, 2012
The challenge of unstructured data is a top priority for organizations that are looking for ways to search, sort, analyze and extract knowledge from masses of documents they store and create daily. Text mining uses knowledge-driven algorithms to make sense of documents in a similar way a person would do by reading them. Lately, text mining and analytics tools became available via APIs, meaning that organizations can take immediate advantage these tools. We discuss three examples of how such APIs were utilized to solve key business challenges.
Most organizations dream of paperless office, but still generate and receive millions of print documents. Digitizing these documents and intelligently sharing them is a universal enterprise challenge. Major scanning providers offer solutions that analyze scanned and OCR’d documents and then store detected information in document management systems. This works well with pre-defined forms, but human interaction is required when scanning unstructured text. We describe a prototype build for the legal vertical that scans stacks of paper documents and on the fly categorizes and generates meaningful metadata.
In the area of forensics, intelligence and security, manual monitoring of masses of unstructured data is not feasible. The ability of automatically identify people’s names, addresses, credit card and bank account numbers and other entities is the key. We will briefly describe a case study of how a major international financial institution is taking advantage of text mining APIs in order to comply with a recent legislation act.
In healthcare, although Electronic Health Records (EHRs) have been increasingly becoming available over the past two decades, patient confidentiality and privacy concerns have been acting as obstacles from utilizing the incredibly valuable information they contain to further medical research. Several approaches have been reported in assigning unique encrypted identifiers to patients’ ID but each comes with drawbacks. For a number of medical studies consistent uniform ID mapping is not necessary and automated text sanitization can serve as a solution. We will demonstrate how sanitization has practical use in a medical study.
And read a full interview with Alyona and Anna at http://radar.oreilly.com/2012/02/unstructured-data-analysis-tools.html
Hotsos 2013 - Creating Structure in Unstructured DataMarco Gralike
This document discusses creating structure from unstructured XML data and optimizing XML performance in Oracle databases. It provides examples of structuring Wikipedia XML data and indexing it in various ways using XMLType, binary XML, structured and unstructured XML indexes. The key is choosing the right storage and indexing approach depending on the query patterns and data structure. Proper design can significantly outperform default XML handling.
Lecture 11 Unstructured Data and the Data Warehousephanleson
This chapter discusses integrating structured and unstructured data in a data warehouse. It presents methods like using common text to link the two environments, employing a two-tiered structure with separate warehouses for structured and unstructured data, and using techniques like self-organizing maps to visualize unstructured data. The goal is to find ways to relate the different data types while addressing issues like incompatible formats and large unstructured data volumes.
The Analytic System: Finding Patterns in the DataHealth Catalyst
Dr. Haughom set the stage for this upcoming discussion in his previous webinar, explaining the key components of an effective analytical system that enables self-exploration and learning. In this session Attendees will learn:
How the distinction between random variation and assignable cause variation is critically important to patient care
Creation and application of Statistical Process Control (SPC) charts to:
Monitor process variation over time
Differentiate between assignable cause and random cause variation
Assess effectiveness of change on a given process
Achieve and maintain process stability
How implementing inlier management and creating a collaborative environment will drive continuous improvement
How to identify patterns in data using a live demonstration of advanced analytical tools.
The document discusses unstructured data and its importance for business intelligence. It notes that 80% of organizational data is typically unstructured and resides in various documents and sources, both internal and external to the organization. Environmental scanning involves systematically analyzing unstructured external data to produce market forecasts and intelligence reports. Text mining can help untangle unstructured data through content analytics and indexing content from sources like emails, websites and social media. This can provide insights for applications like brand, competitor and organizational intelligence. However, challenges include ensuring accurate content tagging and addressing scalability issues for large volumes of unstructured data.
Analyzing Unstructured Data in Hadoop WebinarDatameer
Unstructured data is growing 62% per year faster than structured data. According to Gartner, data volumes are set to grow 800% in aggregate over the next 5 years, and 80% of it will be unstructured data.
This on-demand webinar will highlight and discuss:
How applying big data analytics to unstructured data can help you gain richer, deeper and more accurate insights to gain competitive advantages
The sources of unstructured data which include email, social media platforms, CRM systems, call center platforms (including notes and speech-to-text transcripts), and web scrapes
How monitoring the communications of your customers and prospects enables you to make time-sensitive decisions and jump on new business opportunities
Using Hadoop as a platform for Master Data ManagementDataWorks Summit
This document discusses using Hadoop as a platform for master data management. It begins by explaining what master data management is and its key components. It then discusses how MDM relates to big data and some of the challenges of implementing MDM on Hadoop. The document provides a simplified example of traditional MDM and how it could work on Hadoop. It outlines some common approaches to matching and merging data on Hadoop. Finally, it discusses a sample MDM tool that could implement matching in Hadoop through MapReduce jobs and provide online MDM services through an accessible database.
Data Patterns - A Native Open Source Data Profiling Tool for HPCC SystemsHPCC Systems
This document discusses using predictive analytics and HPCC Systems to make IoT data actionable for insurance companies. It begins by outlining the growth of IoT devices and some of the big questions they pose for insurers. The document then provides examples of how smart thermostat and water leak detection data could help with occupancy monitoring, prevention and claims. It also discusses how water leak claims have increased in Florida due to assignment of benefits to third parties. The document concludes by discussing how insurers can start unlocking insights from IoT data through technology, analytics and pilot programs that leverage HPCC Systems' pull architecture to integrate diverse data sources for predictive modeling.
This document provides an overview of exploratory data analysis techniques. It discusses what data is, common sources of data, and different data types and formats. Key steps in exploratory data analysis are introduced, including descriptive statistics, visualizations, and handling messy data. Common measures used to describe central tendency and spread of data are defined. The importance of visualization for exploring relationships and patterns in data is emphasized. Examples of different visualizations are provided.
This document discusses how proper data collection is essential for manufacturing intelligence and analytics. It explains that without high-quality data from reliable sources, even sophisticated analytics will fail to provide useful insights. The document emphasizes that data must be collected systematically and represent the actual manufacturing process to enable effective statistical analysis. It highlights potential issues with manual data collection and provides examples of how lack of context can limit the usefulness of data. The overall message is that poor data collection practices can undermine manufacturing intelligence systems and result in missed signals, false alarms, and unreliable metrics.
Analyst’s Nightmare or Laundering Massive SpreadsheetsPyData
By Feyzi Bagirov
PyData New York City 2017
Poor data quality frequently invalidates data analysis when performed on Excel data that underwent transformations, imputations, and manual manipulations. In this talk we will use Pandas to walk through Excel data analysis and illustrate several common pitfalls that make this analysis invalid.
ds 1 Introduction to Data Structures.pptAlliVinay1
This document provides an introduction and overview of data structures. It begins by defining key terms like data, information, and entities. It then discusses how data structures represent logical relationships between data elements and how they should be easy to process and represent relationships. The document classifies common data structures as linear, non-linear, homogeneous, non-homogeneous, dynamic, and static. It also provides examples of basic notations, algorithms, control structures, and applications of different data structure types like arrays, stacks, queues, linked lists, trees, and graphs. Finally, it discusses complexity analysis and the tradeoff between time and space.
Data processing involves 5 key steps: editing data, coding data, classifying data, tabulating data, and creating data diagrams. It transforms raw collected data into a usable format through these steps of cleaning, organizing, and analyzing the data. First, data is collected from sources and prepared by cleaning errors. It is then inputted and processed using algorithms before being output and interpreted in readable formats. Finally, the processed data is stored for future use and reports.
Data processing involves 5 key steps: 1) editing data to check for errors or omissions, 2) coding data by assigning numerals or symbols to categories, 3) classifying data into groups with common characteristics, 4) tabulating data by organizing it into a table for comparison and analysis, and 5) creating data diagrams or visual representations like graphs. The goal of data processing is to transform raw collected data into a readable and interpretable format that can be analyzed and used within an organization.
This document provides an overview of data science tools, techniques, and applications. It begins by defining data science and explaining why it is an important and in-demand field. Examples of applications in healthcare, marketing, and logistics are given. Common computational tools for data science like RapidMiner, WEKA, R, Python, and Rattle are described. Techniques like regression, classification, clustering, recommendation, association rules, outlier detection, and prediction are explained along with examples of how they are used. The advantages of using computational tools to analyze data are highlighted.
This document discusses preparing data for analysis. It covers the need for data exploration including validation, sanitization, and treatment of missing values and outliers. The main steps in statistical data analysis are also presented. Specific techniques discussed include calculating frequency counts and descriptive statistics to understand the distribution and characteristics of variables in a loan data set with 250,000 observations. SAS procedures like Proc Freq, Proc Univariate, and Proc Means are demonstrated for exploring the data.
The document discusses systems analysis and design. It explains that systems analysis involves analyzing existing systems within organizations to identify problems and improve efficiency. The stages of designing a new system are then outlined, including research, analysis, design, production, testing, documentation, implementation and evaluation. Various aspects of analyzing existing systems and designing new systems are then described in more detail, such as identifying inputs, outputs, and processes, specifying requirements, and designing data entry, validation, storage, outputs and system processes. Testing methods and strategies are also discussed.
1) Data analytics involves treating available digital data as a "gold mine" to obtain tangible outputs that can improve business efficiency when applied. Machine learning uses algorithms to correlate parameters in data and improve relationships.
2) The document provides an overview of getting started in data science, covering business objectives, statistical analysis, programming tools like R and Python, and problem-solving approaches like supervised and unsupervised learning.
3) It describes the iterative "rule of seven" process for data science projects, including collecting/preparing data, exploring/analyzing it, transforming features, applying models, evaluating performance, and visualizing results.
This document provides an introduction to the CSC112 Algorithms and Data Structures lecture. It discusses the need for data structures to organize data efficiently and enable more complex applications. Different types of data structures are presented, including linear structures like arrays, lists, queues and stacks, as well as non-linear structures like trees and graphs. Key data structure operations like traversing, searching, inserting and deleting records are also outlined. The document emphasizes that the choice of data structure and algorithm can significantly impact a program's efficiency and performance.
Data Analysis in Research: Descriptive Statistics & NormalityIkbal Ahmed
This document discusses different types of data and data analysis techniques used in research. It defines data as any set of characters gathered for analysis. Research data can take many forms including documents, laboratory notes, questionnaires, and digital outputs. There are two main types of data: quantitative data which can be measured numerically, and qualitative data involving words and symbols. Common quantitative analysis techniques described are descriptive statistics to summarize variables and inferential statistics to understand relationships. Qualitative analysis techniques include content analysis, narrative analysis and grounded theory.
Epi Info and SPSS are software packages used for data entry, management, and analysis in epidemiology and public health. Epi Info is a free software developed by CDC that allows users to rapidly develop electronic data entry forms, enter data, and analyze the data. It has advantages of being free, user-friendly, and serving as an all-in-one software for data entry, management and basic analysis. SPSS is a statistical software package that can be used to conduct more complex statistical analyses, generate tables and graphs, and manipulate data. Both software have features for data entry, management, and descriptive and basic analytical capabilities, though SPSS allows for more advanced statistical analyses.
The document discusses various steps involved in analyzing and interpreting data, including developing an analysis plan, collecting and cleaning data, analyzing the data using appropriate techniques, interpreting the results by drawing conclusions and recommendations while also considering limitations. It provides examples of different analysis techniques like descriptive statistics, inferential statistics, and qualitative data analysis and emphasizes the importance of interpreting data in the context of the research questions.
1.1 introduction to Data Structures.pptAshok280385
Here are the algorithms for the given problems:
1. WAA to find largest of three numbers:
1. Start
2. Read three numbers a, b, c
3. If a > b and a > c then largest number is a
4. Else If b > a and b > c then largest number is b
5. Else largest number is c
6. Print largest number
7. Stop
2. WAA to find the sum of first 10 natural numbers using for loop:
1. Start
2. Declare variables i, sum
3. Initialize i=1, sum=0
4. For i=1 to 10
5. sum =
In the modern world, we are permanently using, leveraging, interacting with, and relying upon systems of ever higher sophistication, ranging from our cars, recommender systems in eCommerce, and networks when we go online, to integrated circuits when using our PCs and smartphones, security-critical software when accessing our bank accounts, and spreadsheets for financial planning and decision making. The complexity of these systems coupled with our high dependency on them implies both a non-negligible likelihood of system failures, and a high potential that such failures have significant negative effects on our everyday life. For that reason, it is a vital requirement to keep the harm of emerging failures to a minimum, which means minimizing the system downtime as well as the cost of system repair. This is where model-based diagnosis comes into play.
Model-based diagnosis is a principled, domain-independent approach that can be generally applied to troubleshoot systems of a wide variety of types, including all the ones mentioned above. It exploits and orchestrates techniques for knowledge representation, automated reasoning, heuristic problem solving, intelligent search, learning, stochastics, statistics, decision making under uncertainty, as well as combinatorics and set theory to detect, localize, and fix faults in abnormally behaving systems.
In this talk, we will give an introduction to the topic of model-based diagnosis, point out the major challenges in the field, and discuss a selection of approaches from our research addressing these challenges. For instance, we will present methods for the optimization of the time and memory performance of diagnosis systems, show efficient techniques for a semi-automatic debugging by interacting with a user or expert, and demonstrate how our algorithms can be effectively leveraged in important application domains such as scheduling or the Semantic Web.
J48 and JRIP Rules for E-Governance DataCSCJournals
Data are any facts, numbers, or text that can be processed by a computer. Data Mining is an analytic process which designed to explore data usually large amounts of data. Data Mining is often considered to be \"a blend of statistics. In this paper we have used two data mining techniques for discovering classification rules and generating a decision tree. These techniques are J48 and JRIP. Data mining tools WEKA is used in this paper.
Similar to Unstructured data processing webinar 06272016 (20)
UI5con 2024 - Boost Your Development Experience with UI5 Tooling ExtensionsPeter Muessig
The UI5 tooling is the development and build tooling of UI5. It is built in a modular and extensible way so that it can be easily extended by your needs. This session will showcase various tooling extensions which can boost your development experience by far so that you can really work offline, transpile your code in your project to use even newer versions of EcmaScript (than 2022 which is supported right now by the UI5 tooling), consume any npm package of your choice in your project, using different kind of proxies, and even stitching UI5 projects during development together to mimic your target environment.
Neo4j - Product Vision and Knowledge Graphs - GraphSummit ParisNeo4j
Dr. Jesús Barrasa, Head of Solutions Architecture for EMEA, Neo4j
Découvrez les dernières innovations de Neo4j, et notamment les dernières intégrations cloud et les améliorations produits qui font de Neo4j un choix essentiel pour les développeurs qui créent des applications avec des données interconnectées et de l’IA générative.
Artificia Intellicence and XPath Extension FunctionsOctavian Nadolu
The purpose of this presentation is to provide an overview of how you can use AI from XSLT, XQuery, Schematron, or XML Refactoring operations, the potential benefits of using AI, and some of the challenges we face.
A Study of Variable-Role-based Feature Enrichment in Neural Models of CodeAftab Hussain
Understanding variable roles in code has been found to be helpful by students
in learning programming -- could variable roles help deep neural models in
performing coding tasks? We do an exploratory study.
- These are slides of the talk given at InteNSE'23: The 1st International Workshop on Interpretability and Robustness in Neural Software Engineering, co-located with the 45th International Conference on Software Engineering, ICSE 2023, Melbourne Australia
8 Best Automated Android App Testing Tool and Framework in 2024.pdfkalichargn70th171
Regarding mobile operating systems, two major players dominate our thoughts: Android and iPhone. With Android leading the market, software development companies are focused on delivering apps compatible with this OS. Ensuring an app's functionality across various Android devices, OS versions, and hardware specifications is critical, making Android app testing essential.
Zoom is a comprehensive platform designed to connect individuals and teams efficiently. With its user-friendly interface and powerful features, Zoom has become a go-to solution for virtual communication and collaboration. It offers a range of tools, including virtual meetings, team chat, VoIP phone systems, online whiteboards, and AI companions, to streamline workflows and enhance productivity.
SMS API Integration in Saudi Arabia| Best SMS API ServiceYara Milbes
Discover the benefits and implementation of SMS API integration in the UAE and Middle East. This comprehensive guide covers the importance of SMS messaging APIs, the advantages of bulk SMS APIs, and real-world case studies. Learn how CEQUENS, a leader in communication solutions, can help your business enhance customer engagement and streamline operations with innovative CPaaS, reliable SMS APIs, and omnichannel solutions, including WhatsApp Business. Perfect for businesses seeking to optimize their communication strategies in the digital age.
Flutter is a popular open source, cross-platform framework developed by Google. In this webinar we'll explore Flutter and its architecture, delve into the Flutter Embedder and Flutter’s Dart language, discover how to leverage Flutter for embedded device development, learn about Automotive Grade Linux (AGL) and its consortium and understand the rationale behind AGL's choice of Flutter for next-gen IVI systems. Don’t miss this opportunity to discover whether Flutter is right for your project.
DDS Security Version 1.2 was adopted in 2024. This revision strengthens support for long runnings systems adding new cryptographic algorithms, certificate revocation, and hardness against DoS attacks.
OpenMetadata Community Meeting - 5th June 2024OpenMetadata
The OpenMetadata Community Meeting was held on June 5th, 2024. In this meeting, we discussed about the data quality capabilities that are integrated with the Incident Manager, providing a complete solution to handle your data observability needs. Watch the end-to-end demo of the data quality features.
* How to run your own data quality framework
* What is the performance impact of running data quality frameworks
* How to run the test cases in your own ETL pipelines
* How the Incident Manager is integrated
* Get notified with alerts when test cases fail
Watch the meeting recording here - https://www.youtube.com/watch?v=UbNOje0kf6E
Transform Your Communication with Cloud-Based IVR SolutionsTheSMSPoint
Discover the power of Cloud-Based IVR Solutions to streamline communication processes. Embrace scalability and cost-efficiency while enhancing customer experiences with features like automated call routing and voice recognition. Accessible from anywhere, these solutions integrate seamlessly with existing systems, providing real-time analytics for continuous improvement. Revolutionize your communication strategy today with Cloud-Based IVR Solutions. Learn more at: https://thesmspoint.com/channel/cloud-telephony
Neo4j - Product Vision and Knowledge Graphs - GraphSummit ParisNeo4j
Dr. Jesús Barrasa, Head of Solutions Architecture for EMEA, Neo4j
Découvrez les dernières innovations de Neo4j, et notamment les dernières intégrations cloud et les améliorations produits qui font de Neo4j un choix essentiel pour les développeurs qui créent des applications avec des données interconnectées et de l’IA générative.
E-commerce Application Development Company.pdfHornet Dynamics
Your business can reach new heights with our assistance as we design solutions that are specifically appropriate for your goals and vision. Our eCommerce application solutions can digitally coordinate all retail operations processes to meet the demands of the marketplace while maintaining business continuity.
Microservice Teams - How the cloud changes the way we workSven Peters
A lot of technical challenges and complexity come with building a cloud-native and distributed architecture. The way we develop backend software has fundamentally changed in the last ten years. Managing a microservices architecture demands a lot of us to ensure observability and operational resiliency. But did you also change the way you run your development teams?
Sven will talk about Atlassian’s journey from a monolith to a multi-tenanted architecture and how it affected the way the engineering teams work. You will learn how we shifted to service ownership, moved to more autonomous teams (and its challenges), and established platform and enablement teams.
GraphSummit Paris - The art of the possible with Graph TechnologyNeo4j
Sudhir Hasbe, Chief Product Officer, Neo4j
Join us as we explore breakthrough innovations enabled by interconnected data and AI. Discover firsthand how organizations use relationships in data to uncover contextual insights and solve our most pressing challenges – from optimizing supply chains, detecting fraud, and improving customer experiences to accelerating drug discoveries.
GraphSummit Paris - The art of the possible with Graph Technology
Unstructured data processing webinar 06272016
1. How to Prepare Unstructured
Data for BI and Data Analytics
George ROTH – CEO Recognos Inc.
Neil MITCHELL – Recognos Inc.
Webinar Starting Soon – Everybody is Placed on Mute
2. How to Prepare Unstructured
Data for BI and Data Analytics
George ROTH – CEO Recognos Inc.
Neil MITCHELL – Recognos Inc.
3. Housekeeping
• All attendees are placed on Mute throughout the presentation
• We will make available all the Webinar materials
– The slides will be emailed and the recording posted
• Questions
– Please use the GoToWebinar “chat box” in the control panel to ask any questions
– These will be addressed at the end, as time allows, or written responses provided
• Polling
– To improve these webinars we will ask for your feedback in the form of polling
questions
– They are completely confidential
– Multiple choice
3
4. AGENDA
A. Structured, Semi-Structured and Un-Structured Content
B. What is Data Preparation in Data Science
C. The Swiss Army Knife of the Data Extraction
D. Processing of Unstructured Non-Classifiable content and
integrate all data (SDP - The Smart Data Platform)
E. On boarding ETI or SDP
F. About Recognos and Next Steps
G.Q&A
4
7. The Problem – 3 data types
• 80% of the data in the enterprise is unstructured
• Structured: in tables of a certain sort, object DBs, etc.
• Semi Structured – XML Based
• Unstructured
– Known content, classifiable – key words : Contracts, SEC Documents,
Insurance Quote Document
– Unknown content – with known domain: Board Meetings
– Unknown content with unknown domain: Panama Files, emails (discovery
suites)
7
8. Data Growth – 42.5% per year – New Data Analytics – N=ALL
8
11. What is Data Preparation in Data Science
• In most of the presentations they will say that is a tedious task
• There is no system that will do that
• Not always we know what to prepare for the Data Science applications
• Example:
– NGO – Grant – needed to know the start dates, end dates, amount of money,
name of project
– Needed to find the graph of the recipients to determine connections between
recipients
– Prevent fraud for EU funds – or money laundering
• Need to combine different data types (structured, semi-structured and
unstructured) and to provide for the next steps
11
12. C. The Swiss Army Knife for
Unstructured Classifiable content
12
15. Content that is classifiable by Keywords
• In general legal content
• Can determine the keywords
• Examples:
– Contracts
– SEC Documents
– Different Legal Documents
– Forms (IRS, INS, etc.)
– Hospital Patient Info
– Insurance Info
– Etc.
15
16. Field Types with their Extraction Methods
Type Field Type Definition Extraction Method Can be setup by
business people
?
Estimated
Percentage in
docs
Expected Accuracy
1Explicit Trainable These fields appear in the
approximate same context,
consistent across documents of the
same type.
Human Assisted Machine
Learning
Y 50%>75%
2Explicit Form Fields These fields are always preceded
by the same labels, same contexts,
etc. Example are any IRS form, the
10K Header.
Predefined templates. Need to
be setup. We are planning to
create the UI for this, we don't
have one. This was the
method that was used for the
10Ks 6 fields.
Y 10%>95%
3Explicit List Fields These fields have the same values
in all documents (with small
variations) that are known from the
beginning.
The user can define a library of
"lists" , and can select a list at
the document setup phase.
Y 10%>90%
4Implicit List Fields The expected values are
predefined but are not present in
the document. Need to be inferred
from the text.
Semantic Scripts, needs a
Semantic Infrastrucutre.
NO 5%>90%
5Semantic Fields These fields have values that are
not consistent across documents
and need semantic analysis.
Semantic Scripts, needs a
Semantic Infrastrucutre.
NO 20%>90%
6Graphical Fields
Presence
We encountered two fields.
Signature Present, Seal Present.
Artificial Vision Neural
Networks are used to detect
those. The algorithms exist,
need to be integrated.
YES 1%>95%
7Tables These are tables in a document.
There are two table types,
Manhatan Tables (no lines) and
others.
Special Artificial Vision method
to detect the table, regular
expressioln to extract the fields
after the table found.
YES 3%>95%
8Enhanced These fields are not in the
document but can be found in
some auxiliary data stores based
on what is in the document.
These fields actualy are
populated in the post
extraction validation /
augmentation process.
NO 1%>95%
100%
16
18. ETI- Extract Transform Integrate Platform –
Human in the loop Machine Learning
Document load
•PDF files, containing text or images
•Popular image file formats
Document digitization
•OCR
•Tokenization – identification of words,
sentences, paragraphs within the document
Taxonomy definition
•What are the target documents?
•What data do you want to
extract?
Manual data extraction
Example based
machine learning
Manual data corrections if
necessary – improves
extraction
Automatic data extraction
Data publishing
Initial Setup
Machine Learning
18
25. Field Types
• Trainable: the filed is always in the document (explicit) , in the same
context.
• Not Explicit – for example Has an Audit :Y/N – Has a Signature (Y/N) –
Has a Signature (Y/N)
25
26. Derived Fields – not trainable – need to write a script
• Need to read the text and determine a Boolean Value
26
27. Need to interpret text and assign code – code field
27
The system cannot be trained for derived fields !!!
31. Table Processing
• One of the most difficult tasks
• There are two table types: Manhattan Tables and Lined Tables
• Need to detect where is the table, the “lines” (vertical and horizontal)
• Extract the info
• Use filters derived from visual perception research (the so called Gabor
filters)
• The table line detection method was developed by Dr. Raul C. Mureşan
and Dr. Vasile Vlad Moca, founders of S.C. Neurodynamics S.R.L., for
Recognos . Both Dr. Mureşan and Dr. Moca have an active neuroscience
research career and are affiliated to the Romanian Institute for Science
and Technology (RIST), studied at Max Planck Institute in Germany.
31
32. What is a Perceptron ? (Wikipedia)
• In machine learning, the perceptron is an algorithm
for supervised learning of binary classifiers: functions that can decide
whether an input (represented by a vector of numbers) belongs to one
class or another. It is a type of linear classifier, i.e. a classification
algorithm that makes its predictions based on a linear predictor
function combining a set of weights with the feature vector. The algorithm
allows for online learning, in that it processes elements in the training set
one at a time.
32
35. How to measure the performance of the extraction process
• Not a simple problem
• Multiple error types
• Language
• OCR quality – language dependent
• OCR – open source, paid (Omni Page, Tesseract)
35
36. What will be reported
• True Positives
A true positive is a value that was extracted by ETI and was confirmed by the DA
as correct.
• False Positives
False positives are values identified by ETI but corrected by the DA.
• True Negatives
True negatives are values that were not found by ETI and the DA confirms that the
value for that specific filed in the taxonomy is not present in the document. It can
be either left empty by the analyst or it can be manually input without a reference
in the document.
• False Negatives
False negatives are values that ETI did not find in the document but the DA inputs
the values and adds a reference in the document.
37. The system EPI – Extraction Performance Indicators
– Precision
The precision of the data extraction will tell us how many of the identified values are correct from the total number of
values extracted.
𝑃𝑟𝑒𝑐𝑖𝑠𝑖𝑜𝑛 =
𝑟𝑒𝑙𝑒𝑣𝑎𝑛𝑡 𝑣𝑎𝑙𝑢𝑒𝑠
𝑡𝑜𝑡𝑎𝑙 𝑛𝑢𝑚𝑏𝑒𝑟 𝑜𝑓 𝑟𝑒𝑡𝑟𝑖𝑒𝑣𝑒𝑑 𝑣𝑎𝑙𝑢𝑒𝑠
=
𝑇𝑃
𝑇𝑃 + 𝐹𝑃
The correct values are the TP, while the total values are TP + FP (correct and incorrect).
– Sensitivity
The sensitivity will tell us how many correct values we retrieved from the total values that could have been extracted.
𝑆𝑒𝑛𝑠𝑖𝑡𝑖𝑣𝑖𝑡𝑦 =
𝑟𝑒𝑙𝑒𝑣𝑎𝑛𝑡 𝑣𝑎𝑙𝑢𝑒𝑠
𝑡𝑜𝑡𝑎𝑙 𝑛𝑢𝑚𝑏𝑒𝑟 𝑜𝑓 𝑣𝑎𝑙𝑢𝑒𝑠 𝑒𝑥𝑖𝑠𝑡𝑖𝑛𝑔 𝑖𝑛 𝑡ℎ𝑒 𝑑𝑜𝑐𝑢𝑚𝑒𝑛𝑡
=
𝑇𝑃
𝑇𝑃 + 𝐹𝑁
The correct values are the TP, while the total values in the document are TP + FN. As defined above FN are the values
that the system identified as missing but the DA found the in the document.
– Accuracy
The Precision and Sensitivity deal only with the extracted values, and do not take into account the values that are really
missing and the system correctly reports them as missing. Accuracy is the EPI that tells us how correct the system
identifies ALL values, both existing and missing.
𝐴𝑐𝑐𝑢𝑟𝑎𝑐𝑦 =
𝐶𝑜𝑟𝑟𝑒𝑐𝑡𝑙𝑦 𝑖𝑑𝑒𝑛𝑡𝑖𝑓𝑖𝑒𝑑 𝑣𝑎𝑙𝑢𝑒𝑠
𝑇𝑜𝑡𝑎𝑙 𝑛𝑢𝑚𝑏𝑒𝑟 𝑜𝑓 𝑣𝑎𝑙𝑢𝑒𝑠
=
𝑇𝑃 + 𝑇𝑁
𝑇𝑃 + 𝑇𝑁 + 𝐹𝑃 + 𝐹𝑁
The correctly extracted values are both TP and TN while the total number is the sum of all four measurements.
39. US Mutual Fund Data–from documents to analytics (www.rdcmf.com)
39
40. Data Teams
40
• Need to create data teams
• Data Analysts - responsible with the taxonomies – mapping
• Validation rules
• Manual intervention decreases in time
44. Content is Not Classifiable by keywords – not consistent
• Ontology based classification, extraction
• What is an ontology ?
• RDF
• SPARQL
• Used in Data Integration (Same As)
• We can query Unstructured, Semi Structured and Structured with the
same query language
44
45. A few semantic terms….
• RDF
• Ontology - OWL
• Linked Data
• Schema.org - Google
• Data.gov
• Data.uk
45
47. 6/30/2016 47
Building Block RDF
“There is a Person identified by http://www.w3.org/People/EM/contact#me, whose name
is Eric Miller, whose email address is em@w3.org, and whose title is Dr.".
Triplets:
(i) http://www.w3.org/People/EM/contact#me,
http://www.w3.org/2000/10/swap/pim/contact#fullNa
me, "Eric Miller"
(ii) http://www.w3.org/People/EM/contact#me,
http://www.w3.org/2000/10/swap/pim/contact#person
alTitle, "Dr."
(iii) http://www.w3.org/People/EM/contact#me,
http://www.w3.org/1999/02/22-rdf-syntax-ns#type,
http://www.w3.org/2000/10/swap/pim/contact#Person
(iv) http://www.w3.org/People/EM/contact#me,
http://www.w3.org/2000/10/swap/pim/contact#mailbo
x, em@w3.org
63. Onboarding ETI or SDP
• Need to designate a “data Shepherd”
• The data sources need to be analyzed by a business expert (know what
data is where) – bad practice example
• Meta data governance is very important (taxonomies, ontologies)
• Gradually develop the ontology – not at once
• Needs a champion in the enterprise, the beginning is hard
• Work hand in hand with Data Analytics people
• Start small and measure the ROI
• Will have to find the “we don’t know what we don’t know” facts….
63
65. What does Recognos have
• ETI – Human in the Loop Machine learning Extraction Platform
• Deployment
– The Data - Subscription
– Licensing – on premises – on boarding – training – support
– On the Cloud – delivery on Q2
• Smart Data Platform – depends on every environment – analysis is
needed – on boarding requires consulting
65
66. About Recognos
• Recognos Inc. - California based company – established in 1999
• Has a partner company in New York – Recognos Financial
• Recognos has a development company in Cluj Romania – 80 developers
– established in 2000
• From 2008 – Involved in Semantics
• Main customers – Fisher Investments, DTCC - NY, Clarient - NY, DST,
Bank of Transylvania, OSF Budapest
• About 50% of the revenue through licensing and recurring data contracts
66
68. Next Steps
• Proof of Concept (PoC)
– We will sign an NDA as needed
– We will import your documents
– We will show you the power and ease of use of Recognos solution
• Pilot project
– We will work with you on an ROI centric project
68