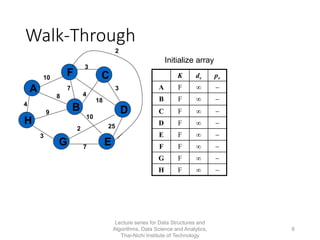
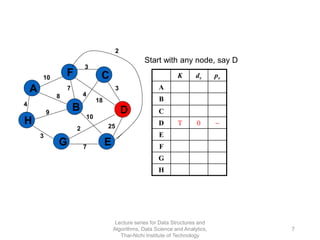
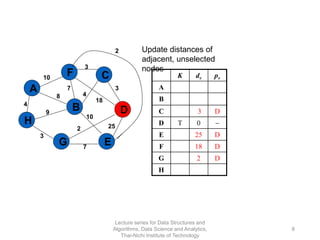
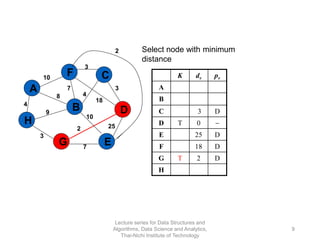
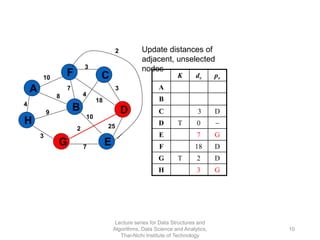
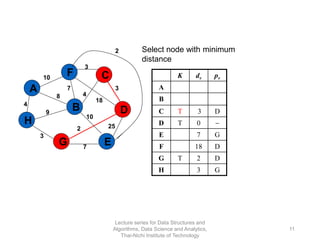
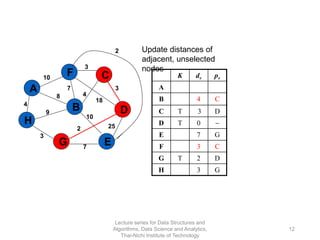
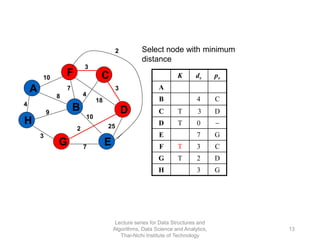
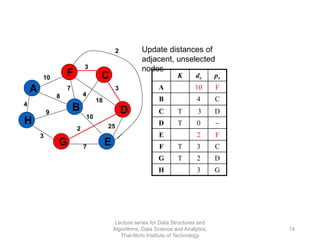
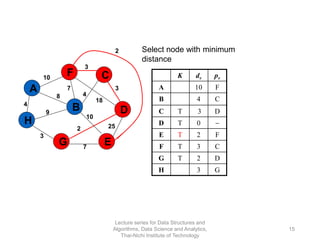
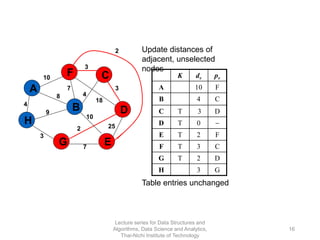
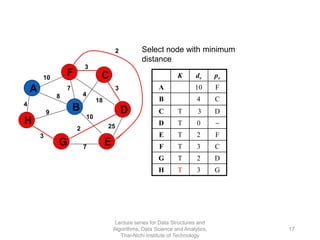
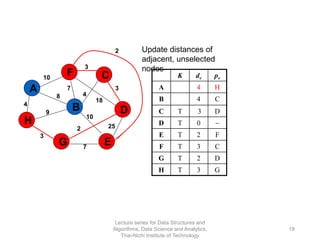
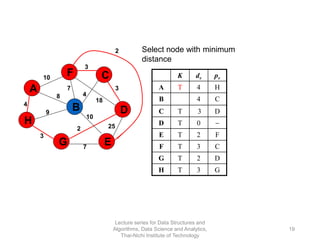
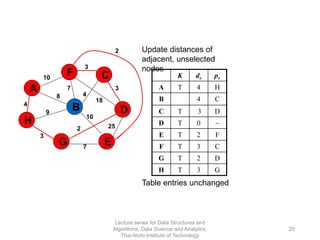
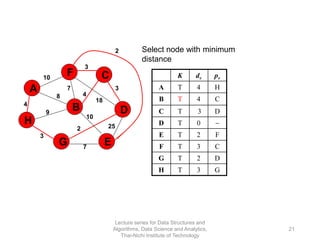
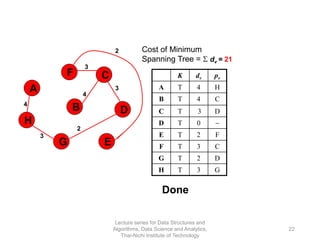
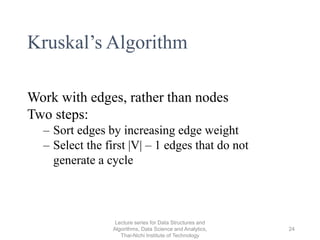
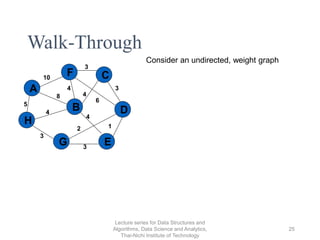
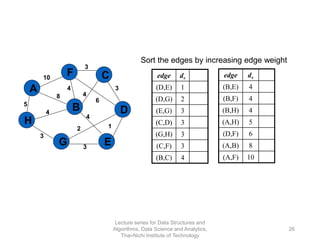
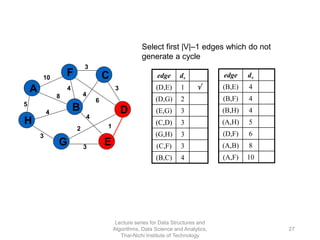
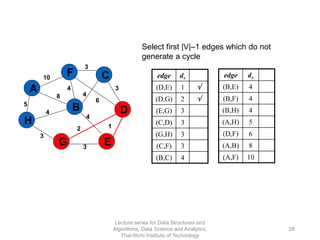
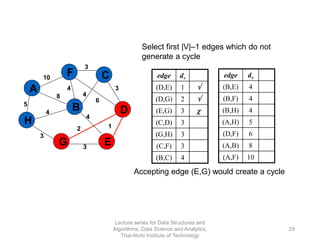
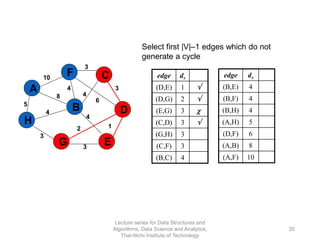
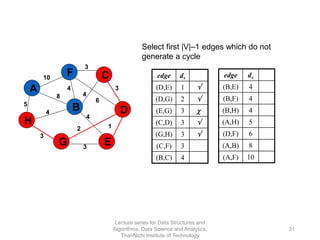
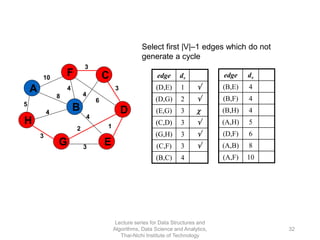
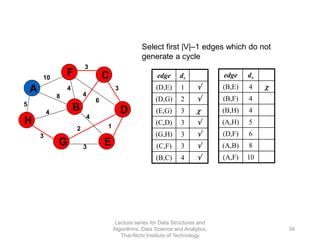
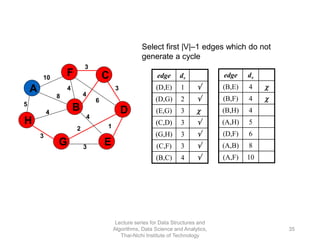
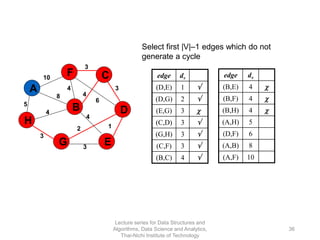
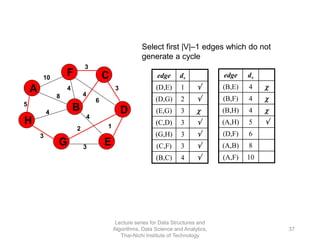
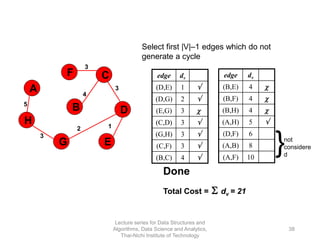
The document discusses minimum spanning trees and provides examples of Prim's and Kruskal's algorithms. It includes:
- A definition of minimum spanning tree as a subgraph that spans all nodes with minimum total edge weight.
- Characteristics of Prim's and Kruskal's algorithms such as working with undirected, weighted/unweighted graphs and producing optimal solutions greedily.
- A walk-through example of Prim's algorithm on a graph and calculating the minimum spanning tree cost.
Tech Jobs Interviews Preparation - GeekGap Webinar #1
Part 1 - Algorithms & Data Structures
What is an algorithm?
What is a data structure (DS)?
Why study algorithms & DS?
How to assess good algorithms?
Algorithm & DS interviews structure
Case study: Binary Search
2 Binary Search variants
Part 2 - System Design
What is system design?
Why study system design?
System design interviews structure
Case study: ERD with Lucidchart
Demo Time: SQLAlchemy
Githu Repo: http://bit.ly/gg-io-webinar-1-github
by www.geekgap.io
Recommendation algorithm using reinforcement learningArithmer Inc.
Slide for study session given by Lu Juanjuan at Arithmer inc.
It is a summary of recent methods for recommendation system using reinforcement learning.
Arithmer株式会社は東京大学大学院数理科学研究科発の数学の会社です。私達は現代数学を応用して、様々な分野のソリューションに、新しい高度AIシステムを導入しています。AIをいかに上手に使って仕事を効率化するか、そして人々の役に立つ結果を生み出すのか、それを考えるのが私たちの仕事です。
Arithmer began at the University of Tokyo Graduate School of Mathematical Sciences. Today, our research of modern mathematics and AI systems has the capability of providing solutions when dealing with tough complex issues. At Arithmer we believe it is our job to realize the functions of AI through improving work efficiency and producing more useful results for society.
This is slides used at Arithmer seminar given by Dr. Masaaki Uesaka at Arithmer inc.
It is a summary of recent methods for quality assurance of machine learning model.
Arithmer Seminar is weekly held, where professionals from within our company give lectures on their respective expertise.
Arithmer株式会社は東京大学大学院数理科学研究科発の数学の会社です。私達は現代数学を応用して、様々な分野のソリューションに、新しい高度AIシステムを導入しています。AIをいかに上手に使って仕事を効率化するか、そして人々の役に立つ結果を生み出すのか、それを考えるのが私たちの仕事です。
Arithmer began at the University of Tokyo Graduate School of Mathematical Sciences. Today, our research of modern mathematics and AI systems has the capability of providing solutions when dealing with tough complex issues. At Arithmer we believe it is our job to realize the functions of AI through improving work efficiency and producing more useful results for society.
Semantics2018 Zhang,Petrak,Maynard: Adapted TextRank for Term Extraction: A G...Johann Petrak
Slides for the talk about the paper:
Ziqi Zhang, Johann Petrak and Diana Maynard, 2018: Adapted TextRank for Term Extraction: A Generic Method of Improving Automatic Term Extraction Algorithms. Semantics-2018, Vienna, Austria
Shou-de Lin is currently a full professor in the CSIE department of National Taiwan University. He holds a BS in EE department from National Taiwan University, an MS-EE from the University of Michigan, and an MS in Computational Linguistics and PhD in Computer Science both from the University of Southern California. He leads the Machine Discovery and Social Network Mining Lab in NTU. Before joining NTU, he was a post-doctoral research fellow at the Los Alamos National Lab. Prof. Lin's research includes the areas of machine learning and data mining, social network analysis, and natural language processing. His international recognition includes the best paper award in IEEE Web Intelligent conference 2003, Google Research Award in 2007, Microsoft research award in 2008, merit paper award in TAAI 2010, best paper award in ASONAM 2011, US Aerospace AFOSR/AOARD research award winner for 5 years. He is the all-time winners in ACM KDD Cup, leading or co-leading the NTU team to win 5 championships. He also leads a team to win WSDM Cup 2016 Champion. He has served as the senior PC for SIGKDD and area chair for ACL. He is currently the associate editor for International Journal on Social Network Mining, Journal of Information Science and Engineering, and International Journal of Computational Linguistics and Chinese Language Processing. He receives the Young Scholars' Creativity Award from Foundation for the Advancement of Outstanding Scholarship and Ta-You Wu Memorial Award.
Machine Learning and Model-Based Optimization for Heterogeneous Catalyst Desi...Ichigaku Takigawa
2nd ICReDD International Symposium—Toward Interdisciplinary Research Guided by Theory and Calculation
Nov. 27 (wed) - Nov. 29 (fri), 2019
https://www.icredd.hokudai.ac.jp/event/1229
Ranking and Diversity in Recommendations - RecSys Stammtisch at SoundCloud, B...Alexandros Karatzoglou
Slides from my talk at the RecSys Stammtisch at SoundCloud in Berlin. The presentation is split in two part one focusing on ranking and relevance and one on diversity and how to achieve it using genres. We introduce a novel diversity metric called Binomial Diversity.
Top-K Dominating Queries on Incomplete Data with Prioritiesijtsrd
Top-K dominating query returns the k objects that are dominated in a dataset. Finding dominated elements on incomplete dataset is more complicated than in case of complete dataset. In the real- time datasets the dataset can be incomplete due to various reasons such as data loss, privacy preservation or awareness problem etc. In this paper we aims to find top-k elements from an incomplete dataset by providing priority values to each dimension in the data object. Skyline based algorithm is applied for that purpose. Since the priority value is used while determining the dominance this method return the most suitable and efficient result than other previous methods. The output will be more preferable according to the users purpose. Dr. Prabha Shreeraj Nair | Prof. Dr. G. K. Awari"Top-K Dominating Queries on Incomplete Data with Priorities" Published in International Journal of Trend in Scientific Research and Development (ijtsrd), ISSN: 2456-6470, Volume-2 | Issue-1 , December 2017, URL: http://www.ijtsrd.com/papers/ijtsrd7056.pdf http://www.ijtsrd.com/computer-science/other/7056/top-k-dominating-queries-on-incomplete--data-with-priorities/dr-prabha-shreeraj-nair
DES irrespective of its small key size, it has been considered to be strong design cipher till today. Designers of DES guaranteed a security margin of 2 power 56. If any attack which is essentially better than 2 power 56 search then that considered to be attack. To crack DES attackers need to spend $ 220000 so that the key can be revealed in 56 hours. But for digital transactions if the key can expire for less than 5 minutes it’s difficult to crack. If this is the case with DES then it will be much more difficult to break Triple DES, which uses 112 bits of key size. The problem with Triple DES is having more rounds, which takes more processing time and space. Not only cryptography, even Light Weight Cryptography needs low processing time and space. Hence a new algorithm named ternary DES is proposed which requires only 56-bit key and 16 rounds. Ternary DES has the advantage of DES with the same key space and number of rounds, and advantage of Triple DES with difficult to break. To propose new algorithms for solving security issues many constraints we need to take into account. With one algorithm we can solve one or a few issues but not all.
Slides were formed by referring to the text Machine Learning by Tom M Mitchelle (Mc Graw Hill, Indian Edition) and by referring to Video tutorials on NPTEL
FAST Approaches to Scalable Similarity-based Test Case Prioritizationbrenoafmiranda
Many test case prioritization criteria have been proposed for speeding up fault detection. Among them, similarity-based approaches give priority to the test cases that are the most dissimilar from those already selected. However, the proposed criteria do not scale up to handle the many thousands or even some millions test suite sizes of modern industrial systems and simple heuristics are used instead. We introduce the FAST family of test case prioritization techniques that radically changes this landscape by borrowing algorithms commonly exploited in the big data domain to find similar items. FAST techniques provide scalable similarity-based test case prioritization in both white-box and black-box fashion. The results from experimentation on real world C and Java subjects show that the fastest members of the family outperform other black-box approaches in efficiency with no significant impact on effectiveness, and also outperform white-box approaches, including greedy ones, if preparation time is not counted. A simulation study of scalability shows that one FAST technique can prioritize a million test cases in less than 20 minutes.
Hybrid predictive modelling of geometry with limited data in cold spray addit...Daiki Ikeuchi
Cold spray additive manufacturing is an emerging technology that offers unique advantages, including high production rate, unlimited product size and the ability to process oxygen-sensitive materials. However, dimensional control and accuracy in cold spray additive manufacturing are challenging, which limits its integration into commercial manufacturing systems. These problems originate from the poor understanding of the complex relationship between process parameters and the resulting fabricated geometry. This knowledge gap motivated the development of an accurate predictive model for the geometry of a cold spray track profile to overcome the problems. Recently, a machine learning approach has gained interest in developing the predictive model of such a complex additive manufacturing process due to its superior nonlinear mapping capability, as seen in other manufacturing applications. Nevertheless, such a mapping capability can be realised only with a large amount of experimental data which is often impractical to collect in additive manufacturing applications. This limited data issue has motivated the exploration of a data-efficient machine learning approach suitable for complex process modelling with limited data. Therefore, the objective of this study was to investigate a data- efficient machine learning approach to geometry prediction in cold spray additive manufacturing. The proposed approach was of hybrid modelling framework, incorporating a conventional mathematical Gaussian model into the development and learning process of a data-driven model. We compared to purely mathematical Gaussian and data-driven modelling results and showed that the proposed hybrid modelling approach provided improved predictive accuracy. The findings can contribute to the control and optimisation of the process for shorter production time and the development of build strategy for better as-fabricated surface and dimensional quality control. The approach in this study is also applicable in other deposition-based additive manufacturing technologies such as Wire and Arc Additive Manufacturing.
ChatGPT
Data analysis is the process of inspecting, cleaning, transforming, and modeling data to discover useful information, draw conclusions, and support decision-making. It involves applying various techniques and methods to extract insights from data sets, often with the goal of uncovering patterns, trends, relationships, or making predictions.
Here's an overview of the key steps and techniques involved in data analysis:
Data Collection: The first step in data analysis is gathering relevant data from various sources. This can include structured data from databases, spreadsheets, or surveys, as well as unstructured data such as text documents, social media posts, or sensor readings.
Data Cleaning and Preprocessing: Once the data is collected, it often needs to be cleaned and preprocessed to ensure its quality and suitability for analysis. This involves handling missing values, removing duplicates, addressing inconsistencies, and transforming data into a suitable format for analysis.
Exploratory Data Analysis (EDA): EDA involves examining and understanding the data through summary statistics, visualizations, and statistical techniques. It helps identify patterns, distributions, outliers, and potential relationships between variables. EDA also helps in formulating hypotheses and guiding further analysis.
Data Modeling and Statistical Analysis: In this step, various statistical techniques and models are applied to the data to gain deeper insights. This can include descriptive statistics, inferential statistics, hypothesis testing, regression analysis, time series analysis, clustering, classification, and more. The choice of techniques depends on the nature of the data and the research questions being addressed.
Data Visualization: Data visualization plays a crucial role in data analysis. It involves creating meaningful and visually appealing representations of data through charts, graphs, plots, and interactive dashboards. Visualizations help in communicating insights effectively and spotting trends or patterns that may be difficult to identify in raw data.
Interpretation and Conclusion: Once the analysis is performed, the findings need to be interpreted in the context of the problem or research objectives. Conclusions are drawn based on the results, and recommendations or insights are provided to stakeholders or decision-makers.
Reporting and Communication: The final step is to present the results and findings of the data analysis in a clear and concise manner. This can be in the form of reports, presentations, or interactive visualizations. Effective communication of the analysis results is crucial for stakeholders to understand and make informed decisions based on the insights gained.
Data analysis is widely used in various fields, including business, finance, marketing, healthcare, social sciences, and more. It plays a crucial role in extracting value from data, supporting evidence-based decision-making, and driving actionable insig
⭐⭐⭐⭐⭐ Device Free Indoor Localization in the 28 GHz band based on machine lea...Victor Asanza
By exploiting the received power change in a communication link produced by the presence of a human body in an otherwise empty room, this work evaluates indoor free device localization methods in the 28 GHz band using machine learning techniques. For this objective, a database is built using results from ray tracing simulations of a system comprised of 4 receivers and up to 2 transmitters, while a person is standing within the room. Transmitters are equipped with uniform linear arrays that switch their main beams sequentially at 21 angles, whereas the receivers operate with omnidirectional antennas. Statistical localization error reduction of at least 16% over a global-based classification technique can be obtained through the combination of two independent classifiers using one transmitter and a reduction of at least 19% for 2 transmitters. An additional improvement is achieved by combining each independent classifier with a regression algorithm. Results also suggest that the number of examples per class and size of the blocks (strips) in which the study area is partitioned play a role in the localization error.
Similar to Data Structures and Algorithm - Week 8 - Minimum Spanning Trees (20)
As Europe's leading economic powerhouse and the fourth-largest hashtag#economy globally, Germany stands at the forefront of innovation and industrial might. Renowned for its precision engineering and high-tech sectors, Germany's economic structure is heavily supported by a robust service industry, accounting for approximately 68% of its GDP. This economic clout and strategic geopolitical stance position Germany as a focal point in the global cyber threat landscape.
In the face of escalating global tensions, particularly those emanating from geopolitical disputes with nations like hashtag#Russia and hashtag#China, hashtag#Germany has witnessed a significant uptick in targeted cyber operations. Our analysis indicates a marked increase in hashtag#cyberattack sophistication aimed at critical infrastructure and key industrial sectors. These attacks range from ransomware campaigns to hashtag#AdvancedPersistentThreats (hashtag#APTs), threatening national security and business integrity.
🔑 Key findings include:
🔍 Increased frequency and complexity of cyber threats.
🔍 Escalation of state-sponsored and criminally motivated cyber operations.
🔍 Active dark web exchanges of malicious tools and tactics.
Our comprehensive report delves into these challenges, using a blend of open-source and proprietary data collection techniques. By monitoring activity on critical networks and analyzing attack patterns, our team provides a detailed overview of the threats facing German entities.
This report aims to equip stakeholders across public and private sectors with the knowledge to enhance their defensive strategies, reduce exposure to cyber risks, and reinforce Germany's resilience against cyber threats.
Levelwise PageRank with Loop-Based Dead End Handling Strategy : SHORT REPORT ...Subhajit Sahu
Abstract — Levelwise PageRank is an alternative method of PageRank computation which decomposes the input graph into a directed acyclic block-graph of strongly connected components, and processes them in topological order, one level at a time. This enables calculation for ranks in a distributed fashion without per-iteration communication, unlike the standard method where all vertices are processed in each iteration. It however comes with a precondition of the absence of dead ends in the input graph. Here, the native non-distributed performance of Levelwise PageRank was compared against Monolithic PageRank on a CPU as well as a GPU. To ensure a fair comparison, Monolithic PageRank was also performed on a graph where vertices were split by components. Results indicate that Levelwise PageRank is about as fast as Monolithic PageRank on the CPU, but quite a bit slower on the GPU. Slowdown on the GPU is likely caused by a large submission of small workloads, and expected to be non-issue when the computation is performed on massive graphs.
Adjusting primitives for graph : SHORT REPORT / NOTESSubhajit Sahu
Graph algorithms, like PageRank Compressed Sparse Row (CSR) is an adjacency-list based graph representation that is
Multiply with different modes (map)
1. Performance of sequential execution based vs OpenMP based vector multiply.
2. Comparing various launch configs for CUDA based vector multiply.
Sum with different storage types (reduce)
1. Performance of vector element sum using float vs bfloat16 as the storage type.
Sum with different modes (reduce)
1. Performance of sequential execution based vs OpenMP based vector element sum.
2. Performance of memcpy vs in-place based CUDA based vector element sum.
3. Comparing various launch configs for CUDA based vector element sum (memcpy).
4. Comparing various launch configs for CUDA based vector element sum (in-place).
Sum with in-place strategies of CUDA mode (reduce)
1. Comparing various launch configs for CUDA based vector element sum (in-place).
Data Centers - Striving Within A Narrow Range - Research Report - MCG - May 2...pchutichetpong
M Capital Group (“MCG”) expects to see demand and the changing evolution of supply, facilitated through institutional investment rotation out of offices and into work from home (“WFH”), while the ever-expanding need for data storage as global internet usage expands, with experts predicting 5.3 billion users by 2023. These market factors will be underpinned by technological changes, such as progressing cloud services and edge sites, allowing the industry to see strong expected annual growth of 13% over the next 4 years.
Whilst competitive headwinds remain, represented through the recent second bankruptcy filing of Sungard, which blames “COVID-19 and other macroeconomic trends including delayed customer spending decisions, insourcing and reductions in IT spending, energy inflation and reduction in demand for certain services”, the industry has seen key adjustments, where MCG believes that engineering cost management and technological innovation will be paramount to success.
MCG reports that the more favorable market conditions expected over the next few years, helped by the winding down of pandemic restrictions and a hybrid working environment will be driving market momentum forward. The continuous injection of capital by alternative investment firms, as well as the growing infrastructural investment from cloud service providers and social media companies, whose revenues are expected to grow over 3.6x larger by value in 2026, will likely help propel center provision and innovation. These factors paint a promising picture for the industry players that offset rising input costs and adapt to new technologies.
According to M Capital Group: “Specifically, the long-term cost-saving opportunities available from the rise of remote managing will likely aid value growth for the industry. Through margin optimization and further availability of capital for reinvestment, strong players will maintain their competitive foothold, while weaker players exit the market to balance supply and demand.”
Data Centers - Striving Within A Narrow Range - Research Report - MCG - May 2...
Data Structures and Algorithm - Week 8 - Minimum Spanning Trees
1. Data Structures and
Algorithms
Week 8: Minimum Spanning Trees
Ferdin Joe John Joseph, PhD
Faculty of Information Technology
Thai-Nichi Institute of Technology, Bangkok
2. Week 8
• Minimum Spanning Trees
• Implementation in Java
Lecture series for Data Structures and
Algorithms, Data Science and Analytics,
Thai-Nichi Institute of Technology
2
3. Definition
• A Minimum Spanning Tree (MST) is a subgraph of
an undirected graph such that the subgraph spans
(includes) all nodes, is connected, is acyclic, and
has minimum total edge weight
Lecture series for Data Structures and
Algorithms, Data Science and Analytics,
Thai-Nichi Institute of Technology
3
4. Algorithm Characteristics
• Both Prim’s and Kruskal’s Algorithms work with
undirected graphs
• Both work with weighted and unweighted graphs but
are more interesting when edges are weighted
• Both are greedy algorithms that produce optimal
solutions
Lecture series for Data Structures and
Algorithms, Data Science and Analytics,
Thai-Nichi Institute of Technology
4
5. Prim’s Algorithm
Lecture series for Data Structures and
Algorithms, Data Science and Analytics,
Thai-Nichi Institute of Technology
5
6. Walk-Through
Initialize array
K dv pv
A F ∞ −
B F ∞ −
C F ∞ −
D F ∞ −
E F ∞ −
F F ∞ −
G F ∞ −
H F ∞ −
4
25
A
H
B
F
E
D
C
G 7
2
10
18
3
4
3
7
8
9
3
10
2
Lecture series for Data Structures and
Algorithms, Data Science and Analytics,
Thai-Nichi Institute of Technology
6
8. 4
25
A
H
B
F
E
D
C
G 7
2
10
18
3
4
3
7
8
9
3
10
Update distances of
adjacent, unselected
nodes
K dv pv
A
B
C 3 D
D T 0 −
E 25 D
F 18 D
G 2 D
H
2
Lecture series for Data Structures and
Algorithms, Data Science and Analytics,
Thai-Nichi Institute of Technology
8
9. 4
25
A
H
B
F
E
D
C
G 7
2
10
18
3
4
3
7
8
9
3
10
Select node with minimum
distance
K dv pv
A
B
C 3 D
D T 0 −
E 25 D
F 18 D
G T 2 D
H
2
Lecture series for Data Structures and
Algorithms, Data Science and Analytics,
Thai-Nichi Institute of Technology
9
10. 4
25
A
H
B
F
E
D
C
G 7
2
10
18
3
4
3
7
8
9
3
10
Update distances of
adjacent, unselected
nodes
K dv pv
A
B
C 3 D
D T 0 −
E 7 G
F 18 D
G T 2 D
H 3 G
2
Lecture series for Data Structures and
Algorithms, Data Science and Analytics,
Thai-Nichi Institute of Technology
10
11. 4
25
A
H
B
F
E
D
C
G 7
2
10
18
3
4
3
7
8
9
3
10
Select node with minimum
distance
K dv pv
A
B
C T 3 D
D T 0 −
E 7 G
F 18 D
G T 2 D
H 3 G
2
Lecture series for Data Structures and
Algorithms, Data Science and Analytics,
Thai-Nichi Institute of Technology
11
12. 4
25
A
H
B
F
E
D
C
G 7
2
10
18
3
4
3
7
8
9
3
10
Update distances of
adjacent, unselected
nodes
K dv pv
A
B 4 C
C T 3 D
D T 0 −
E 7 G
F 3 C
G T 2 D
H 3 G
2
Lecture series for Data Structures and
Algorithms, Data Science and Analytics,
Thai-Nichi Institute of Technology
12
13. 4
25
A
H
B
F
E
D
C
G 7
2
10
18
3
4
3
7
8
9
3
10
Select node with minimum
distance
K dv pv
A
B 4 C
C T 3 D
D T 0 −
E 7 G
F T 3 C
G T 2 D
H 3 G
2
Lecture series for Data Structures and
Algorithms, Data Science and Analytics,
Thai-Nichi Institute of Technology
13
14. 4
25
A
H
B
F
E
D
C
G 7
2
10
18
3
4
3
7
8
9
3
10
Update distances of
adjacent, unselected
nodes
K dv pv
A 10 F
B 4 C
C T 3 D
D T 0 −
E 2 F
F T 3 C
G T 2 D
H 3 G
2
Lecture series for Data Structures and
Algorithms, Data Science and Analytics,
Thai-Nichi Institute of Technology
14
15. 4
25
A
H
B
F
E
D
C
G 7
2
10
18
3
4
3
7
8
9
3
10
Select node with minimum
distance
K dv pv
A 10 F
B 4 C
C T 3 D
D T 0 −
E T 2 F
F T 3 C
G T 2 D
H 3 G
2
Lecture series for Data Structures and
Algorithms, Data Science and Analytics,
Thai-Nichi Institute of Technology
15
16. 4
25
A
H
B
F
E
D
C
G 7
2
10
18
3
4
3
7
8
9
3
10
Update distances of
adjacent, unselected
nodes
K dv pv
A 10 F
B 4 C
C T 3 D
D T 0 −
E T 2 F
F T 3 C
G T 2 D
H 3 G
2
Table entries unchanged
Lecture series for Data Structures and
Algorithms, Data Science and Analytics,
Thai-Nichi Institute of Technology
16
17. 4
25
A
H
B
F
E
D
C
G 7
2
10
18
3
4
3
7
8
9
3
10
Select node with minimum
distance
K dv pv
A 10 F
B 4 C
C T 3 D
D T 0 −
E T 2 F
F T 3 C
G T 2 D
H T 3 G
2
Lecture series for Data Structures and
Algorithms, Data Science and Analytics,
Thai-Nichi Institute of Technology
17
18. 4
25
A
H
B
F
E
D
C
G 7
2
10
18
3
4
3
7
8
9
3
10
Update distances of
adjacent, unselected
nodes
K dv pv
A 4 H
B 4 C
C T 3 D
D T 0 −
E T 2 F
F T 3 C
G T 2 D
H T 3 G
2
Lecture series for Data Structures and
Algorithms, Data Science and Analytics,
Thai-Nichi Institute of Technology
18
19. 4
25
A
H
B
F
E
D
C
G 7
2
10
18
3
4
3
7
8
9
3
10
Select node with minimum
distance
K dv pv
A T 4 H
B 4 C
C T 3 D
D T 0 −
E T 2 F
F T 3 C
G T 2 D
H T 3 G
2
Lecture series for Data Structures and
Algorithms, Data Science and Analytics,
Thai-Nichi Institute of Technology
19
20. 4
25
A
H
B
F
E
D
C
G 7
2
10
18
3
4
3
7
8
9
3
10
Update distances of
adjacent, unselected
nodes
K dv pv
A T 4 H
B 4 C
C T 3 D
D T 0 −
E T 2 F
F T 3 C
G T 2 D
H T 3 G
2
Table entries unchanged
Lecture series for Data Structures and
Algorithms, Data Science and Analytics,
Thai-Nichi Institute of Technology
20
21. 4
25
A
H
B
F
E
D
C
G 7
2
10
18
3
4
3
7
8
9
3
10
Select node with minimum
distance
K dv pv
A T 4 H
B T 4 C
C T 3 D
D T 0 −
E T 2 F
F T 3 C
G T 2 D
H T 3 G
2
Lecture series for Data Structures and
Algorithms, Data Science and Analytics,
Thai-Nichi Institute of Technology
21
22. 4
A
H
B
F
E
D
C
G
2
3
4
3
3
Cost of Minimum
Spanning Tree = Σ dv = 21
K dv pv
A T 4 H
B T 4 C
C T 3 D
D T 0 −
E T 2 F
F T 3 C
G T 2 D
H T 3 G
2
Done
Lecture series for Data Structures and
Algorithms, Data Science and Analytics,
Thai-Nichi Institute of Technology
22
24. Kruskal’s Algorithm
Work with edges, rather than nodes
Two steps:
– Sort edges by increasing edge weight
– Select the first |V| – 1 edges that do not
generate a cycle
Lecture series for Data Structures and
Algorithms, Data Science and Analytics,
Thai-Nichi Institute of Technology
24
25. Walk-Through
Consider an undirected, weight graph
5
1
A
H
B
F
E
D
C
G 3
2
4
6
3
4
3
4
8
4
3
10
Lecture series for Data Structures and
Algorithms, Data Science and Analytics,
Thai-Nichi Institute of Technology
25
26. Sort the edges by increasing edge weight
edge dv
(D,E) 1
(D,G) 2
(E,G) 3
(C,D) 3
(G,H) 3
(C,F) 3
(B,C) 4
5
1
A
H
B
F
E
D
C
G 3
2
4
6
3
4
3
4
8
4
3
10 edge dv
(B,E) 4
(B,F) 4
(B,H) 4
(A,H) 5
(D,F) 6
(A,B) 8
(A,F) 10
Lecture series for Data Structures and
Algorithms, Data Science and Analytics,
Thai-Nichi Institute of Technology
26
27. Select first |V|–1 edges which do not
generate a cycle
edge dv
(D,E) 1 √
(D,G) 2
(E,G) 3
(C,D) 3
(G,H) 3
(C,F) 3
(B,C) 4
5
1
A
H
B
F
E
D
C
G 3
2
4
6
3
4
3
4
8
4
3
10 edge dv
(B,E) 4
(B,F) 4
(B,H) 4
(A,H) 5
(D,F) 6
(A,B) 8
(A,F) 10
Lecture series for Data Structures and
Algorithms, Data Science and Analytics,
Thai-Nichi Institute of Technology
27
28. Select first |V|–1 edges which do not
generate a cycle
edge dv
(D,E) 1 √
(D,G) 2 √
(E,G) 3
(C,D) 3
(G,H) 3
(C,F) 3
(B,C) 4
5
1
A
H
B
F
E
D
C
G 3
2
4
6
3
4
3
4
8
4
3
10 edge dv
(B,E) 4
(B,F) 4
(B,H) 4
(A,H) 5
(D,F) 6
(A,B) 8
(A,F) 10
Lecture series for Data Structures and
Algorithms, Data Science and Analytics,
Thai-Nichi Institute of Technology
28
29. Select first |V|–1 edges which do not
generate a cycle
edge dv
(D,E) 1 √
(D,G) 2 √
(E,G) 3 χ
(C,D) 3
(G,H) 3
(C,F) 3
(B,C) 4
5
1
A
H
B
F
E
D
C
G 3
2
4
6
3
4
3
4
8
4
3
10 edge dv
(B,E) 4
(B,F) 4
(B,H) 4
(A,H) 5
(D,F) 6
(A,B) 8
(A,F) 10
Accepting edge (E,G) would create a cycle
Lecture series for Data Structures and
Algorithms, Data Science and Analytics,
Thai-Nichi Institute of Technology
29
30. Select first |V|–1 edges which do not
generate a cycle
edge dv
(D,E) 1 √
(D,G) 2 √
(E,G) 3 χ
(C,D) 3 √
(G,H) 3
(C,F) 3
(B,C) 4
5
1
A
H
B
F
E
D
C
G 3
2
4
6
3
4
3
4
8
4
3
10 edge dv
(B,E) 4
(B,F) 4
(B,H) 4
(A,H) 5
(D,F) 6
(A,B) 8
(A,F) 10
Lecture series for Data Structures and
Algorithms, Data Science and Analytics,
Thai-Nichi Institute of Technology
30
31. Select first |V|–1 edges which do not
generate a cycle
edge dv
(D,E) 1 √
(D,G) 2 √
(E,G) 3 χ
(C,D) 3 √
(G,H) 3 √
(C,F) 3
(B,C) 4
5
1
A
H
B
F
E
D
C
G 3
2
4
6
3
4
3
4
8
4
3
10 edge dv
(B,E) 4
(B,F) 4
(B,H) 4
(A,H) 5
(D,F) 6
(A,B) 8
(A,F) 10
Lecture series for Data Structures and
Algorithms, Data Science and Analytics,
Thai-Nichi Institute of Technology
31
32. Select first |V|–1 edges which do not
generate a cycle
edge dv
(D,E) 1 √
(D,G) 2 √
(E,G) 3 χ
(C,D) 3 √
(G,H) 3 √
(C,F) 3 √
(B,C) 4
5
1
A
H
B
F
E
D
C
G 3
2
4
6
3
4
3
4
8
4
3
10 edge dv
(B,E) 4
(B,F) 4
(B,H) 4
(A,H) 5
(D,F) 6
(A,B) 8
(A,F) 10
Lecture series for Data Structures and
Algorithms, Data Science and Analytics,
Thai-Nichi Institute of Technology
32
33. Select first |V|–1 edges which do not
generate a cycle
edge dv
(D,E) 1 √
(D,G) 2 √
(E,G) 3 χ
(C,D) 3 √
(G,H) 3 √
(C,F) 3 √
(B,C) 4 √
5
1
A
H
B
F
E
D
C
G 3
2
4
6
3
4
3
4
8
4
3
10 edge dv
(B,E) 4
(B,F) 4
(B,H) 4
(A,H) 5
(D,F) 6
(A,B) 8
(A,F) 10
Lecture series for Data Structures and
Algorithms, Data Science and Analytics,
Thai-Nichi Institute of Technology
33
34. Select first |V|–1 edges which do not
generate a cycle
edge dv
(D,E) 1 √
(D,G) 2 √
(E,G) 3 χ
(C,D) 3 √
(G,H) 3 √
(C,F) 3 √
(B,C) 4 √
5
1
A
H
B
F
E
D
C
G 3
2
4
6
3
4
3
4
8
4
3
10 edge dv
(B,E) 4 χ
(B,F) 4
(B,H) 4
(A,H) 5
(D,F) 6
(A,B) 8
(A,F) 10
Lecture series for Data Structures and
Algorithms, Data Science and Analytics,
Thai-Nichi Institute of Technology
34
35. Select first |V|–1 edges which do not
generate a cycle
edge dv
(D,E) 1 √
(D,G) 2 √
(E,G) 3 χ
(C,D) 3 √
(G,H) 3 √
(C,F) 3 √
(B,C) 4 √
5
1
A
H
B
F
E
D
C
G 3
2
4
6
3
4
3
4
8
4
3
10 edge dv
(B,E) 4 χ
(B,F) 4 χ
(B,H) 4
(A,H) 5
(D,F) 6
(A,B) 8
(A,F) 10
Lecture series for Data Structures and
Algorithms, Data Science and Analytics,
Thai-Nichi Institute of Technology
35
36. Select first |V|–1 edges which do not
generate a cycle
edge dv
(D,E) 1 √
(D,G) 2 √
(E,G) 3 χ
(C,D) 3 √
(G,H) 3 √
(C,F) 3 √
(B,C) 4 √
5
1
A
H
B
F
E
D
C
G 3
2
4
6
3
4
3
4
8
4
3
10 edge dv
(B,E) 4 χ
(B,F) 4 χ
(B,H) 4 χ
(A,H) 5
(D,F) 6
(A,B) 8
(A,F) 10
Lecture series for Data Structures and
Algorithms, Data Science and Analytics,
Thai-Nichi Institute of Technology
36
37. Select first |V|–1 edges which do not
generate a cycle
edge dv
(D,E) 1 √
(D,G) 2 √
(E,G) 3 χ
(C,D) 3 √
(G,H) 3 √
(C,F) 3 √
(B,C) 4 √
5
1
A
H
B
F
E
D
C
G 3
2
4
6
3
4
3
4
8
4
3
10 edge dv
(B,E) 4 χ
(B,F) 4 χ
(B,H) 4 χ
(A,H) 5 √
(D,F) 6
(A,B) 8
(A,F) 10
Lecture series for Data Structures and
Algorithms, Data Science and Analytics,
Thai-Nichi Institute of Technology
37
38. Select first |V|–1 edges which do not
generate a cycle
edge dv
(D,E) 1 √
(D,G) 2 √
(E,G) 3 χ
(C,D) 3 √
(G,H) 3 √
(C,F) 3 √
(B,C) 4 √
5
1
A
H
B
F
E
D
C
G
2
3
3
3
edge dv
(B,E) 4 χ
(B,F) 4 χ
(B,H) 4 χ
(A,H) 5 √
(D,F) 6
(A,B) 8
(A,F) 10
Done
Total Cost = Σ dv = 21
4
}not
considere
d
Lecture series for Data Structures and
Algorithms, Data Science and Analytics,
Thai-Nichi Institute of Technology
38