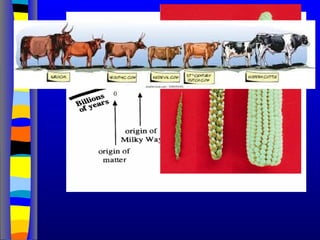
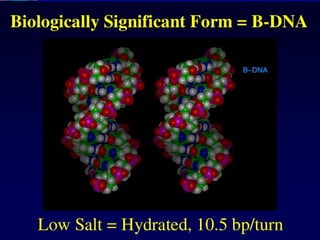
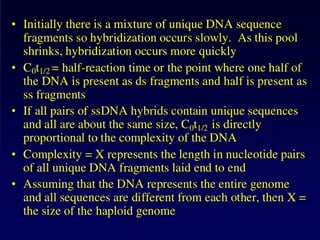
Mandibular prognathism isthe name of
a heritable genetic conditions where
growth of the maxilla (upper jaw) is
retarded with respect to the
the mandible (lower jaw), which results in
a projecting chin, rolled-out lower lip, and
a crossbite of the incisors. The
phenomenon is known as the 'Hapsburg
Lip' because of its occurrence in multiple
generations of members of the European
royal House of Hapsburg, as documented
in their portraits over 200 years [above].
The trait is inherited as a single-
gene autosomal dominant with
incomplete penetrance (~ 0.90), and
shows up frequently because of extensive
intermarriage between different branches
of the family. extensive inbreeding. Queen
Isabella I and King Ferdinand II of Castile
& Aragon, Columbus' patrons on his
voyages to America, are early case. Kings
Charles II and Philip IV of Spain, and
Leopold of Austria, have particularly
prominent cases. It may be assumed that
portrait artists 'improved' the appearance
of their subjects in some cases.
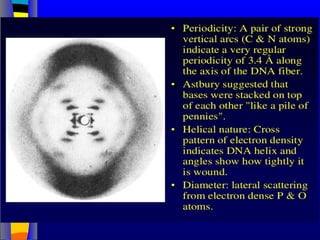
Nucleic acids werefirst observed by the Swiss biochemist
Friedrich Miescher in 1869 (nuclein). But for many years,
researchers did not realize the importance of this molecule. In the
1940’s, experiments by Griffith and Avery/McCarty/MacLeod
showed that information in DNA can be transformed in
Pneumococcus; while Alfred Hershey & Martha Chase showed
that DNA carried the genetic information in bacteriophages. Later,
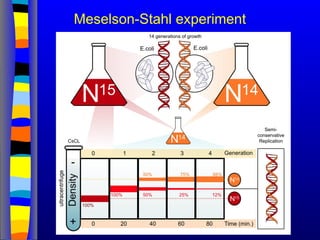
Meselson & Stahl showed that the DNA replicates in a semi-
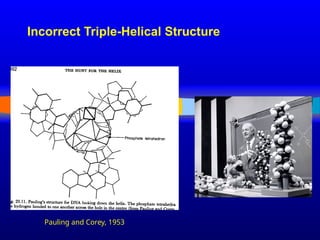
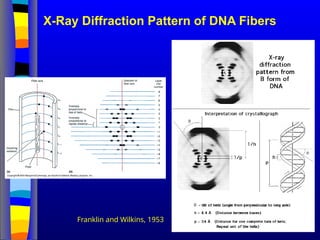
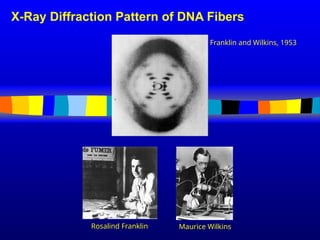
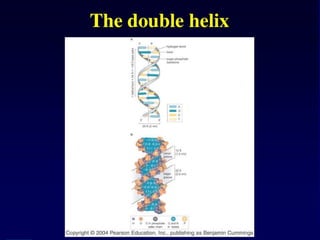
conservative way. It was not until 1953 that James Watson,
Francis Crick, Maurice Wilkins and Rosalind Franklin figured out
the structure of DNA - a double helix - which they realized could
carry biological information. Watson, Crick and Wilkins were
awarded the Nobel Prize in Medicine in 1962 "for their discoveries
concerning the molecular structure of nucleic acids and its
significance for information transfer in living material."
DNA discovery
8.
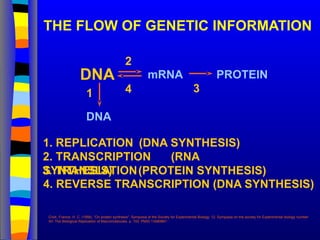
THE FLOW OFGENETIC INFORMATION
DNA mRNA PROTEIN
DNA
1
2
3
4. REVERSE TRANSCRIPTION (DNA SYNTHESIS)
4
1. REPLICATION (DNA SYNTHESIS)
2. TRANSCRIPTION (RNA
SYNTHESIS)
3. TRANSLATION(PROTEIN SYNTHESIS)
Crick, Francis. H. C. (1958). "On protein synthesis". Symposia of the Society for Experimental Biology. 12. Symposia on the society for Experimental biology number
XII: The Biological Replication of Macromolecules. p. 153. PMID 13580867.
9.
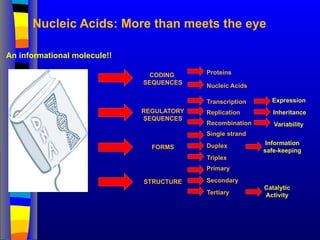
Nucleic Acids: Morethan meets the eye
Proteins
Nucleic Acids
Single strand
Duplex
Triplex
CODING
SEQUENCES
REGULATORY
SEQUENCES
STRUCTURE
FORMS
Primary
Secondary
Tertiary
Catalytic
Activity
Information
safe-keeping
Transcription
Replication
Recombination Variability
Expression
Inheritance
An informational molecule!!
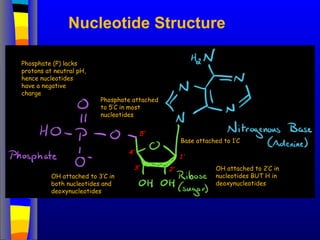
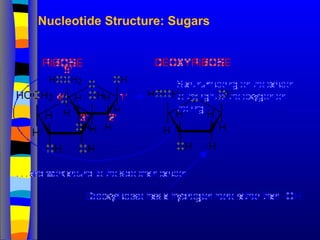
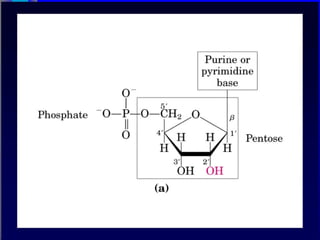
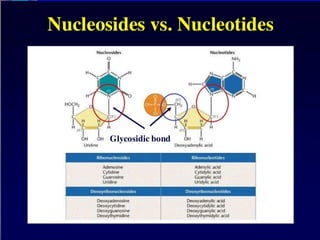
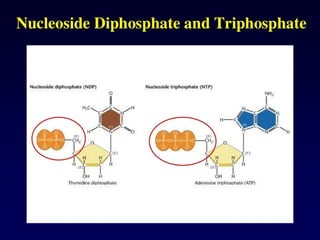
Nucleotide Structure
Phosphate (P)lacks
protons at neutral pH,
hence nucleotides
have a negative
charge
Phosphate attached
to 5’C in most
nucleotides
Base attached to 1’C
OH attached to 3’C in
both nucleotides and
deoxynucleotides
OH attached to 2’C in
nucleotides BUT H in
deoxynucleotides
1’
3’
4’
5’
2’
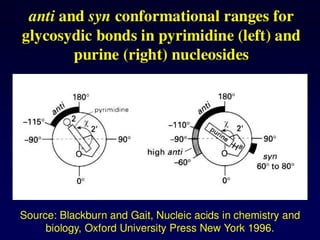
12.
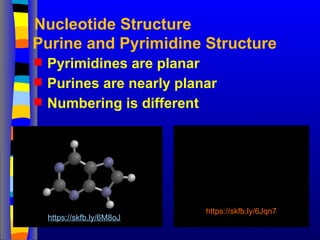
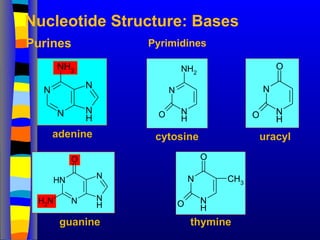
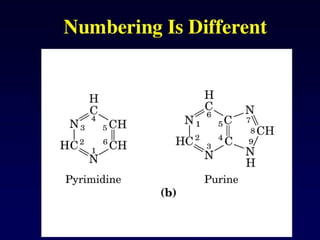
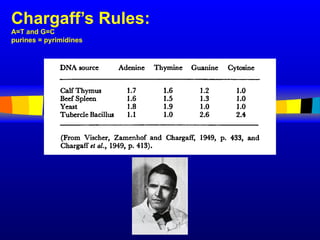
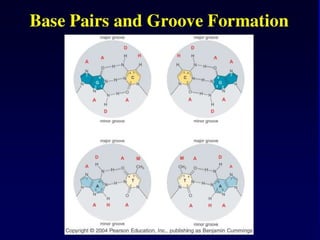
Purine and PyrimidineStructure
Pyrimidines are planar
Purines are nearly planar
Numbering is different
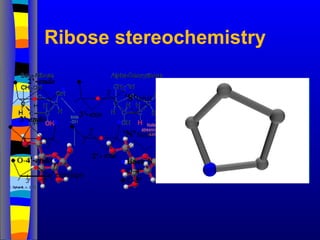
Nucleotide Structure
https://skfb.ly/6M8oJ
https://skfb.ly/6Jqn7
13.
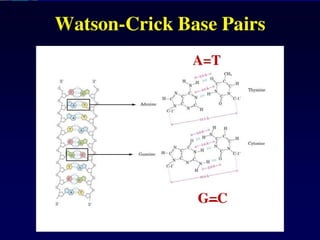
Nucleotide Structure: Bases
N
NN
H
N
NH2
adenine
N
H
N N
H
N
O
N
H2
guanine
N
N
H
O
NH2
N
N
H
O
O
CH3
cytosine uracyl
N
N
H
O
O
thymine
Purines Pyrimidines
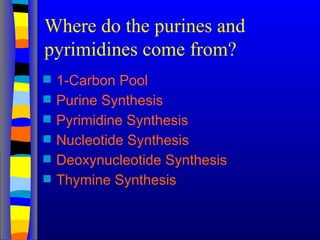
Where do thepurines and
pyrimidines come from?
1-Carbon Pool
Purine Synthesis
Pyrimidine Synthesis
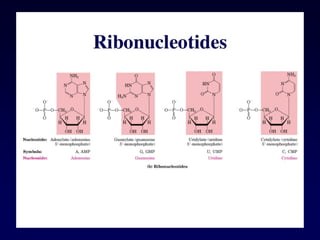
Nucleotide Synthesis
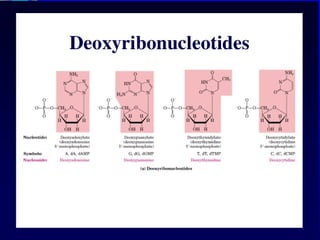
Deoxynucleotide Synthesis
Thymine Synthesis
26.
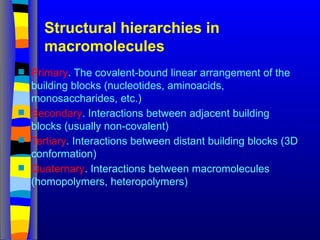
Structural hierarchies in
macromolecules
Primary. The covalent-bound linear arrangement of the
building blocks (nucleotides, aminoacids,
monosaccharides, etc.)
Secondary. Interactions between adjacent building
blocks (usually non-covalent)
Tertiary. Interactions between distant building blocks (3D
conformation)
Quaternary. Interactions between macromolecules
(homopolymers, heteropolymers)
April 25, 1953
MOLECULARSTRUCTURE OF NUCLEIC ACIDS
A Structure for Deoxyribose Nucleic Acid
We wish to suggest a structure for the salt of deoxyribose nucleic acid
(D.N.A.). This structure has novel features which are of considerable
biological interest.
…
It has not escaped our notice that the specific pairing we have postulated
immediately suggests a possible copying mechanism for the genetic
material.
…
J. D. WATSON F. H. C. CRICK
Medical Research Council Unit for the Study of Molecular Structure of
Biological Systems, Cavendish Laboratory, Cambridge.
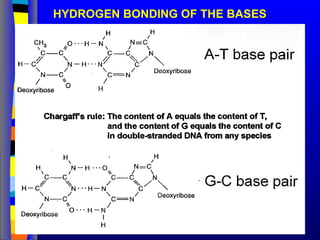
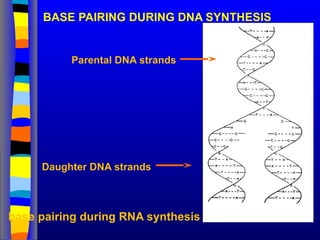
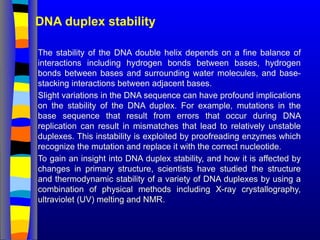
DNA duplex stability
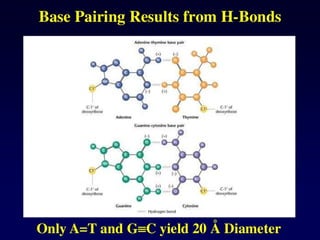
Thestability of the DNA double helix depends on a fine balance of
interactions including hydrogen bonds between bases, hydrogen
bonds between bases and surrounding water molecules, and base-
stacking interactions between adjacent bases.
Slight variations in the DNA sequence can have profound implications
on the stability of the DNA duplex. For example, mutations in the
base sequence that result from errors that occur during DNA
replication can result in mismatches that lead to relatively unstable
duplexes. This instability is exploited by proofreading enzymes which
recognize the mutation and replace it with the correct nucleotide.
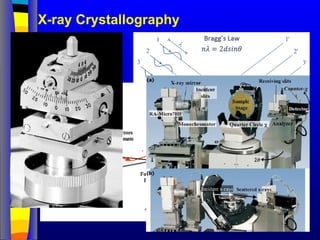
To gain an insight into DNA duplex stability, and how it is affected by
changes in primary structure, scientists have studied the structure
and thermodynamic stability of a variety of DNA duplexes by using a
combination of physical methods including X-ray crystallography,
ultraviolet (UV) melting and NMR.
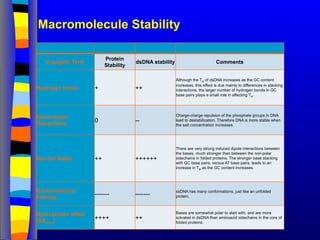
Macromolecule Stability
Energetic Term
Protein
Stability
dsDNAstability Comments
Hydrogen bonds + ++
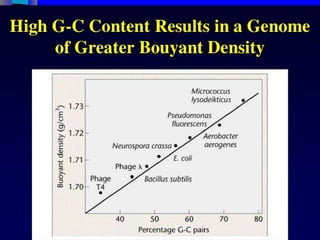
Although the TM of dsDNA increases as the GC content
increases, this effect is due mainly to differences in stacking
interactions, the larger number of hydrogen bonds in GC
base pairs plays a small role in affecting TM.
Electrostatic
interactions
0 --
Charge-charge repulsion of the phosphate groups in DNA
lead to destabilization. Therefore DNA is more stable when
the salt concentration increases.
Van der Waals ++ ++++++
There are very strong induced dipole interactions between
the bases, much stronger than between the non-polar
sidechains in folded proteins. The stronger base stacking
with GC base pairs, versus AT base pairs, leads to an
increase in TM as the GC content increases.
Conformational
Entropy
------- -------
ssDNA has many conformations, just like an unfolded
protein.
Hydrophobic effect
(ΔSwater) ++++ ++
Bases are somewhat polar to start with, and are more
solvated in dsDNA than aminoacid sidechains in the core of
folded proteins.
87.
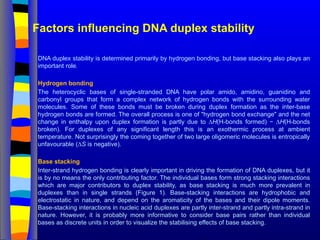
Factors influencing DNAduplex stability
DNA duplex stability is determined primarily by hydrogen bonding, but base stacking also plays an
important role.
Hydrogen bonding
The heterocyclic bases of single-stranded DNA have polar amido, amidino, guanidino and
carbonyl groups that form a complex network of hydrogen bonds with the surrounding water
molecules. Some of these bonds must be broken during duplex formation as the inter-base
hydrogen bonds are formed. The overall process is one of "hydrogen bond exchange" and the net
change in enthalpy upon duplex formation is partly due to ∆H(H-bonds formed) − ∆H(H-bonds
broken). For duplexes of any significant length this is an exothermic process at ambient
temperature. Not surprisingly the coming together of two large oligomeric molecules is entropically
unfavourable (∆S is negative).
Base stacking
Inter-strand hydrogen bonding is clearly important in driving the formation of DNA duplexes, but it
is by no means the only contributing factor. The individual bases form strong stacking interactions
which are major contributors to duplex stability, as base stacking is much more prevalent in
duplexes than in single strands (Figure 1). Base-stacking interactions are hydrophobic and
electrostatic in nature, and depend on the aromaticity of the bases and their dipole moments.
Base-stacking interactions in nucleic acid duplexes are partly inter-strand and partly intra-strand in
nature. However, it is probably more informative to consider base pairs rather than individual
bases as discrete units in order to visualize the stabilising effects of base stacking.
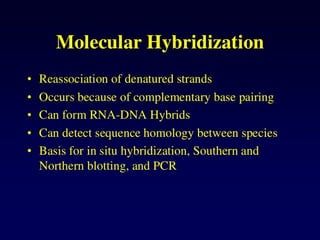
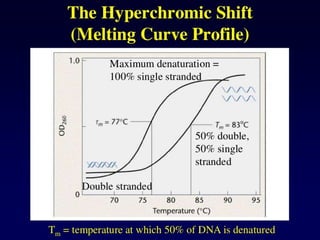
92.
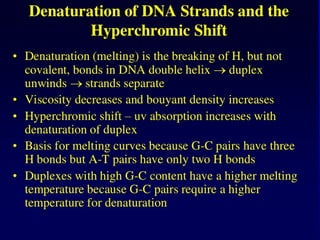
Denaturation of DNA
Double-strandedDNA
A-T rich regions
denature first
Cooperative unwinding
of the DNA strands
Strand separation
and formation of
single-stranded
random coils
Extremes in pH or
high temperature
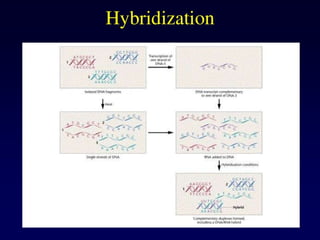
93.
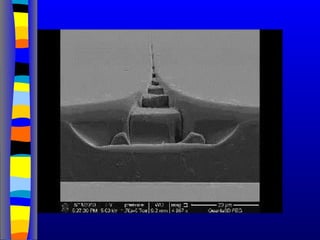
Electron micrograph ofpartially melted DNA
• A-T rich regions melt first, followed by G-C rich regions
Double-stranded, G-C rich
DNA has not yet melted
A-T rich region of DNA
has melted into a
single-stranded bubble
94.
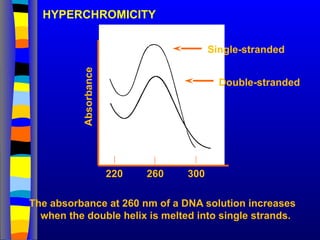
HYPERCHROMICITY
The absorbance at260 nm of a DNA solution increases
when the double helix is melted into single strands.
260
Absorbance
Single-stranded
Double-stranded
220 300
99.
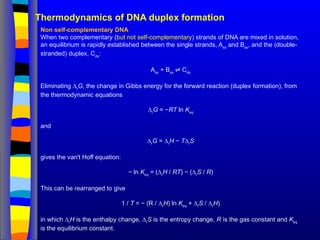
Thermodynamics of DNAduplex formation
Non self-complementary DNA
When two complementary (but not self-complementary) strands of DNA are mixed in solution,
an equilibrium is rapidly established between the single strands, Ass
and Bss
, and the (double-
stranded) duplex, Cds
:
Ass
+ Bss
C
⇌ ds
Eliminating ∆r
G, the change in Gibbs energy for the forward reaction (duplex formation), from
the thermodynamic equations
∆r
G = −RT ln Keq
and
∆r
G = ∆r
H − T∆r
S
gives the van't Hoff equation:
− ln Keq
= (∆r
H / RT) − (∆r
S / R)
This can be rearranged to give
1 / T = − (R / ∆r
H) ln Keq
+ ∆r
S / ∆r
H)
in which ∆r
H is the enthalpy change, ∆r
S is the entropy change, R is the gas constant and Keq
is the equilibrium constant.
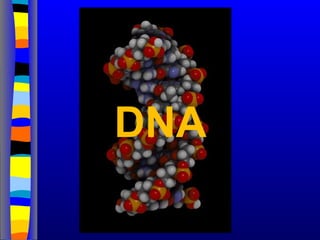
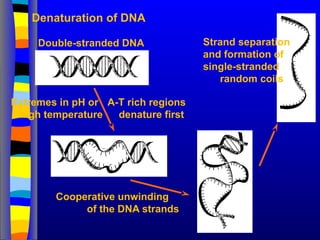
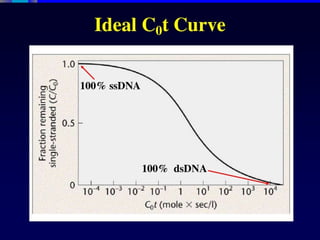
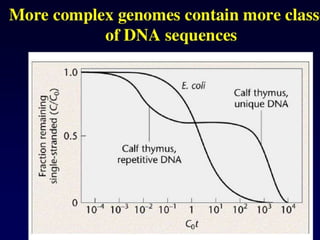
100.
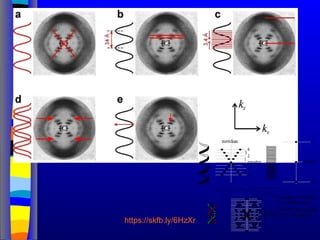
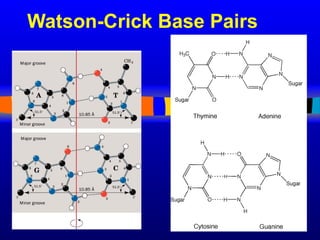
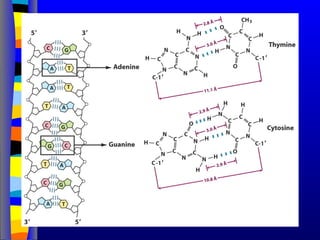
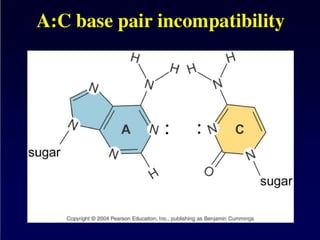
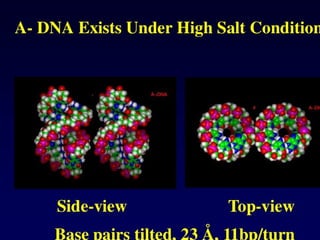
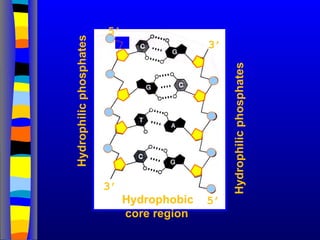
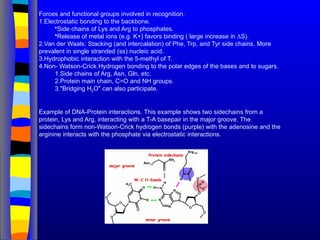
The equilibrium constantKeq
can be written as a function of the extent of
association, α, and of the initial total concentration of single-stranded DNA,
CT
(CT
= [Ass
]initial
+ [Bss
]initial
). At equilibrium there are 1−α moles of Ass
, 1−α
moles of Bss
and α moles of Cds
, so:
Keq
= ([Cds
]eq
/ [Ass
]eq
[Bss
]eq
) = (xC
CT
/ xA
CT
xB
CT
) = 2α / [(1−α)2
CT
]
At the midpoint of the melting curve, α = ½, so
Keq
= (1 / ¼CT
) = (4 / CT
)
therefore
− ln Keq
= − ln (4 / CT
) = ln (CT
/ 4)
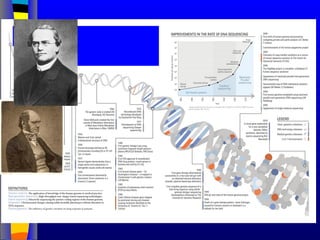
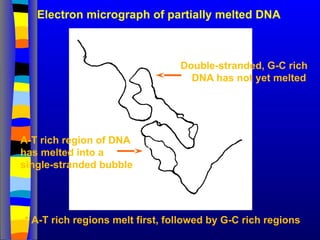
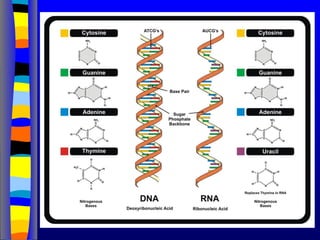
101.
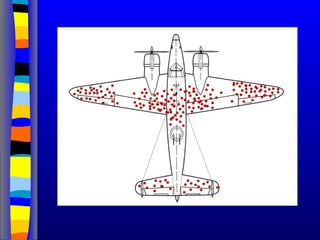
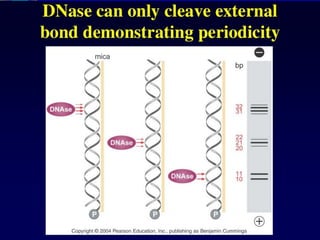
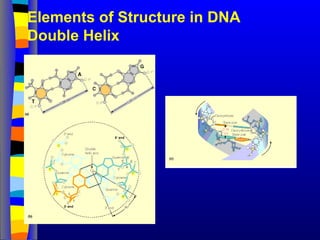
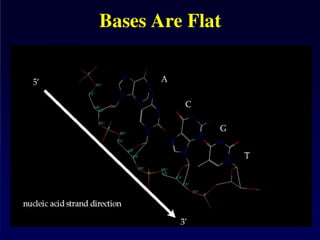
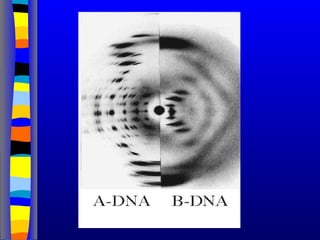
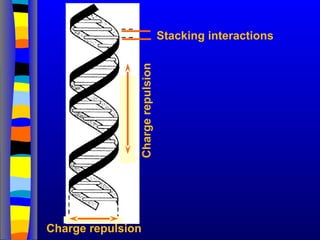
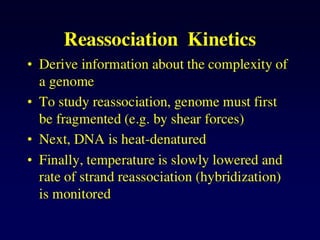
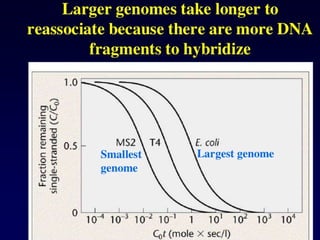
Self-complementary DNA
For self-complementaryDNA, an equilbrium is established in solution
between single-stranded and double-stranded DNA:
2 Ass
C
⇌ ds
As with non self-complementary DNA, the equilibrium constant Keq
can be
written as a function of the extent of association, α, and of the initial
concentration of single-stranded DNA, CT
(CT
= [Ass
]initial
). At equilibrium there
are 1−α moles of Ass
and α moles of Cds
, so
Keq
= ([Cds
]eq
/ [Ass
]eq
2
) = (xC
CT
/ xA
2
CT
2
) = α / [2(1−α)2
CT
]
At the midpoint of the melting curve, α = ½, so
Keq
= (1 / CT
)
therefore
− ln Keq
= − ln (1 / CT
) = ln (CT
)
102.
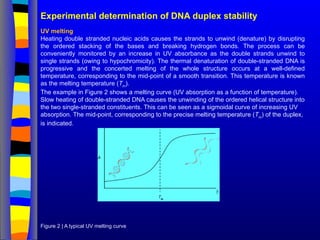
Experimental determination ofDNA duplex stability
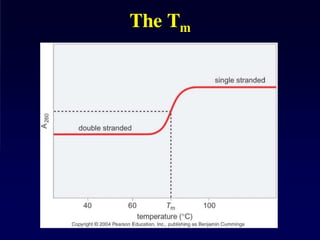
UV melting
Heating double stranded nucleic acids causes the strands to unwind (denature) by disrupting
the ordered stacking of the bases and breaking hydrogen bonds. The process can be
conveniently monitored by an increase in UV absorbance as the double strands unwind to
single strands (owing to hypochromicity). The thermal denaturation of double-stranded DNA is
progressive and the concerted melting of the whole structure occurs at a well-defined
temperature, corresponding to the mid-point of a smooth transition. This temperature is known
as the melting temperature (Tm
).
The example in Figure 2 shows a melting curve (UV absorption as a function of temperature).
Slow heating of double-stranded DNA causes the unwinding of the ordered helical structure into
the two single-stranded constituents. This can be seen as a sigmoidal curve of increasing UV
absorption. The mid-point, corresponding to the precise melting temperature (Tm
) of the duplex,
is indicated.
Figure 2 | A typical UV melting curve
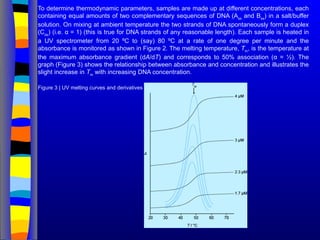
103.
To determine thermodynamicparameters, samples are made up at different concentrations, each
containing equal amounts of two complementary sequences of DNA (Ass
and Bss
) in a salt/buffer
solution. On mixing at ambient temperature the two strands of DNA spontaneously form a duplex
(Cds
) (i.e. α = 1) (this is true for DNA strands of any reasonable length). Each sample is heated in
a UV spectrometer from 20 ºC to (say) 80 ºC at a rate of one degree per minute and the
absorbance is monitored as shown in Figure 2. The melting temperature, Tm
, is the temperature at
the maximum absorbance gradient (dA/dT) and corresponds to 50% association (α = ½). The
graph (Figure 3) shows the relationship between absorbance and concentration and illustrates the
slight increase in Tm
with increasing DNA concentration.
Figure 3 | UV melting curves and derivatives
104.
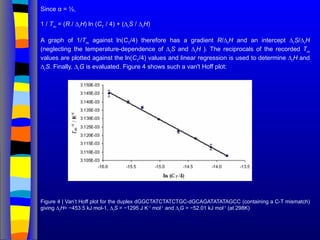
Since α =½,
1 / Tm
= (R / ∆r
H) ln (CT
/ 4) + (∆r
S / ∆r
H)
A graph of 1/Tm
against ln(CT
/4) therefore has a gradient R/∆r
H and an intercept ∆r
S/∆r
H
(neglecting the temperature-dependence of ∆r
S and ∆r
H ). The reciprocals of the recorded Tm
values are plotted against the ln(CT
/4) values and linear regression is used to determine ∆r
H and
∆r
S. Finally, ∆r
G is evaluated. Figure 4 shows such a van't Hoff plot:
Figure 4 | Van’t Hoff plot for the duplex dGGCTATCTATCTGC-dGCAGATATATAGCC (containing a C-T mismatch)
giving ∆r
H= −453.5 kJ mol-1, ∆r
S = −1295 J K-1
mol-1
and ∆r
G = −52.01 kJ mol-1
(at 298K)
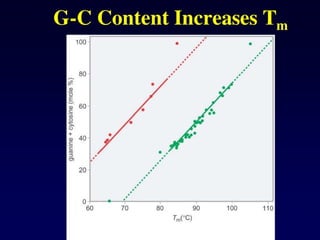
105.
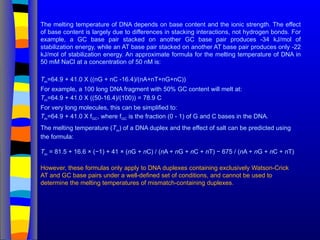
The melting temperatureof DNA depends on base content and the ionic strength. The effect
of base content is largely due to differences in stacking interactions, not hydrogen bonds. For
example, a GC base pair stacked on another GC base pair produces -34 kJ/mol of
stabilization energy, while an AT base pair stacked on another AT base pair produces only -22
kJ/mol of stabilization energy. An approximate formula for the melting temperature of DNA in
50 mM NaCl at a concentration of 50 nM is:
Tm=64.9 + 41.0 X ((nG + nC -16.4)/(nA+nT+nG+nC))
For example, a 100 long DNA fragment with 50% GC content will melt at:
Tm=64.9 + 41.0 X ((50-16.4)/(100)) = 78.9 C
For very long molecules, this can be simplified to:
Tm=64.9 + 41.0 X fGC, where fGC is the fraction (0 - 1) of G and C bases in the DNA.
The melting temperature (Tm
) of a DNA duplex and the effect of salt can be predicted using
the formula:
Tm
= 81.5 + 16.6 × (−1) + 41 × (nG + nC) / (nA + nG + nC + nT) − 675 / (nA + nG + nC + nT)
However, these formulas only apply to DNA duplexes containing exclusively Watson-Crick
AT and GC base pairs under a well-defined set of conditions, and cannot be used to
determine the melting temperatures of mismatch-containing duplexes.
106.
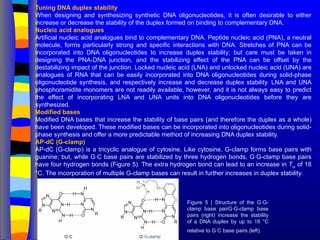
Tuning DNA duplexstability
When designing and synthesizing synthetic DNA oligonucleotides, it is often desirable to either
increase or decrease the stability of the duplex formed on binding to complementary DNA.
Nucleic acid analogues
Artificial nucleic acid analogues bind to complementary DNA. Peptide nucleic acid (PNA), a neutral
molecule, forms particularly strong and specific interactions with DNA. Stretches of PNA can be
incorporated into DNA oligonucleotides to increase duplex stability; but care must be taken in
designing the PNA-DNA junction, and the stabilizing effect of the PNA can be offset by the
destabilizing impact of the junction. Locked nucleic acid (LNA) and unlocked nucleic acid (UNA) are
analogues of RNA that can be easily incorporated into DNA oligonucleotides during solid-phase
oligonucleotide synthesis, and respectively increase and decrease duplex stability. LNA and UNA
phosphoramidite monomers are not readily available, however, and it is not always easy to predict
the effect of incorporating LNA and UNA units into DNA oligonucleotides before they are
synthesized.
Modified bases
Modified DNA bases that increase the stability of base pairs (and therefore the duplex as a whole)
have been developed. These modified bases can be incorporated into oligonucleotides during solid-
phase synthesis and offer a more predictable method of increasing DNA duplex stability.
AP-dC (G-clamp)
AP-dC (G-clamp) is a tricyclic analogue of cytosine. Like cytosine, G-clamp forms base pairs with
guanine; but, while G·C base pairs are stabilized by three hydrogen bonds, G·G-clamp base pairs
have four hydrogen bonds (Figure 5). The extra hydrogen bond can lead to an increase in Tm
of 18
°C. The incorporation of multiple G-clamp bases can result in further increases in duplex stability.
Figure 5 | Structure of the G·G-
clamp base pairG·G-clamp base
pairs (right) increase the stability
of a DNA duplex by up to 18 °C
relative to G·C base pairs (left).
107.
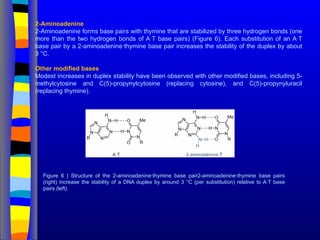
2-Aminoadenine
2-Aminoadenine forms basepairs with thymine that are stabilized by three hydrogen bonds (one
more than the two hydrogen bonds of A·T base pairs) (Figure 6). Each substitution of an A·T
base pair by a 2-aminoadenine·thymine base pair increases the stability of the duplex by about
3 °C.
Other modified bases
Modest increases in duplex stability have been observed with other modified bases, including 5-
methylcytosine and C(5)-propynylcytosine (replacing cytosine), and C(5)-propynyluracil
(replacing thymine).
Figure 6 | Structure of the 2-aminoadenine·thymine base pair2-aminoadenine·thymine base pairs
(right) increase the stability of a DNA duplex by around 3 °C (per substitution) relative to A·T base
pairs (left).
108.
DNA Protein Interactions
Thebinding of proteins to DNA (or RNA) is an example of ligand
binding. Usually, the nucleic acid is considered to be the ligand.
There is a considerable range of sequence specificities and
binding affinities in protein-nucleic acid interactions. There are
examples of proteins that bind to a single defined nucleic acid
sequence as well as proteins that bind without regard to sequence.
The dissociation constants can range from µM to sub-nM. In the
case of binding to dsDNA, the binding is usually to the major
groove; the minor groove is too narrow to permit the insertion of
DNA secondary structure into the groove.
109.
Forces and functionalgroups involved in recognition.
1.Electrostatic bonding to the backbone.
•Side chains of Lys and Arg to phosphates.
•Release of metal ions (e.g. K+) favors binding ( large increase in ∆S).
2.Van der Waals: Stacking (and intercalation) of Phe, Trp, and Tyr side chains. More
prevalent in single stranded (ss) nucleic acid.
3.Hydrophobic interaction with the 5-methyl of T.
4.Non- Watson-Crick Hydrogen bonding to the polar edges of the bases and to sugars.
1.Side chains of Arg, Asn, Gln, etc.
2.Protein main chain, C=O and NH groups.
3."Bridging H2O" can also participate.
Example of DNA-Protein interactions. This example shows two sidechains from a
protein, Lys and Arg, interacting with a T-A basepair in the major groove. The
sidechains form non-Watson-Crick hydrogen bonds (purple) with the adenosine and the
arginine interacts with the phosphate via electrostatic interactions.


![Mandibular prognathism is the name of
a heritable genetic conditions where
growth of the maxilla (upper jaw) is
retarded with respect to the
the mandible (lower jaw), which results in
a projecting chin, rolled-out lower lip, and
a crossbite of the incisors. The
phenomenon is known as the 'Hapsburg
Lip' because of its occurrence in multiple
generations of members of the European
royal House of Hapsburg, as documented
in their portraits over 200 years [above].
The trait is inherited as a single-
gene autosomal dominant with
incomplete penetrance (~ 0.90), and
shows up frequently because of extensive
intermarriage between different branches
of the family. extensive inbreeding. Queen
Isabella I and King Ferdinand II of Castile
& Aragon, Columbus' patrons on his
voyages to America, are early case. Kings
Charles II and Philip IV of Spain, and
Leopold of Austria, have particularly
prominent cases. It may be assumed that
portrait artists 'improved' the appearance
of their subjects in some cases.](https://image.slidesharecdn.com/dnastructure2025-250721223545-8c78ce40/85/DNA_structure_2025_Curso-de-Acidos-Nucleicos-4-320.jpg)


![The equilibrium constant Keq
can be written as a function of the extent of
association, α, and of the initial total concentration of single-stranded DNA,
CT
(CT
= [Ass
]initial
+ [Bss
]initial
). At equilibrium there are 1−α moles of Ass
, 1−α
moles of Bss
and α moles of Cds
, so:
Keq
= ([Cds
]eq
/ [Ass
]eq
[Bss
]eq
) = (xC
CT
/ xA
CT
xB
CT
) = 2α / [(1−α)2
CT
]
At the midpoint of the melting curve, α = ½, so
Keq
= (1 / ¼CT
) = (4 / CT
)
therefore
− ln Keq
= − ln (4 / CT
) = ln (CT
/ 4)](https://image.slidesharecdn.com/dnastructure2025-250721223545-8c78ce40/85/DNA_structure_2025_Curso-de-Acidos-Nucleicos-100-320.jpg)
![Self-complementary DNA
For self-complementary DNA, an equilbrium is established in solution
between single-stranded and double-stranded DNA:
2 Ass
C
⇌ ds
As with non self-complementary DNA, the equilibrium constant Keq
can be
written as a function of the extent of association, α, and of the initial
concentration of single-stranded DNA, CT
(CT
= [Ass
]initial
). At equilibrium there
are 1−α moles of Ass
and α moles of Cds
, so
Keq
= ([Cds
]eq
/ [Ass
]eq
2
) = (xC
CT
/ xA
2
CT
2
) = α / [2(1−α)2
CT
]
At the midpoint of the melting curve, α = ½, so
Keq
= (1 / CT
)
therefore
− ln Keq
= − ln (1 / CT
) = ln (CT
)](https://image.slidesharecdn.com/dnastructure2025-250721223545-8c78ce40/85/DNA_structure_2025_Curso-de-Acidos-Nucleicos-101-320.jpg)


![Polymer [ बहुलक ] Chemistry Notes PDF - Irfanullah Mehar - JJ Sir Chemistry.pdf](https://cdn.slidesharecdn.com/ss_thumbnails/polymerchemistrynotespdf-irfanullahmehar-jjsirchemistry-260210172118-3f9b37f7-thumbnail.jpg?width=640&height=640&fit=bounds)
