


![31
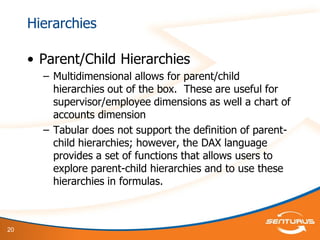
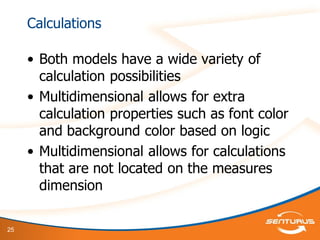
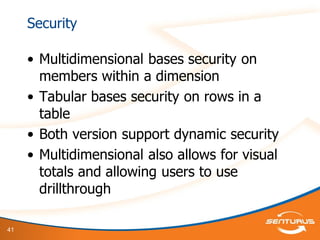
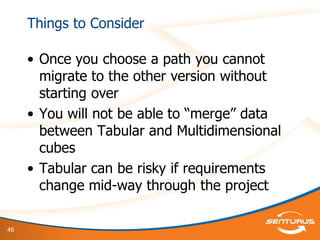
MDX vs DAX
• MDX can be hard to conceptualize but it
has the advantage of being able to
navigate hierarchies
• Percent of Parent calculation in MDX
[Measures].[Sales Amount] /
([Product].[Product Categories].CurrentMember.Parent,
[Measures].[Sales Amount])](https://image.slidesharecdn.com/ssasmultivstabular-130606080326-phpapp01/85/Microsoft-SSAS-Should-I-Use-Tabular-or-Multidimensional-31-320.jpg)
![32
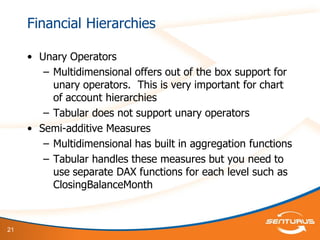
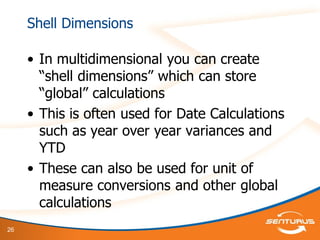
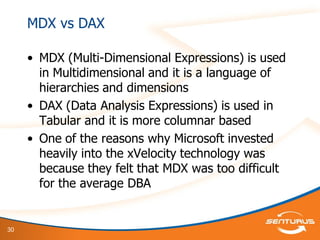
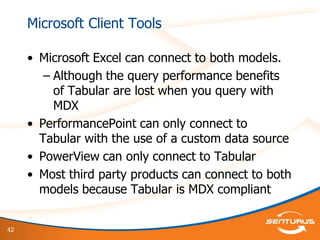
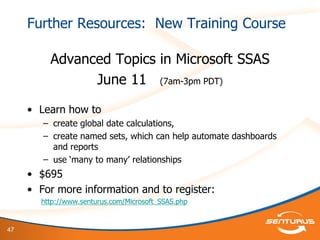
MDX vs DAX
• Here is the Percent of Parent calculation
in DAX
IF(
ISFILTERED(Product[Product])
,[Sales]/CALCULATE([Sales],ALL(Product[Product]))
,IF(
ISFILTERED(Product[Subcategory])
,[Sales]/CALCULATE([Sales],ALL(Product[Subcategory]))
,1
)
)](https://image.slidesharecdn.com/ssasmultivstabular-130606080326-phpapp01/85/Microsoft-SSAS-Should-I-Use-Tabular-or-Multidimensional-32-320.jpg)


The document discusses a webinar on Microsoft's SQL Server Analysis Services (SSAS), comparing tabular and multidimensional models. It covers the history, technical differences, and key considerations for choosing between the two models, highlighting features, performance, and development aspects. Additionally, it offers recommendations for use cases and points out the implications of choosing one model over the other.