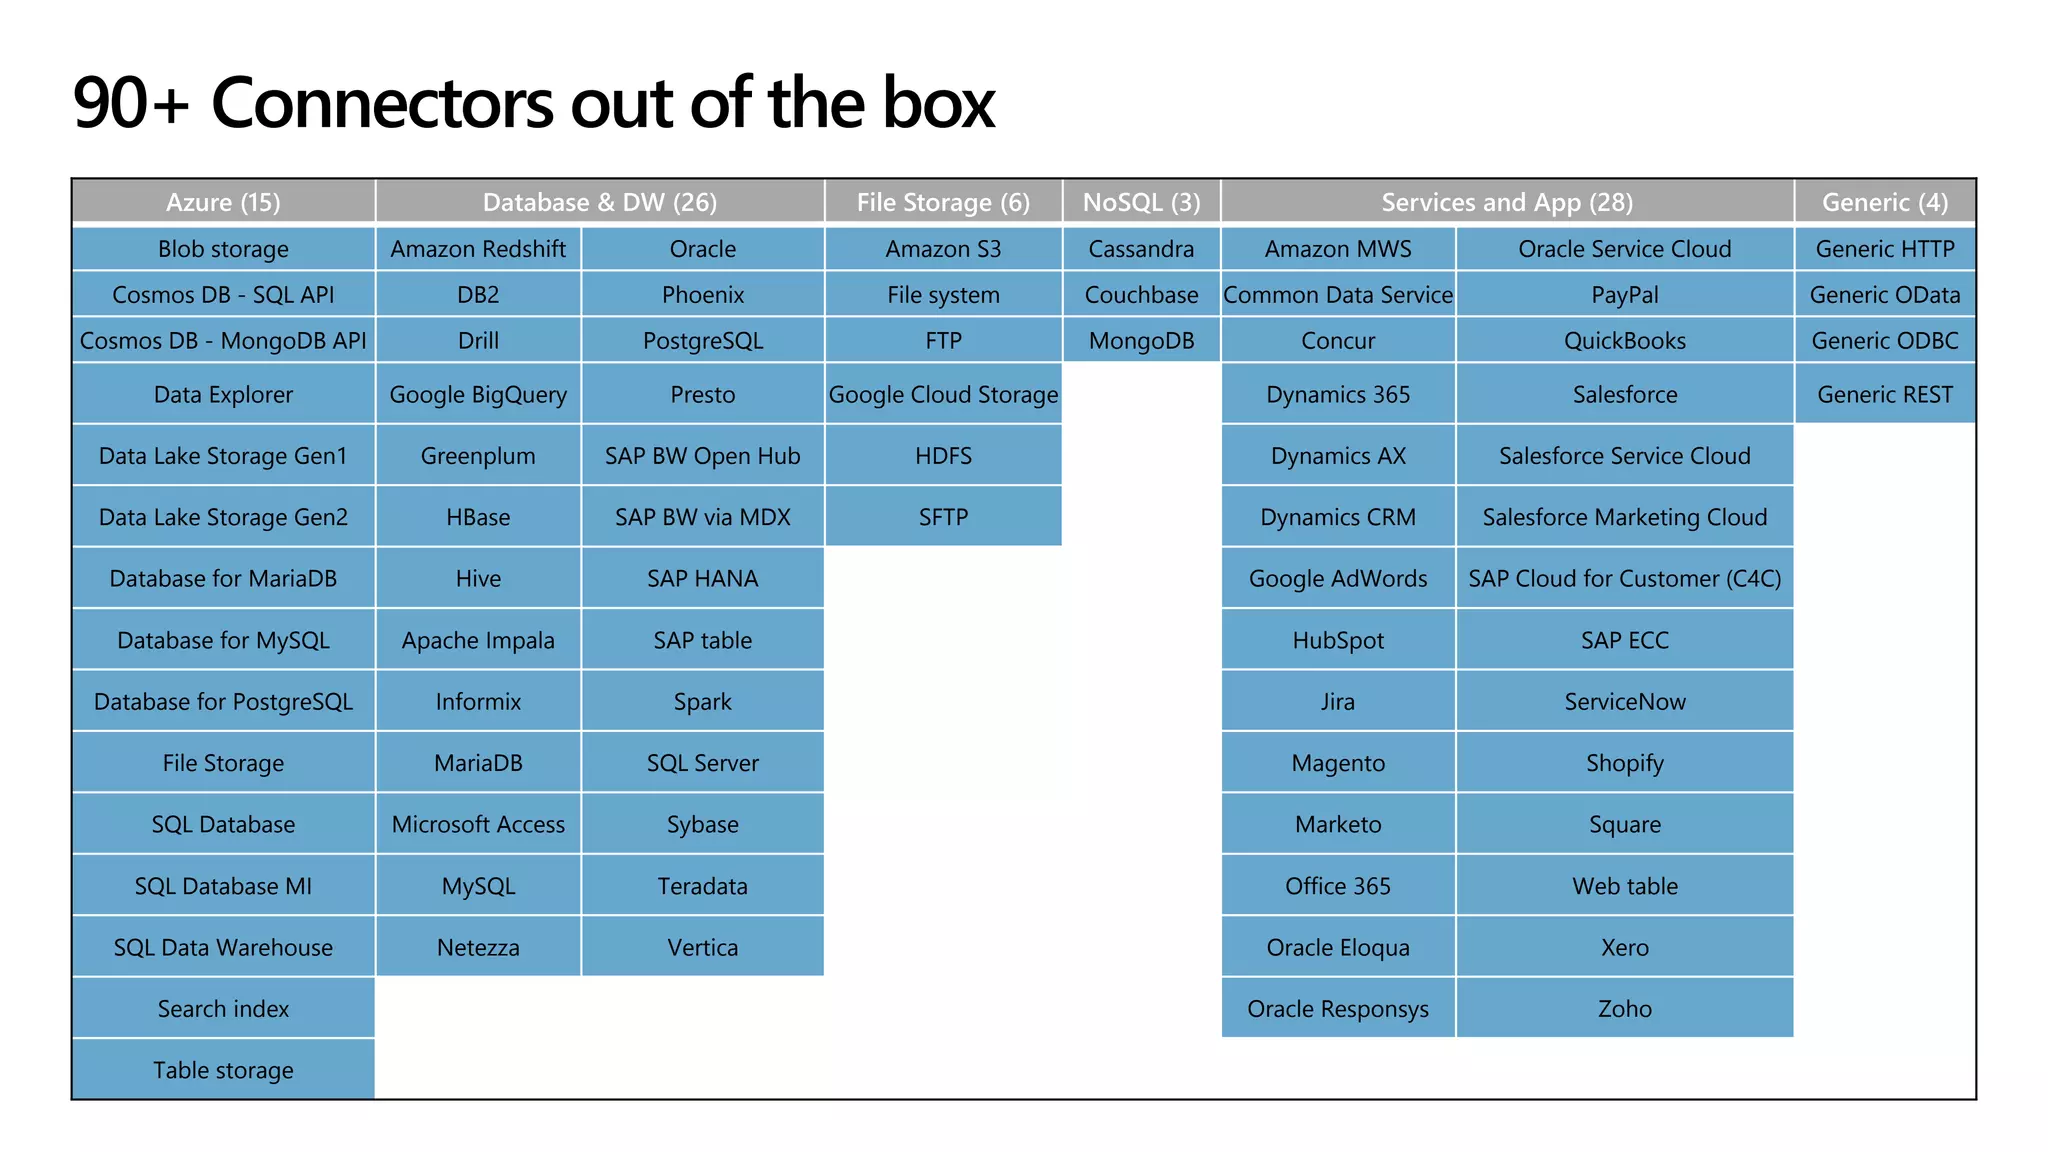
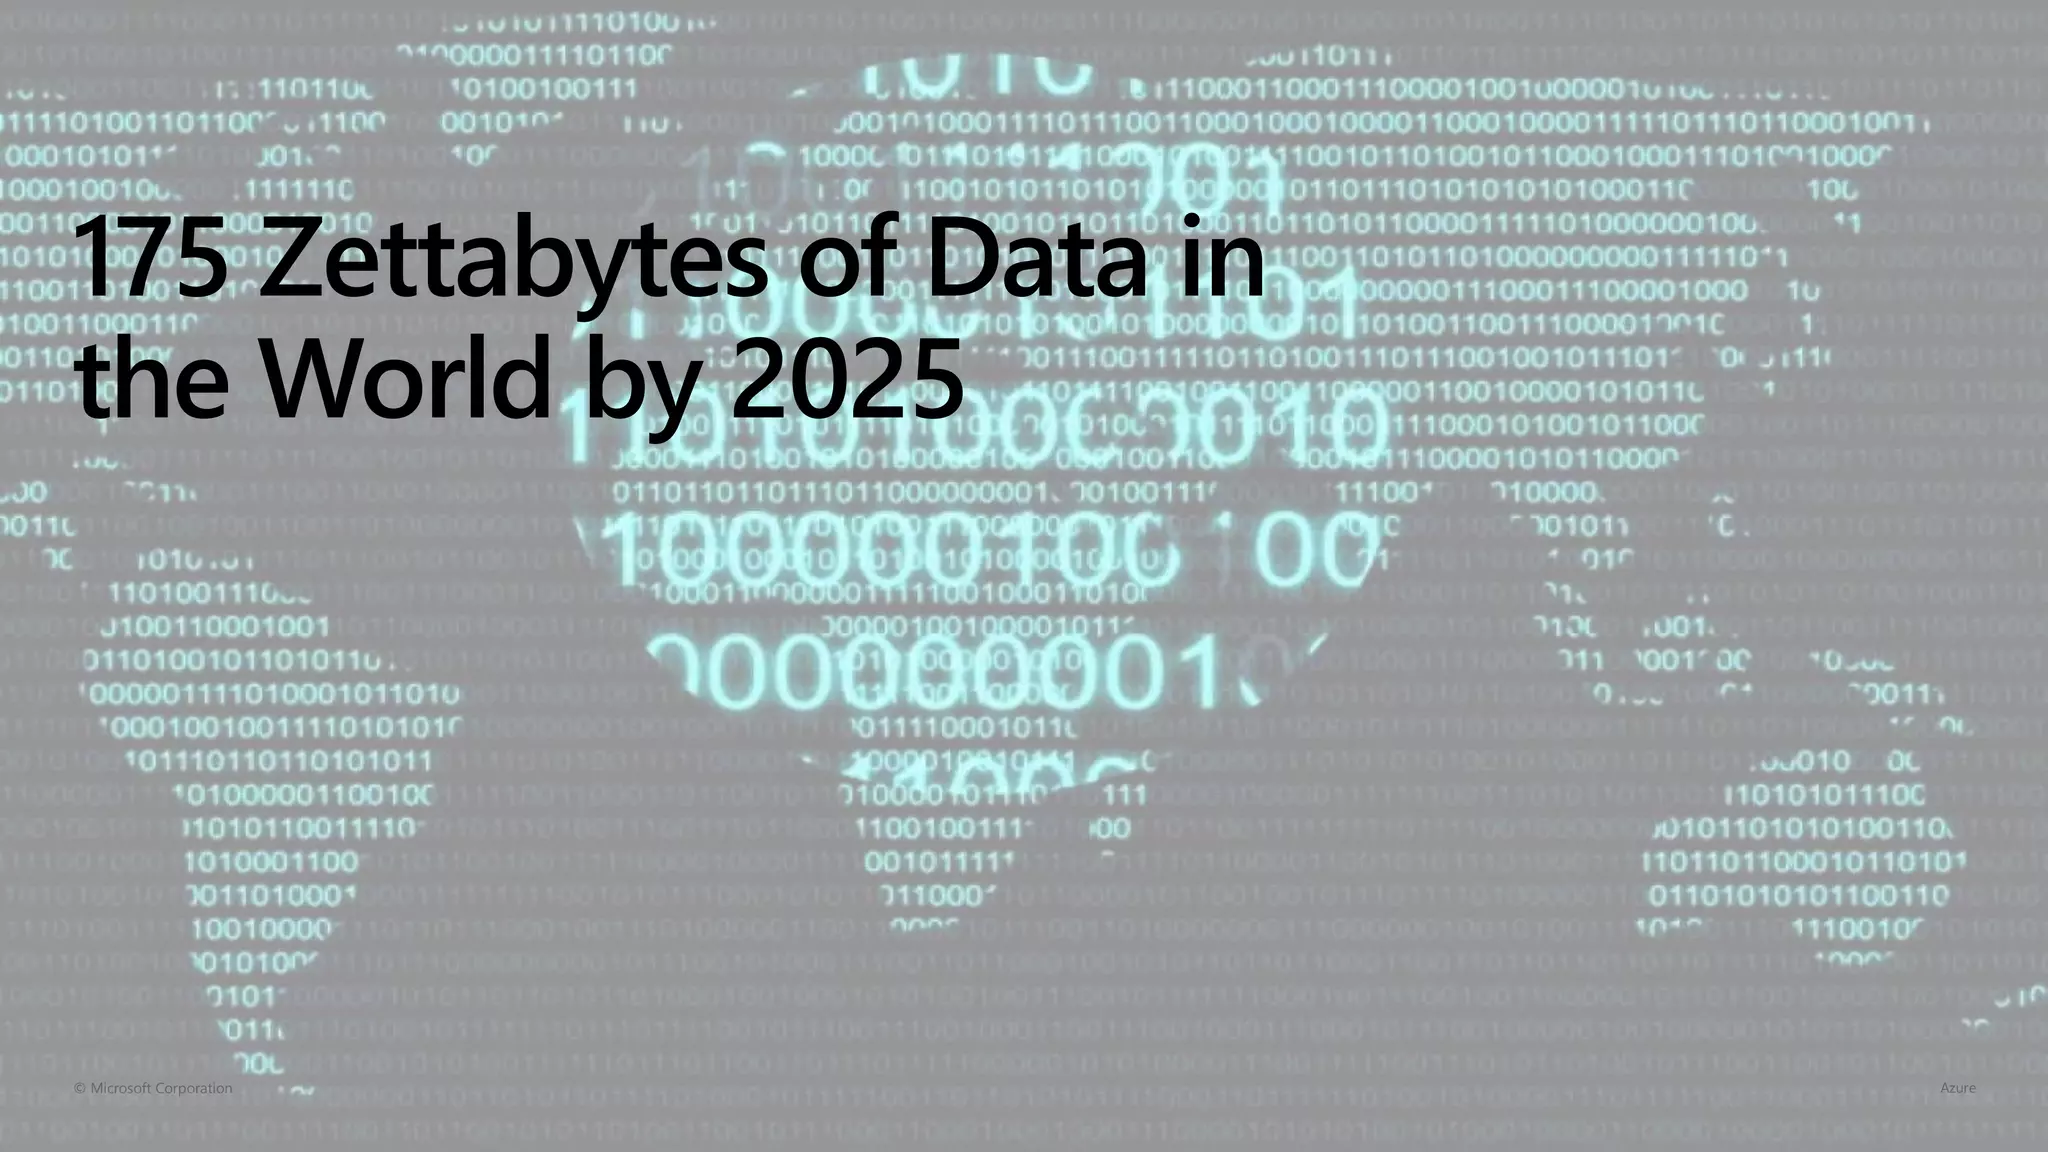
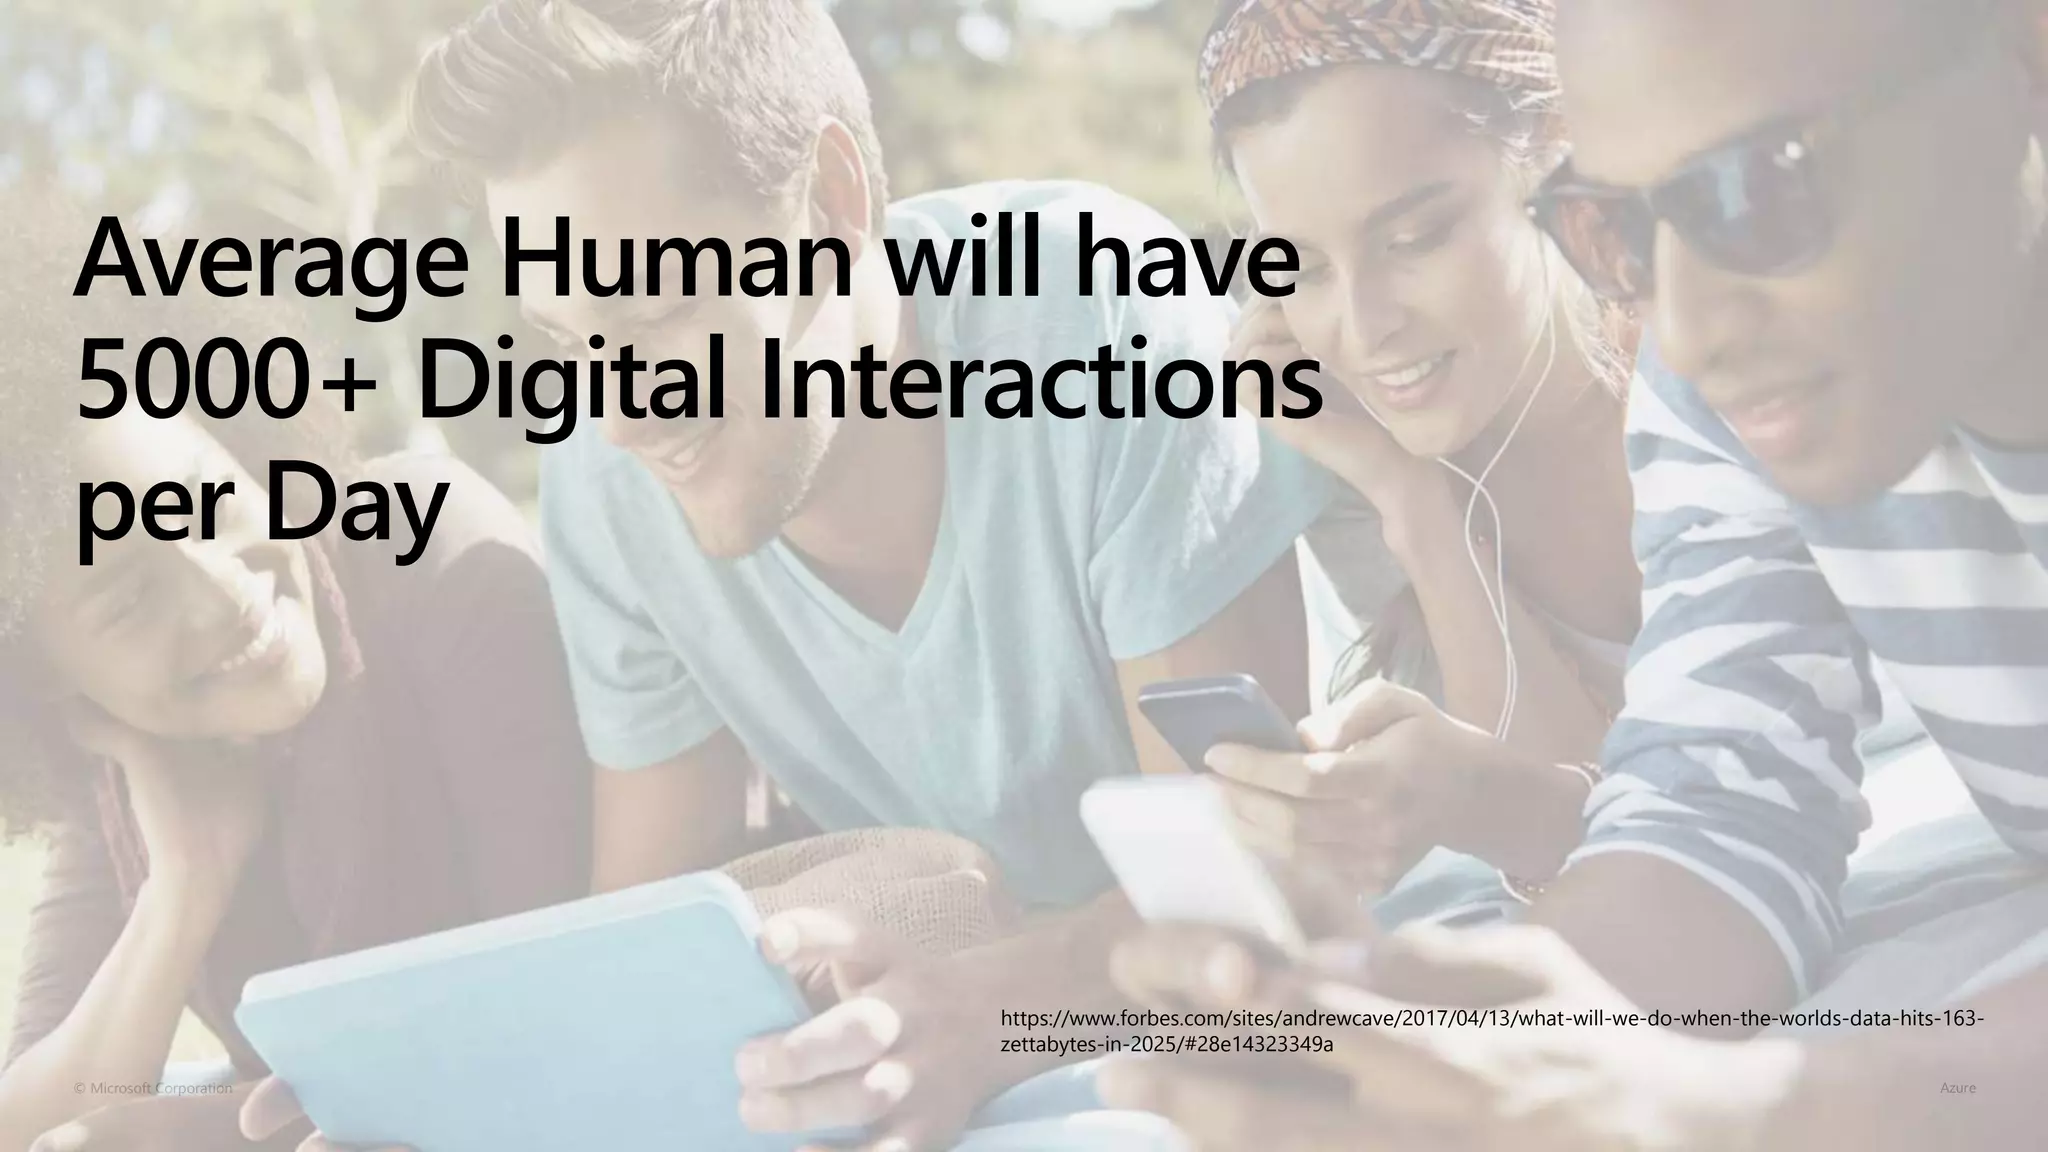
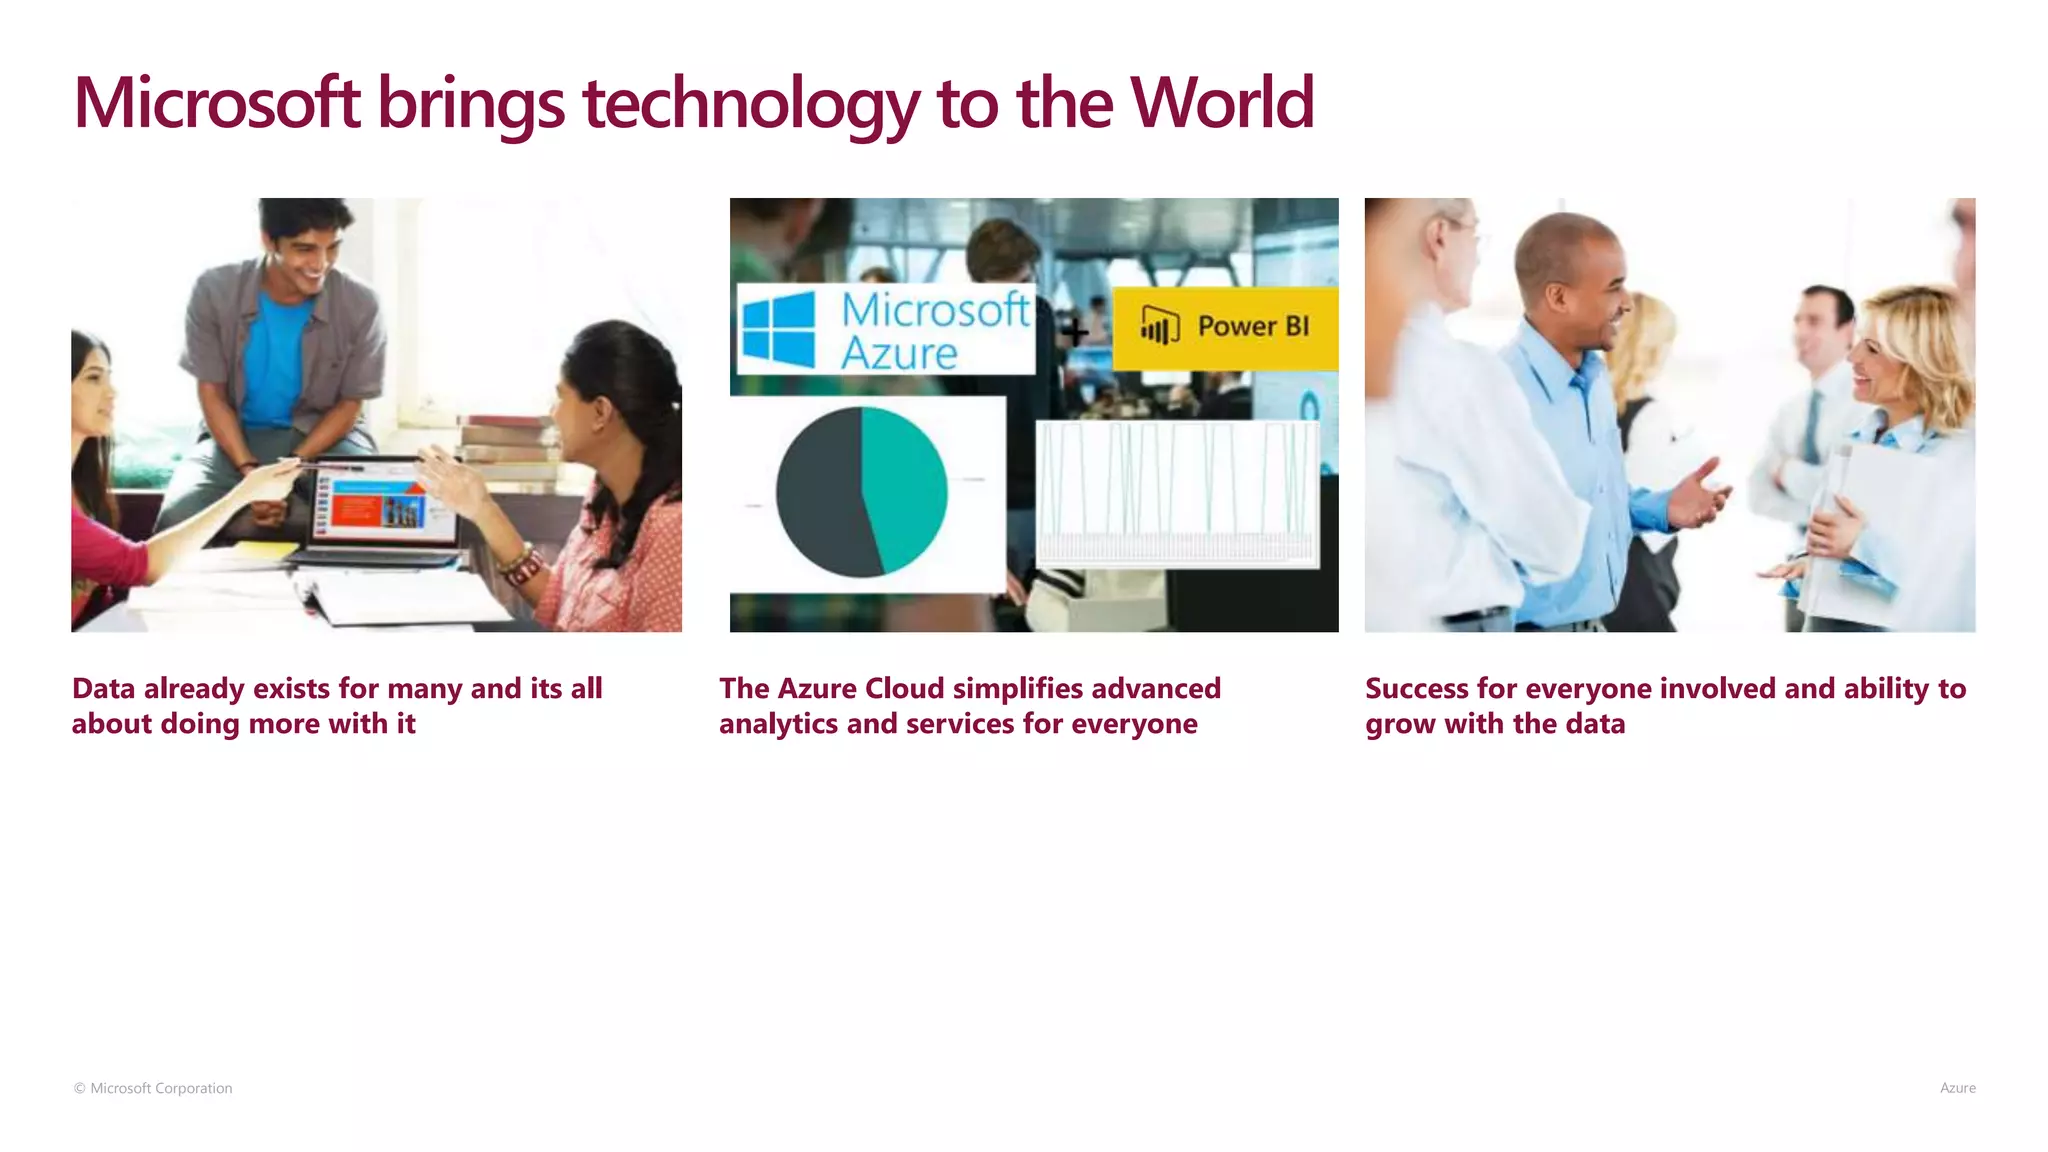
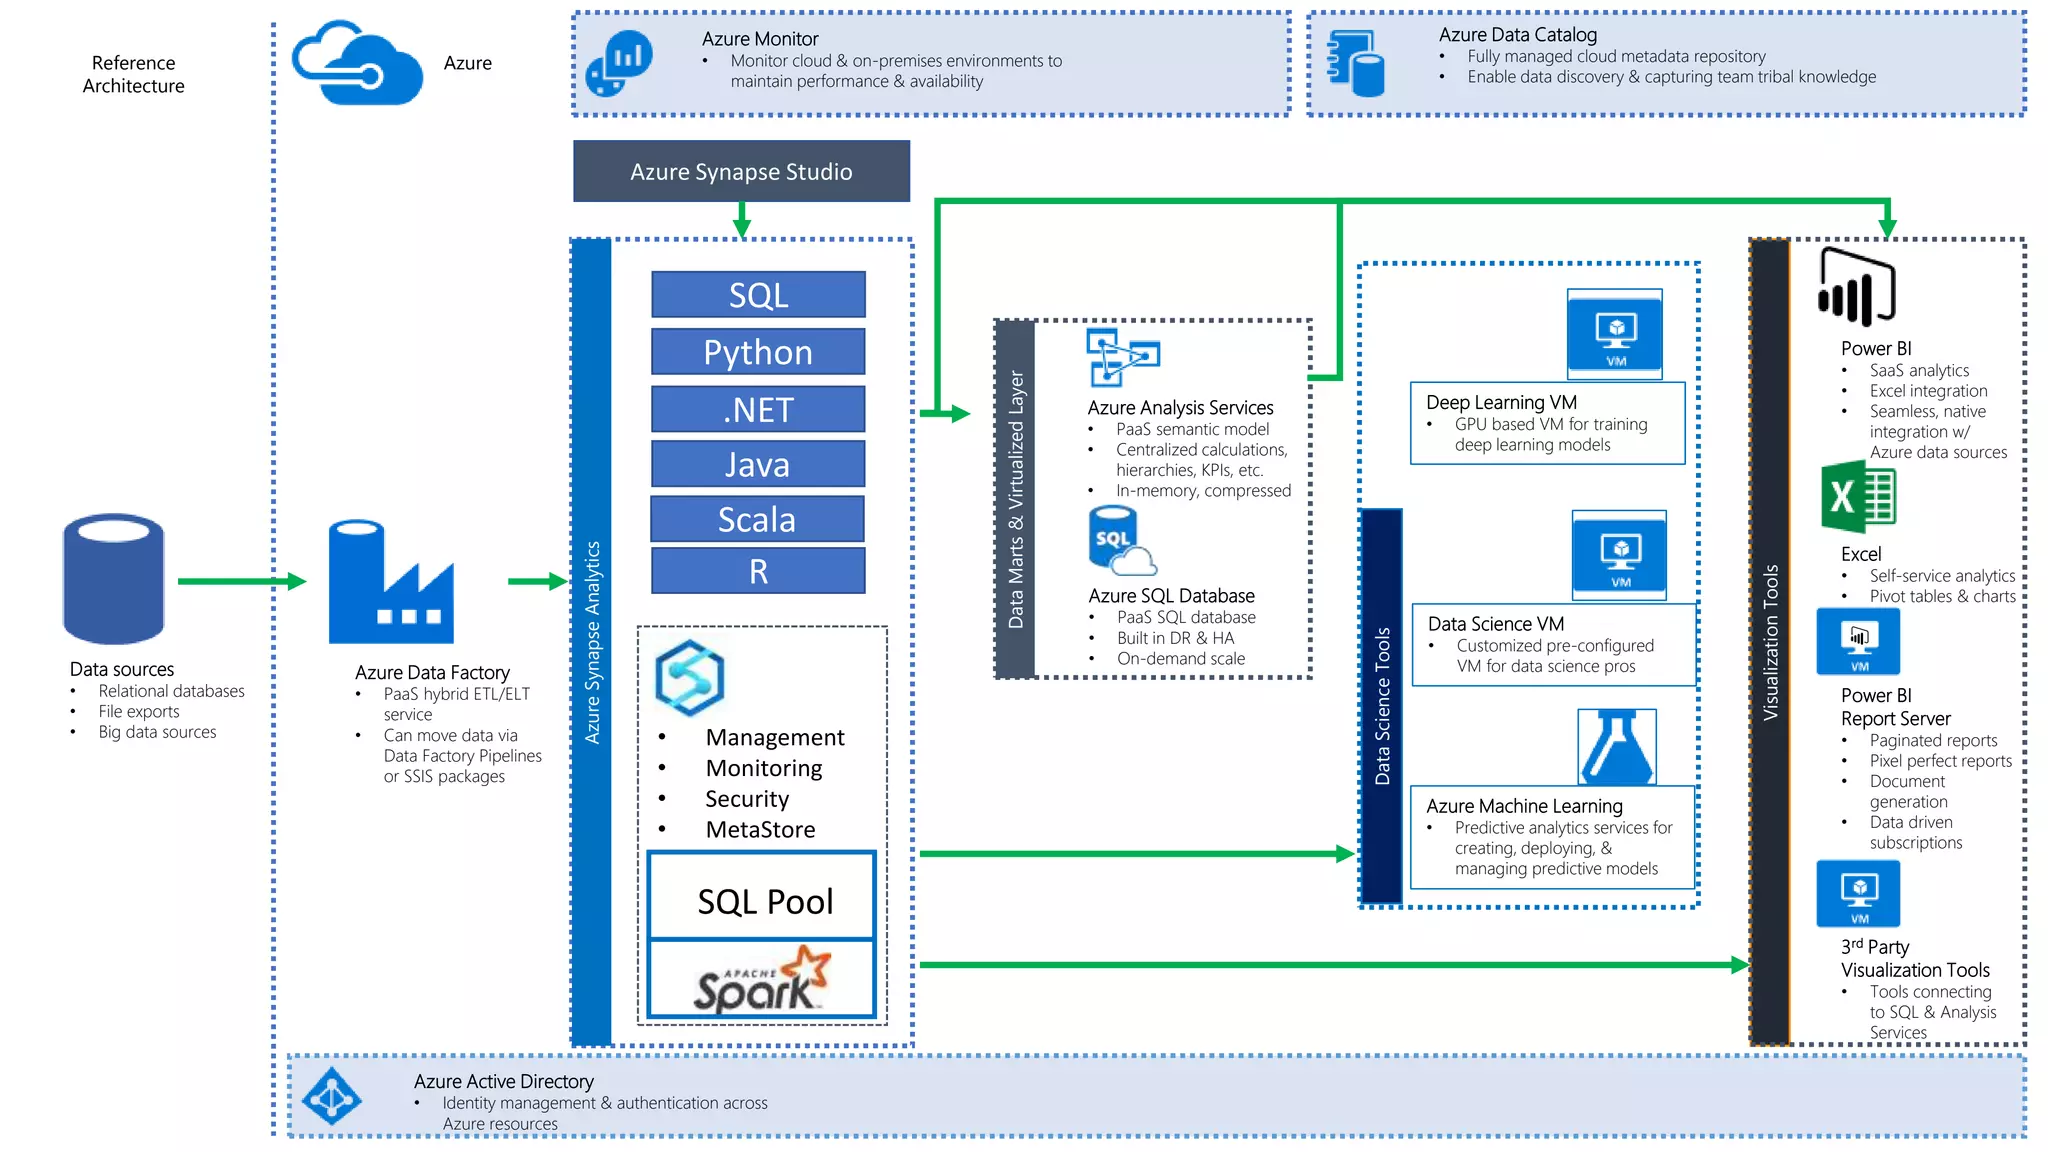
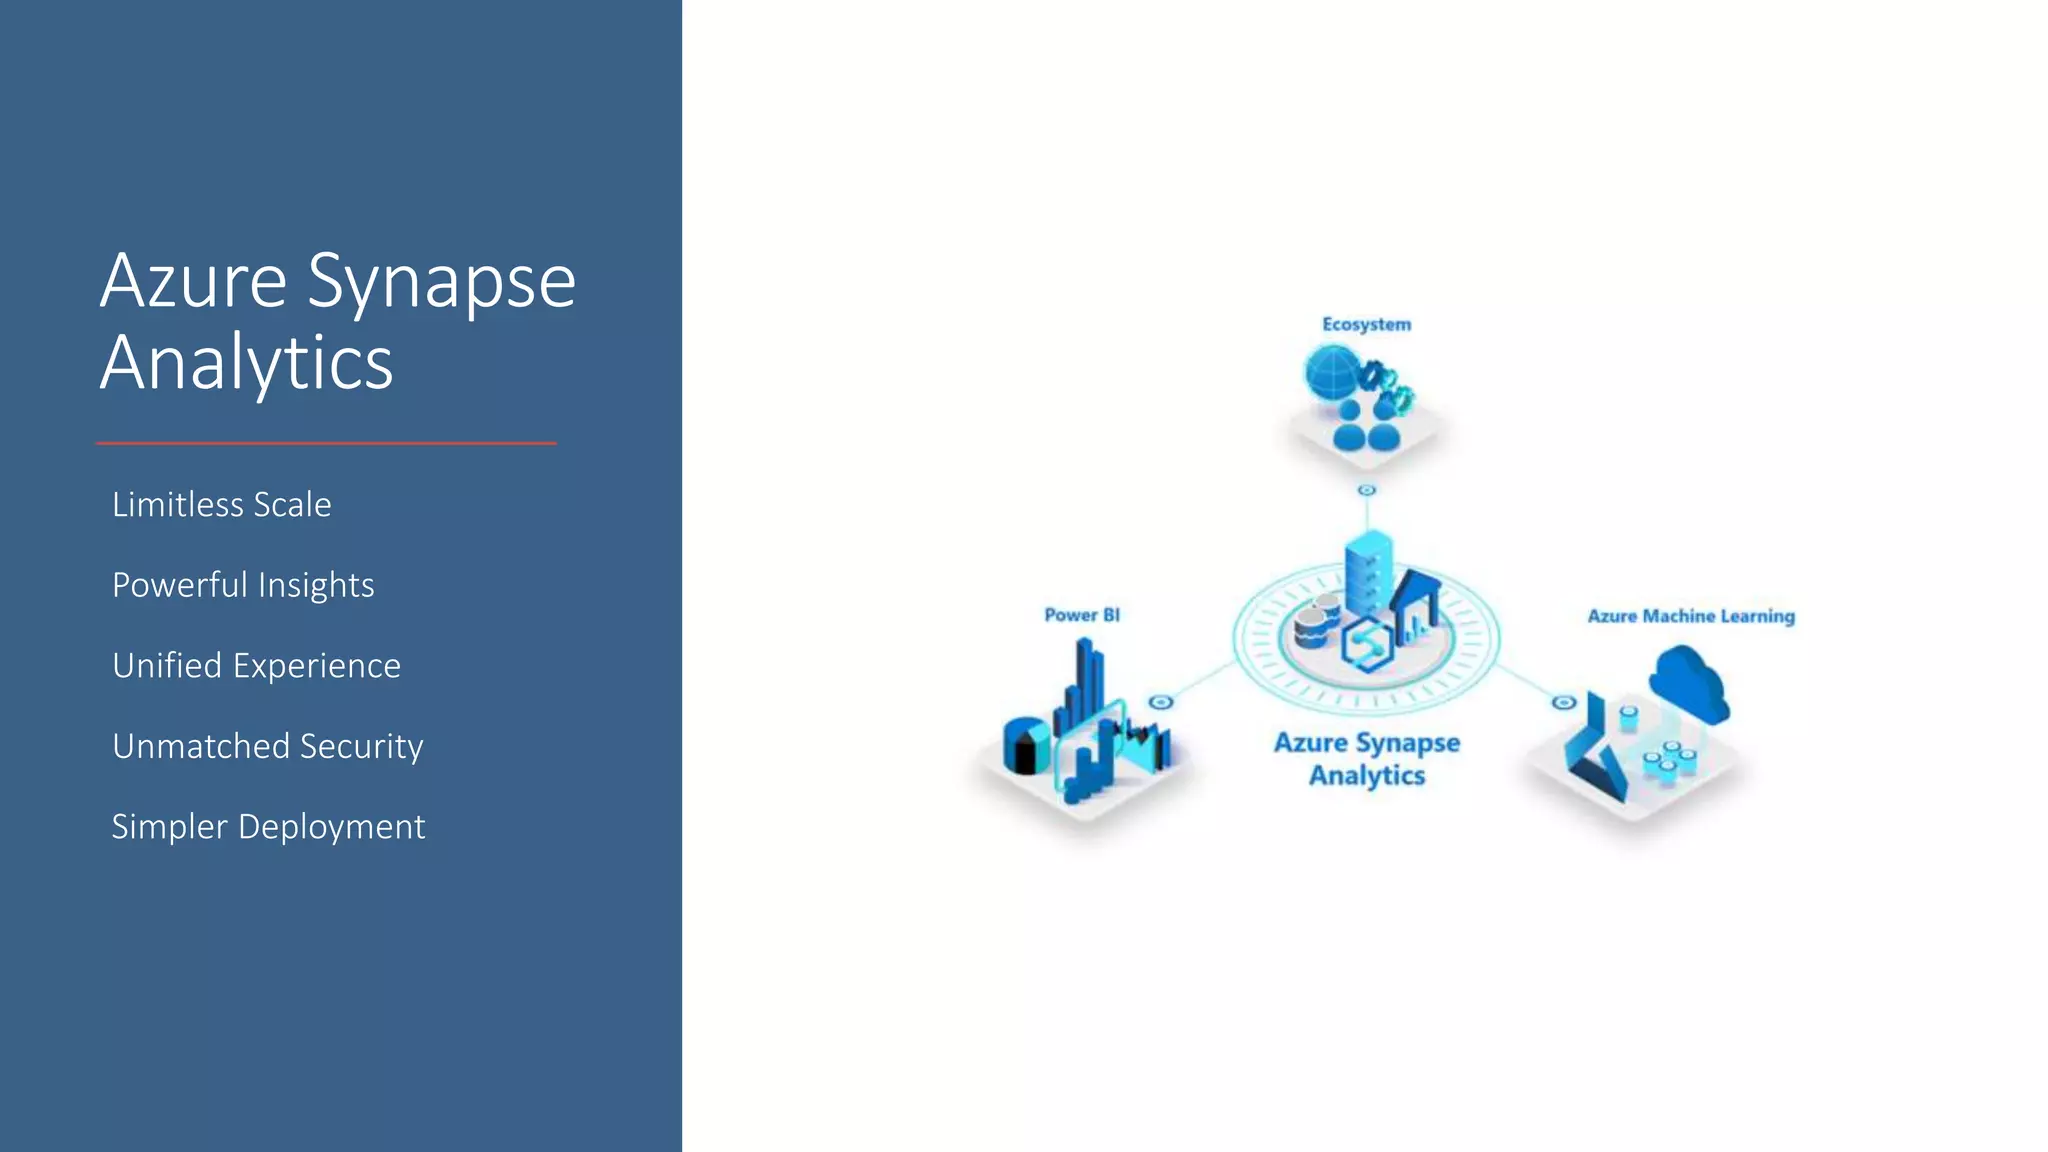
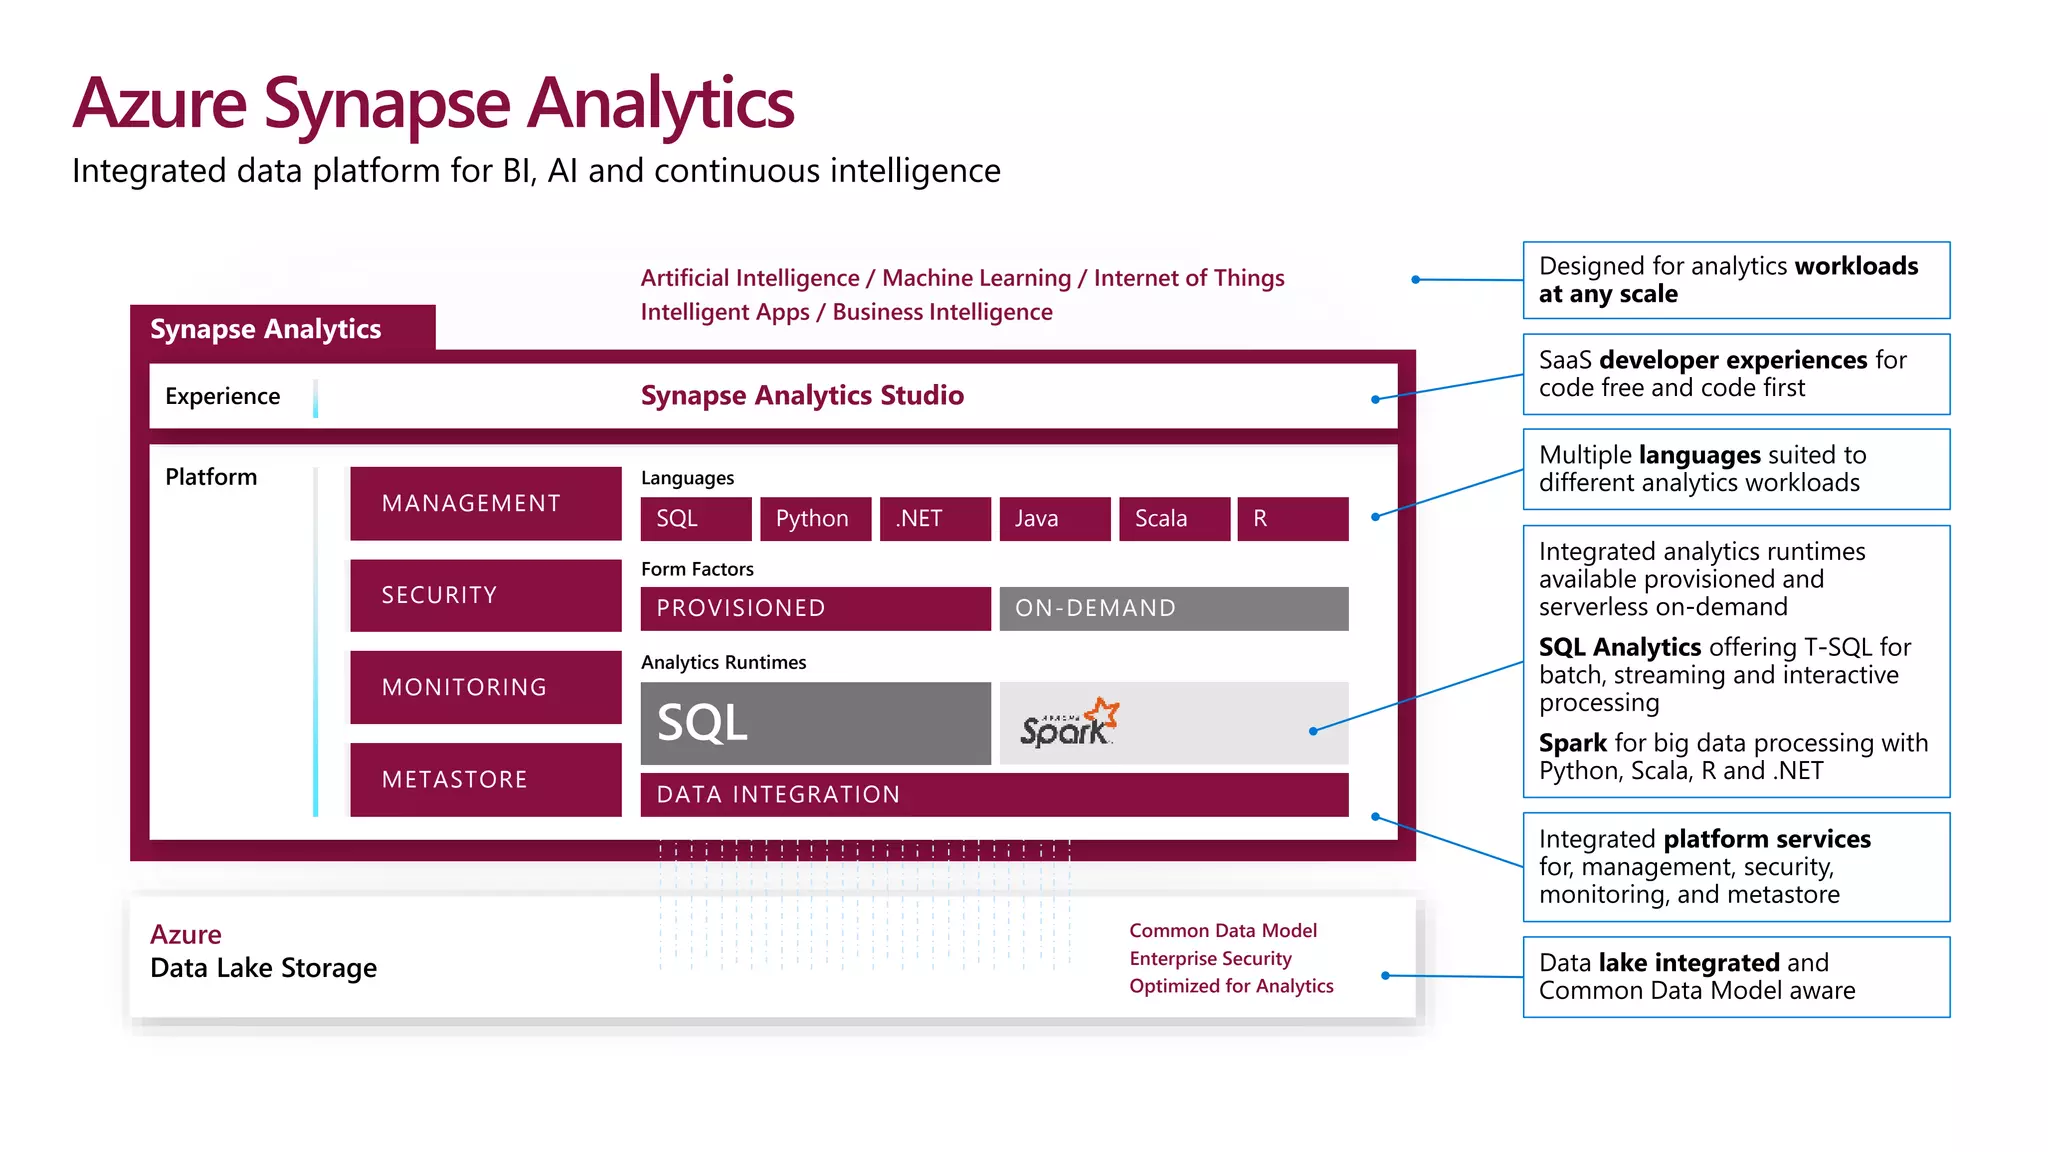
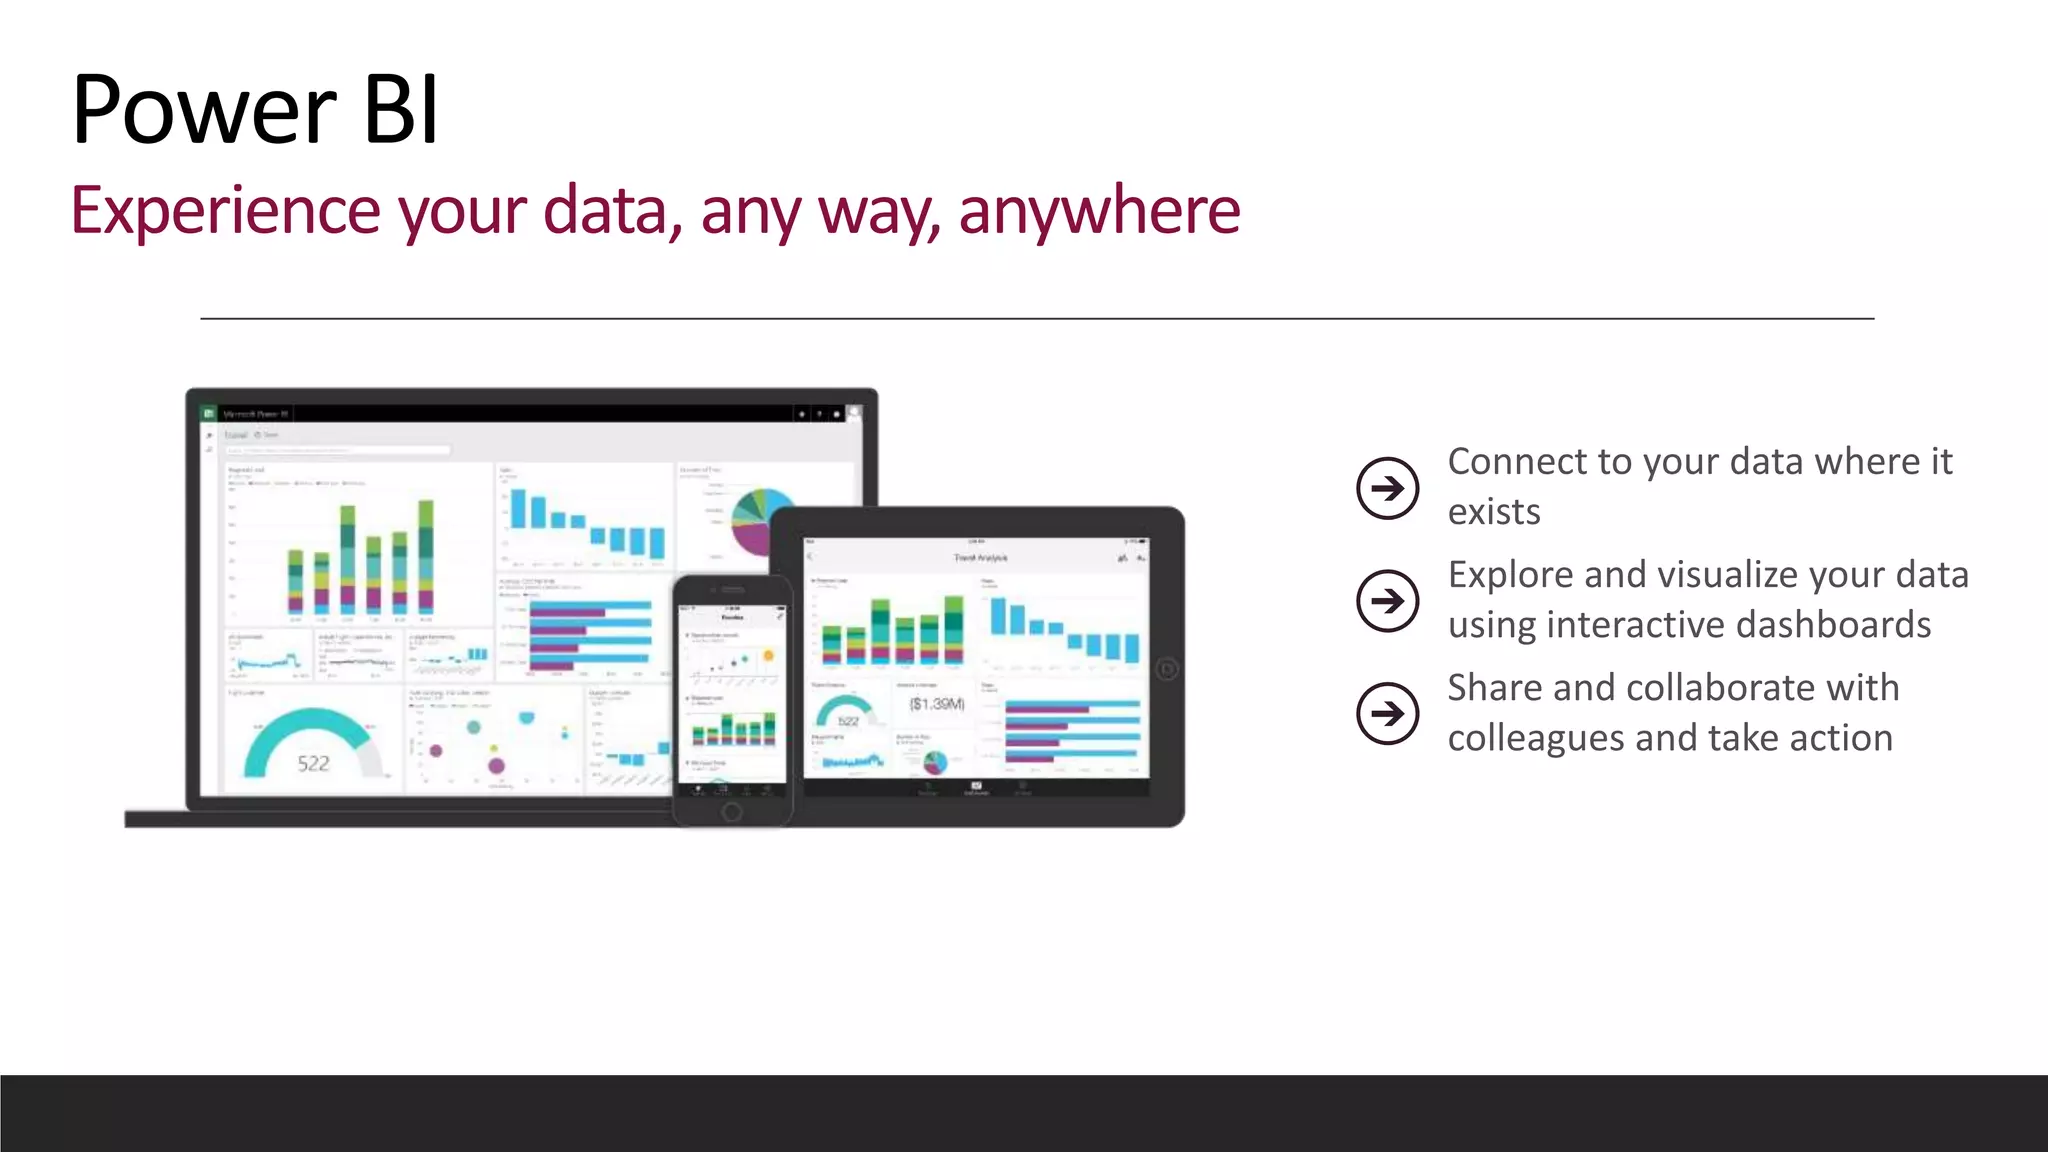
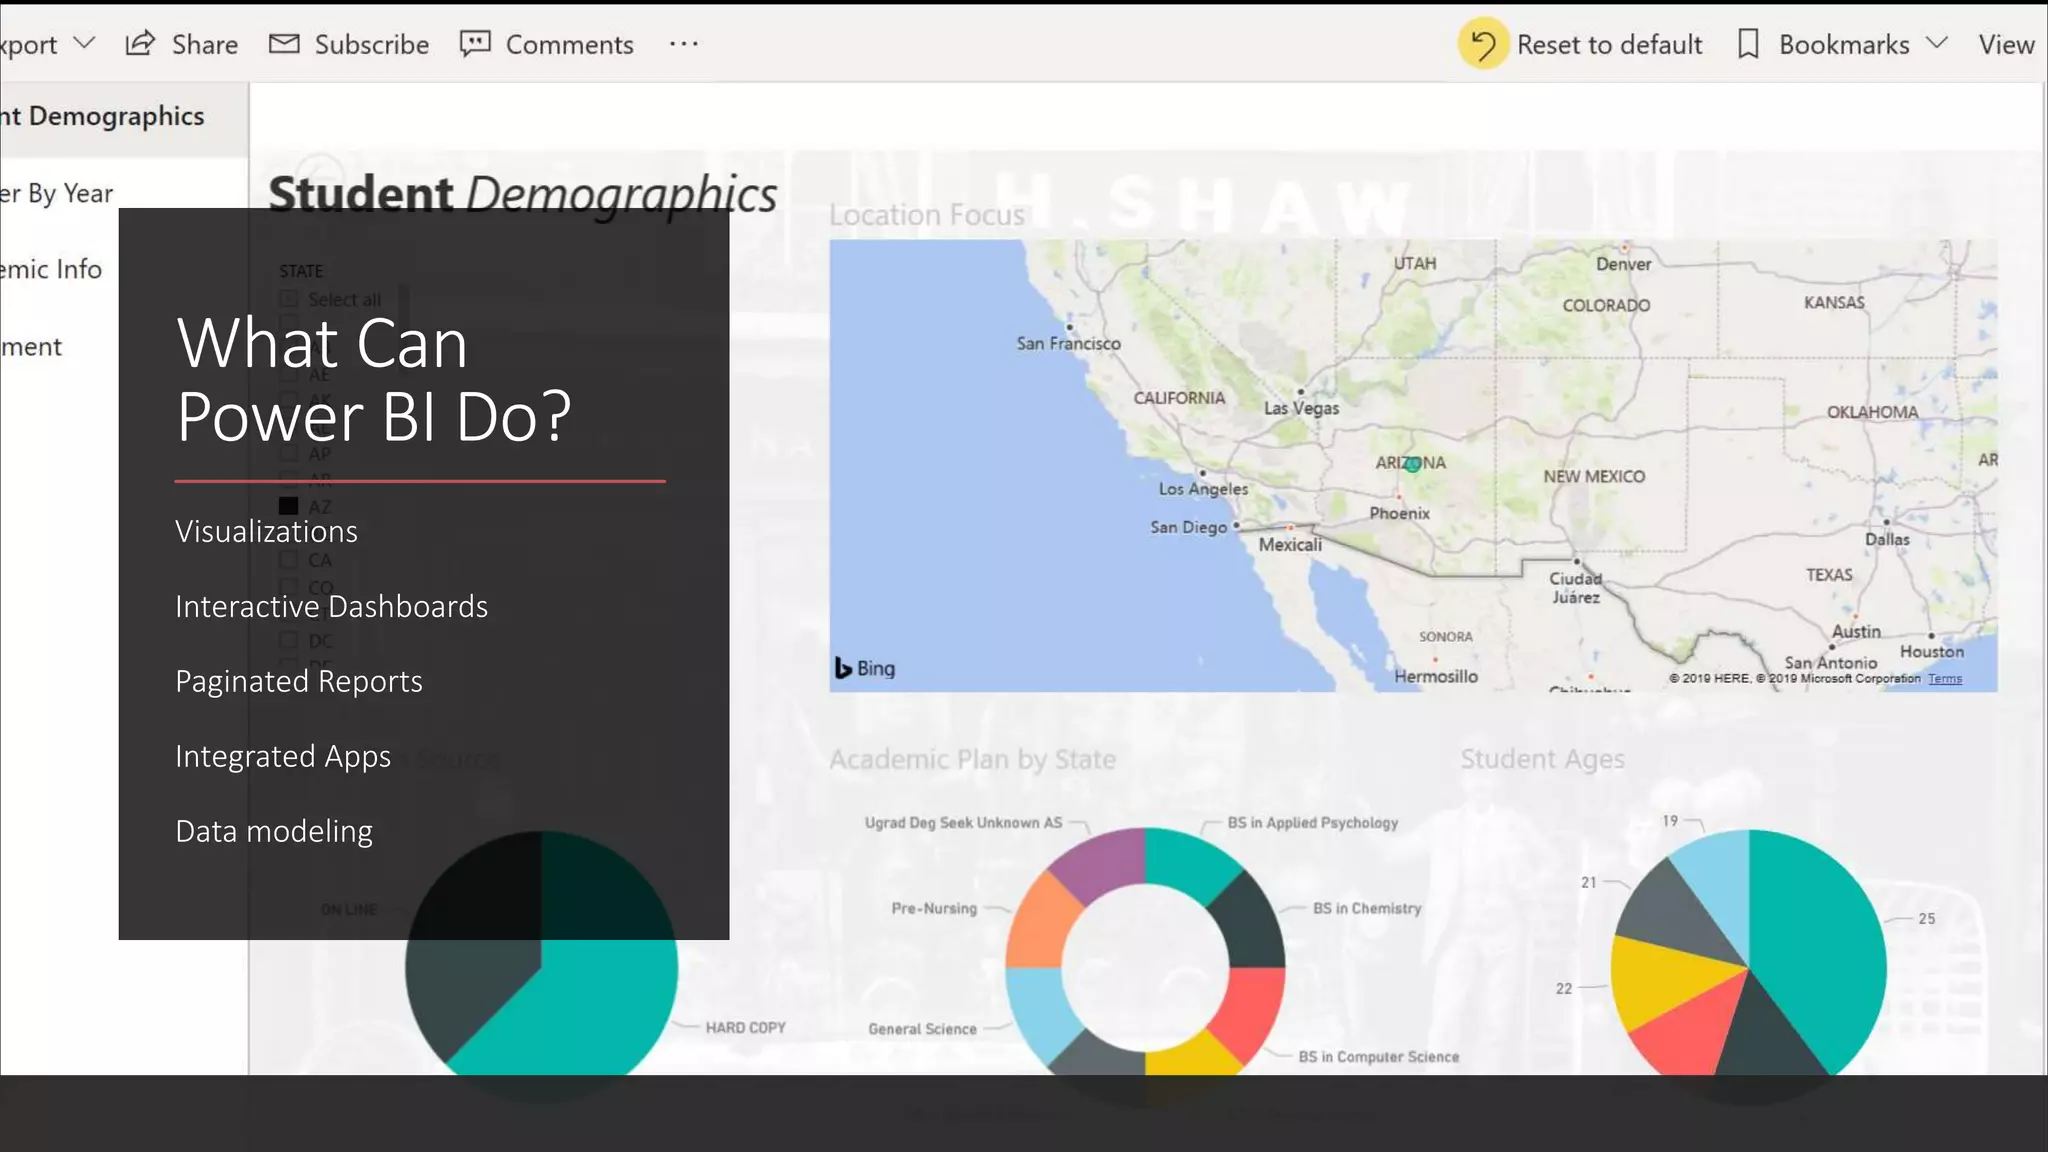
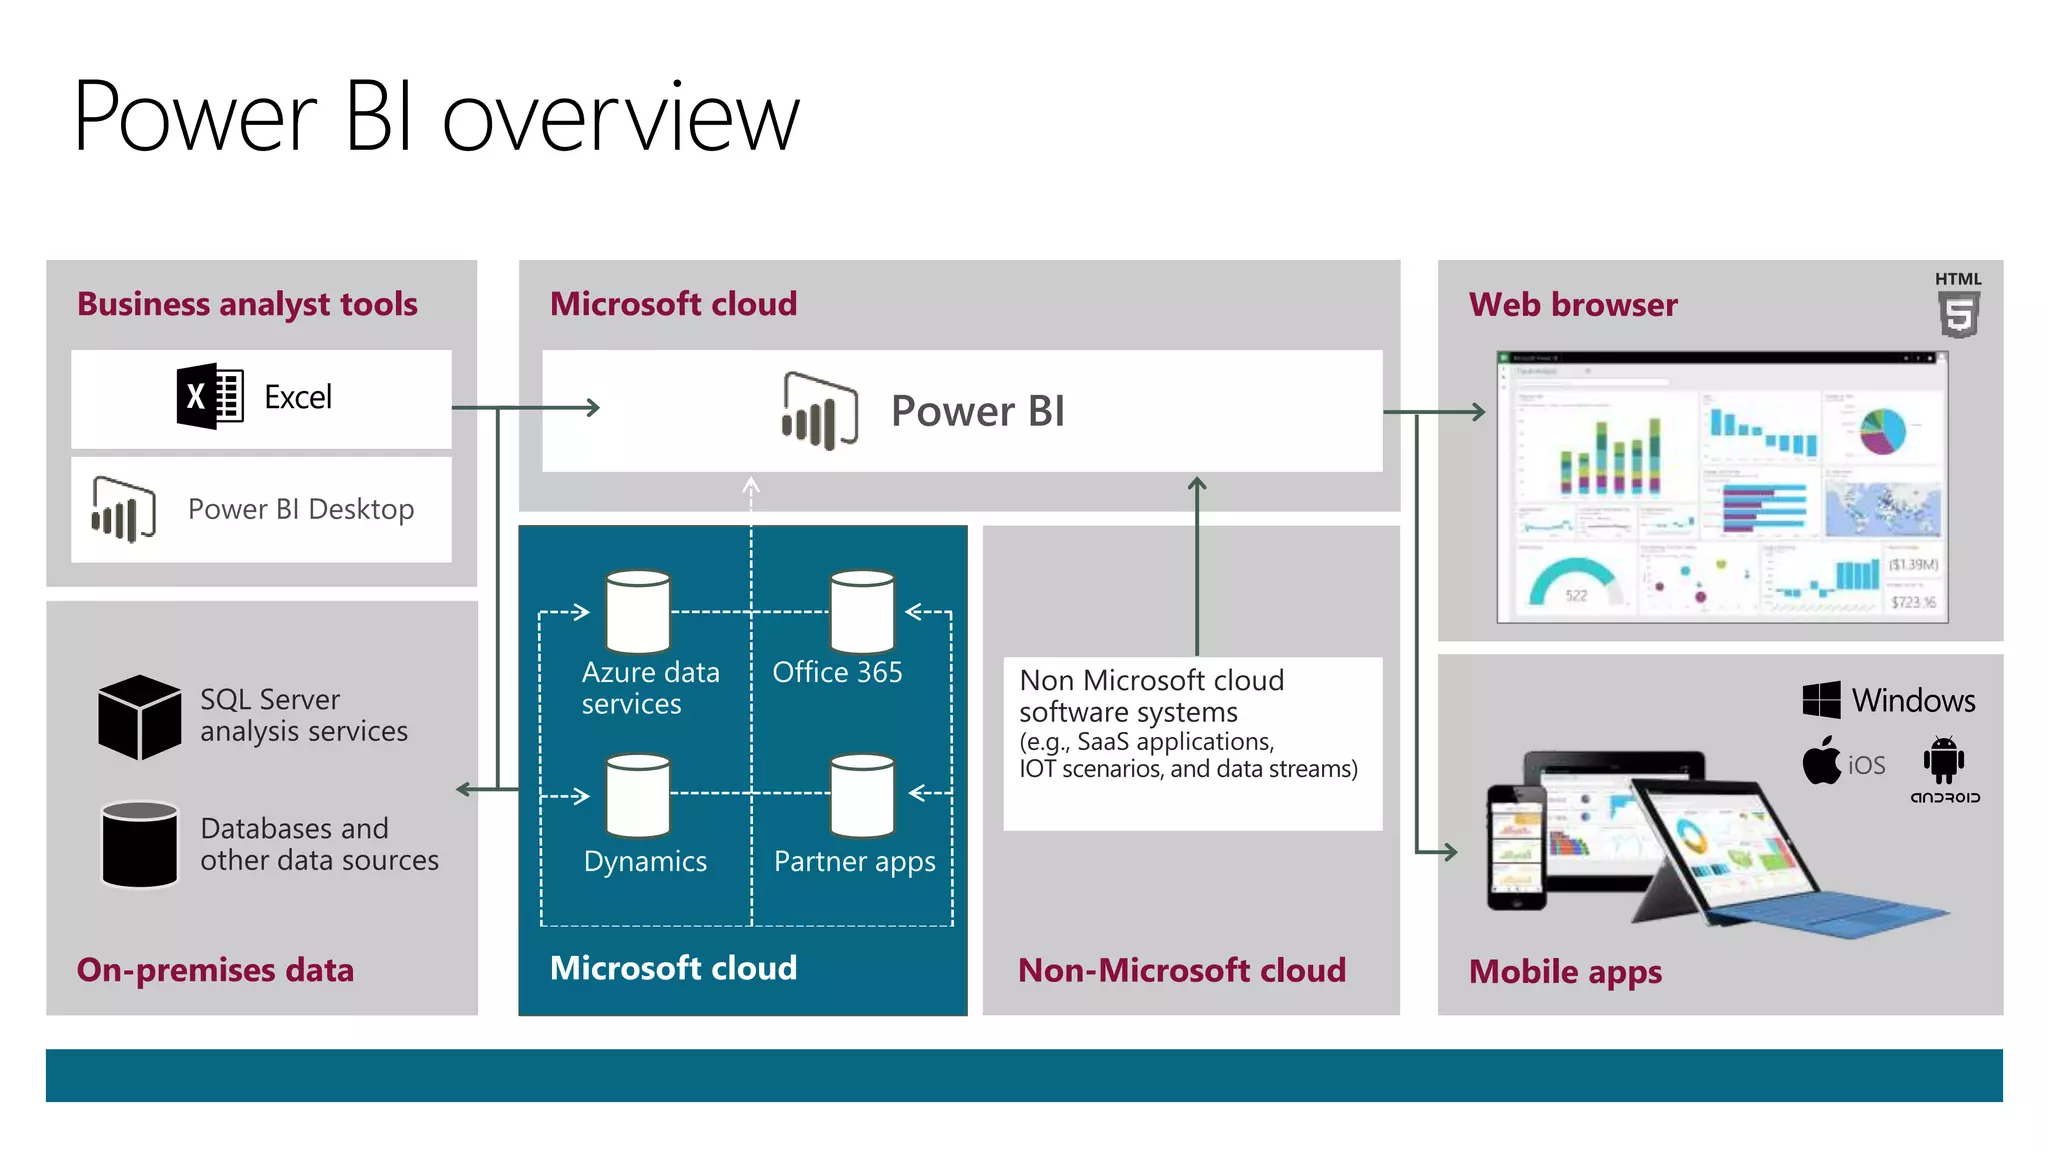
This document discusses the future of data and the Azure data ecosystem. It highlights that by 2025 there will be 175 zettabytes of data in the world and the average person will have over 5,000 digital interactions per day. It promotes Azure services like Power BI, Azure Synapse Analytics, Azure Data Factory and Azure Machine Learning for extracting value from data through analytics, visualization and machine learning. The document provides overviews of key Azure data and analytics services and how they fit together in an end-to-end data platform for business intelligence, artificial intelligence and continuous intelligence applications.
A simplified version of my presentation:
- PowerBI solution architecture
- Key steps to visualize data in PowerBI
- PowerBI Demo
- R in PowerBI
- Custom Visuals
- PowerBI Report Server
- Azure services and Power BI
Power BI is a business analytics service by Microsoft. It aims to provide interactive visualizations and business intelligence capabilities with an interface simple enough for end users to create their own reports and dashboards.
This presentation will give you an overview of what Microsoft Power BI is. What are its features. Why it is an upcoming popular Data Visualization tool in the market. How to use it and comparison with other Visualization tools.
Presented to The Ottawa IT Community Meetup Group (Ottawa SQL - PASS Chapter) on Thursday September 19
Powerful Self-Service BI in Excel 2013 - Data search and discovery with Power Query (formerly "Data Explorer"), analyzing and modeling with Power Pivot, visualizing and exploring with Power View and Power Map (formerly codename "GeoFlow")
What is Microsoft Power BI and what are its benefits. how we can Analyse data with the help of power BI. Power BI A Microsoft Business Intelligence and Data Analysis tool.
Power BI Full Course | Power BI Tutorial for Beginners | EdurekaEdureka!
YouTube Link: https://youtu.be/3u7MQz1EyPY
** Power BI Training - https://www.edureka.co/power-bi-training **
This Edureka PPT on "Power BI Full Course" will help you understand and learn Power BI in detail. This Power BI Tutorial is ideal for both beginners as well as professionals who want to master up their Power BI concepts.
Slides for the Usergroup meeting for the Manchester Power BI User Group on June 27th, 2019.
Subject: Power BI for Developers about Power BI Embedded and Power BI Custom Visuals
Explain about power BI Overview from Power BI Desktop, Power BI Service, Power BI Report Server and Power BI Mobile that consume all BI Data from Dataset and datamodel
This slide deck explains in a comprehensive way what Power BI is, how the Power BI architecture looks like and what the usage scenarios are for using Power BI and related tools
Business intelligence dashboards and data visualizations serve as a launching point for better business decision making. Learn how you can leverage Power BI to easily build reports and dashboards with interactive visualizations.
The presentation discusses the different aspects of Power BI like Power BI for O365, Data Discovery, Data Analysis, Data Visualization & Power Maps, Natural Language Search etc.
Its a business analytics solution presented by Netwoven at the Microsoft Power BI workshop held on Oct 30th at SVC Microsoft, Mountain View.
Power BI Desktop | Power BI Tutorial | Power BI Training | EdurekaEdureka!
This Edureka "Power BI Desktop" tutorial will help you to understand what is Power BI Desktop with examples and demo. Below are the topics covered in this tutorial:
1. Why Power BI?
2. What Power BI?
3. Who use Power BI?
4. Flow of Work
5. Power BI Trends
What is the Power BI and learn the Power BI by self and this presentation contains some use full links which help us at time of developing the Power BI.
BI: new of the buzz words that everyone is talking about but what is it? How can it be used to make a impact in my organization? How do I get started? This session was delivered for SharePoint Saturday Reston.
45 mins presentation @ the MVP Cloud RoadShow on April 11, 2015
In preview and recently available in Canada, Power BI. Insights are hiding in your company's data - see the impact of bringing them into focus with Power BI. Let Power BI organize your data. See it all in one place and make better decisions. The metrics you need to run your business on a dashboard. Make confident decisions knowing everyone is on the same page.
Power BI Governance and Development Best Practices - Presentation at #MSBIFI ...Jouko Nyholm
Selected slides from presentation regarding Power BI Governance and Development Best Practices. Presentation was held at MS BI & Power BI User Group Finland event 12.6.2018 at Microsoft Flux, Helsinki.
Without the animations & hands-on demos the slides do not tell the whole story, but hopefully valuable to some nevertheless.
Introduction to Power BI to make smart decisionsVIVEK GURURANI
Power BI: Business intelligence like never before!
Power BI is a tool that allows accounting and finance managers and professionals to have relevant information at the right time to make strategic decisions in a flexible, centralized, and secure way. Transform your business with predictive analytics, data visualization, and information in real-time, thanks to Power BI.
Presentation Agenda:
1. Introduction to Power BI
2. Why would your business need Power BI?
3. Power BI Architecture
4. Data Sanitization & Cleansing Capabilities
5. Analytical Insights
6. Generating Department Wise Reports & Visualizations
7. Latest & Upcoming Power BI features
8. Live Q&A
Power BI Training | Getting Started with Power BI | Power BI Tutorial | Power...Edureka!
This Edureka tutorial on "Getting started with Power BI" will provide you the fundamental knowledge of Power BI. Below are the topics covered in this tutorial:
1. What is Self Service Business Intelligence?
2. Why Power BI?
3. What is Power BI?
4. Demo on Power BI
Get technically equipped to grow and build your Power BI (Business Intelligence) practice, enabling you to offer new solutions and services to customers. With Power BI, you can transform your customers' data into rich visuals they can collect and organize, helping them focus on what matters most to their businesses.
Power BI Governance - Access Management, Recommendations and Best PracticesLearning SharePoint
This document outlines permissions management for Power BI Workspace and features of new admin, Member and Contributor Roles. Recommendations and best practices for sharing report are also included. Free to Download.
Power BI has in its DNA the goal of enabling everybody to experience their data any way, anywhere—in seconds and at global scale.
Power BI offers a set of capabilities that are uniquely enabled by its global and cloud nature:
The ability to harness data from Excel spreadsheets, on-premises data sources through the data gateway, big data, streaming data, and cloud services. It doesn’t matter what type of data you want or where it lives, Power BI allows you to connect to hundreds of data sources.
Out-of-the box SaaS content packs that deliver a curated experience with pre-built dashboards to get you up and running quickly. We have hundreds of ISVs building content packs to cater to the needs of millions of Power BI users.
Unmatched, unique ways for users to experience their data with speed and agility:
Live dashboards that maintain a real-time pulse on the business and provide critical insights.
Natural language query that enables users to simply and intuitively ask questions of their data, including through Cortana.
Custom visuals that bring data to life and surface intelligence hidden in the sea of data, with our community leveraging the Power BI visualization stack to create new ways to visualize data in a way that makes more sense. (Now available in the Office store.)
Integration of Power BI with the Microsoft stack. Power BI is part of larger ecosystem that integrates with services like Microsoft Teams, Office 365, and Dynamics 365. These services are aware of Power BI, are wired to Power BI, and enable you to use Power BI in the context of your work.
Anywhere access to insights. Whether in the office or on-the-go, Power BI provides anywhere access to insights with dashboards accessible via the desktop, on the web, or across mobile devices. Inside Excel, embedded—we have hundreds of ISVs embedding Power BI in their offerings.
Dans cette session nous vous présenterons les différentes manières d'utiliser SQL Server dans une infrastructure Cloud (Microsoft Azure). Seront présentés des scénarios hybrides, de migration, de backup, et d'hébergement de bases de données SQL Server en mode IaaS ou PaaS.
Azure Days 2019: Business Intelligence auf Azure (Marco Amhof & Yves Mauron)Trivadis
In dieser Session stellen wir ein Projekt vor, in welchem wir ein umfassendes BI-System mit Hilfe von Azure Blob Storage, Azure SQL, Azure Logic Apps und Azure Analysis Services für und in der Azure Cloud aufgebaut haben. Wir berichten über die Herausforderungen, wie wir diese gelöst haben und welche Learnings und Best Practices wir mitgenommen haben.
So you got a handle on what Big Data is and how you can use it to find business value in your data. Now you need an understanding of the Microsoft products that can be used to create a Big Data solution. Microsoft has many pieces of the puzzle and in this presentation I will show how they fit together. How does Microsoft enhance and add value to Big Data? From collecting data, transforming it, storing it, to visualizing it, I will show you Microsoft’s solutions for every step of the way
Azure SQL Database now has a Managed Instance, for near 100% compatibility for lifting-and-shifting applications running on Microsoft SQL Server to Azure. Contact me for more information.
1 Introduction to Microsoft data platform analytics for releaseJen Stirrup
Part 1 of a conference workshop. This forms the morning session, which looks at moving from Business Intelligence to Analytics.
Topics Covered: Azure Data Explorer, Azure Data Factory, Azure Synapse Analytics, Event Hubs, HDInsight, Big Data
The breath and depth of Azure products that fall under the AI and ML umbrella can be difficult to follow. In this presentation I’ll first define exactly what AI, ML, and deep learning is, and then go over the various Microsoft AI and ML products and their use cases.
The new Microsoft Azure SQL Data Warehouse (SQL DW) is an elastic data warehouse-as-a-service and is a Massively Parallel Processing (MPP) solution for "big data" with true enterprise class features. The SQL DW service is built for data warehouse workloads from a few hundred gigabytes to petabytes of data with truly unique features like disaggregated compute and storage allowing for customers to be able to utilize the service to match their needs. In this presentation, we take an in-depth look at implementing a SQL DW, elastic scale (grow, shrink, and pause), and hybrid data clouds with Hadoop integration via Polybase allowing for a true SQL experience across structured and unstructured data.
We live in a world of unprecedented change. To be successful in this world of change, you will need to develop a data culture, creating an environment where every team and every individual is empowered to do great things because of the data at their fingertips. In this event you will learn how to create a culture of data and how the Microsoft Modern BI platform and tools can help you to can harness the power of data once only reserved for data scientists. Learn about how to tap into the power of natural language, self-service business insights and visualization capabilities – and make insights available to anyone, anywhere, at any time.
Similar to Cepta The Future of Data with Power BI (20)
This are my keynote slides from SQL Saturday Oregon 2023 on AI and the Intersection of AI, Machine Learning and Economnic Challenges as a Technical Specialist
This is the second session of the learning pathway at PASS Summit 2019, which is still a stand alone session to teach you how to write proper Linux BASH scripts
Essentials of Automations: Optimizing FME Workflows with ParametersSafe Software
Are you looking to streamline your workflows and boost your projects’ efficiency? Do you find yourself searching for ways to add flexibility and control over your FME workflows? If so, you’re in the right place.
Join us for an insightful dive into the world of FME parameters, a critical element in optimizing workflow efficiency. This webinar marks the beginning of our three-part “Essentials of Automation” series. This first webinar is designed to equip you with the knowledge and skills to utilize parameters effectively: enhancing the flexibility, maintainability, and user control of your FME projects.
Here’s what you’ll gain:
- Essentials of FME Parameters: Understand the pivotal role of parameters, including Reader/Writer, Transformer, User, and FME Flow categories. Discover how they are the key to unlocking automation and optimization within your workflows.
- Practical Applications in FME Form: Delve into key user parameter types including choice, connections, and file URLs. Allow users to control how a workflow runs, making your workflows more reusable. Learn to import values and deliver the best user experience for your workflows while enhancing accuracy.
- Optimization Strategies in FME Flow: Explore the creation and strategic deployment of parameters in FME Flow, including the use of deployment and geometry parameters, to maximize workflow efficiency.
- Pro Tips for Success: Gain insights on parameterizing connections and leveraging new features like Conditional Visibility for clarity and simplicity.
We’ll wrap up with a glimpse into future webinars, followed by a Q&A session to address your specific questions surrounding this topic.
Don’t miss this opportunity to elevate your FME expertise and drive your projects to new heights of efficiency.
State of ICS and IoT Cyber Threat Landscape Report 2024 previewPrayukth K V
The IoT and OT threat landscape report has been prepared by the Threat Research Team at Sectrio using data from Sectrio, cyber threat intelligence farming facilities spread across over 85 cities around the world. In addition, Sectrio also runs AI-based advanced threat and payload engagement facilities that serve as sinks to attract and engage sophisticated threat actors, and newer malware including new variants and latent threats that are at an earlier stage of development.
The latest edition of the OT/ICS and IoT security Threat Landscape Report 2024 also covers:
State of global ICS asset and network exposure
Sectoral targets and attacks as well as the cost of ransom
Global APT activity, AI usage, actor and tactic profiles, and implications
Rise in volumes of AI-powered cyberattacks
Major cyber events in 2024
Malware and malicious payload trends
Cyberattack types and targets
Vulnerability exploit attempts on CVEs
Attacks on counties – USA
Expansion of bot farms – how, where, and why
In-depth analysis of the cyber threat landscape across North America, South America, Europe, APAC, and the Middle East
Why are attacks on smart factories rising?
Cyber risk predictions
Axis of attacks – Europe
Systemic attacks in the Middle East
Download the full report from here:
https://sectrio.com/resources/ot-threat-landscape-reports/sectrio-releases-ot-ics-and-iot-security-threat-landscape-report-2024/
Securing your Kubernetes cluster_ a step-by-step guide to success !KatiaHIMEUR1
Today, after several years of existence, an extremely active community and an ultra-dynamic ecosystem, Kubernetes has established itself as the de facto standard in container orchestration. Thanks to a wide range of managed services, it has never been so easy to set up a ready-to-use Kubernetes cluster.
However, this ease of use means that the subject of security in Kubernetes is often left for later, or even neglected. This exposes companies to significant risks.
In this talk, I'll show you step-by-step how to secure your Kubernetes cluster for greater peace of mind and reliability.
Smart TV Buyer Insights Survey 2024 by 91mobiles.pdf91mobiles
91mobiles recently conducted a Smart TV Buyer Insights Survey in which we asked over 3,000 respondents about the TV they own, aspects they look at on a new TV, and their TV buying preferences.
UiPath Test Automation using UiPath Test Suite series, part 3DianaGray10
Welcome to UiPath Test Automation using UiPath Test Suite series part 3. In this session, we will cover desktop automation along with UI automation.
Topics covered:
UI automation Introduction,
UI automation Sample
Desktop automation flow
Pradeep Chinnala, Senior Consultant Automation Developer @WonderBotz and UiPath MVP
Deepak Rai, Automation Practice Lead, Boundaryless Group and UiPath MVP
Software Delivery At the Speed of AI: Inflectra Invests In AI-Powered QualityInflectra
In this insightful webinar, Inflectra explores how artificial intelligence (AI) is transforming software development and testing. Discover how AI-powered tools are revolutionizing every stage of the software development lifecycle (SDLC), from design and prototyping to testing, deployment, and monitoring.
Learn about:
• The Future of Testing: How AI is shifting testing towards verification, analysis, and higher-level skills, while reducing repetitive tasks.
• Test Automation: How AI-powered test case generation, optimization, and self-healing tests are making testing more efficient and effective.
• Visual Testing: Explore the emerging capabilities of AI in visual testing and how it's set to revolutionize UI verification.
• Inflectra's AI Solutions: See demonstrations of Inflectra's cutting-edge AI tools like the ChatGPT plugin and Azure Open AI platform, designed to streamline your testing process.
Whether you're a developer, tester, or QA professional, this webinar will give you valuable insights into how AI is shaping the future of software delivery.
GraphRAG is All You need? LLM & Knowledge GraphGuy Korland
Guy Korland, CEO and Co-founder of FalkorDB, will review two articles on the integration of language models with knowledge graphs.
1. Unifying Large Language Models and Knowledge Graphs: A Roadmap.
https://arxiv.org/abs/2306.08302
2. Microsoft Research's GraphRAG paper and a review paper on various uses of knowledge graphs:
https://www.microsoft.com/en-us/research/blog/graphrag-unlocking-llm-discovery-on-narrative-private-data/
JMeter webinar - integration with InfluxDB and GrafanaRTTS
Watch this recorded webinar about real-time monitoring of application performance. See how to integrate Apache JMeter, the open-source leader in performance testing, with InfluxDB, the open-source time-series database, and Grafana, the open-source analytics and visualization application.
In this webinar, we will review the benefits of leveraging InfluxDB and Grafana when executing load tests and demonstrate how these tools are used to visualize performance metrics.
Length: 30 minutes
Session Overview
-------------------------------------------
During this webinar, we will cover the following topics while demonstrating the integrations of JMeter, InfluxDB and Grafana:
- What out-of-the-box solutions are available for real-time monitoring JMeter tests?
- What are the benefits of integrating InfluxDB and Grafana into the load testing stack?
- Which features are provided by Grafana?
- Demonstration of InfluxDB and Grafana using a practice web application
To view the webinar recording, go to:
https://www.rttsweb.com/jmeter-integration-webinar
Elevating Tactical DDD Patterns Through Object CalisthenicsDorra BARTAGUIZ
After immersing yourself in the blue book and its red counterpart, attending DDD-focused conferences, and applying tactical patterns, you're left with a crucial question: How do I ensure my design is effective? Tactical patterns within Domain-Driven Design (DDD) serve as guiding principles for creating clear and manageable domain models. However, achieving success with these patterns requires additional guidance. Interestingly, we've observed that a set of constraints initially designed for training purposes remarkably aligns with effective pattern implementation, offering a more ‘mechanical’ approach. Let's explore together how Object Calisthenics can elevate the design of your tactical DDD patterns, offering concrete help for those venturing into DDD for the first time!
Dev Dives: Train smarter, not harder – active learning and UiPath LLMs for do...UiPathCommunity
💥 Speed, accuracy, and scaling – discover the superpowers of GenAI in action with UiPath Document Understanding and Communications Mining™:
See how to accelerate model training and optimize model performance with active learning
Learn about the latest enhancements to out-of-the-box document processing – with little to no training required
Get an exclusive demo of the new family of UiPath LLMs – GenAI models specialized for processing different types of documents and messages
This is a hands-on session specifically designed for automation developers and AI enthusiasts seeking to enhance their knowledge in leveraging the latest intelligent document processing capabilities offered by UiPath.
Speakers:
👨🏫 Andras Palfi, Senior Product Manager, UiPath
👩🏫 Lenka Dulovicova, Product Program Manager, UiPath
7. Not Just One
Step
It’s not just connect Power BI to
data sources, it’s:
Extract
Transform
Load
◦ But where to?
◦ How?
◦ What is required?
8.
9. Data Science VM
• Customized pre-configured
VM for data science pros
Deep Learning VM
• GPU based VM for training
deep learning models
Azure Machine Learning
• Predictive analytics services for
creating, deploying, &
managing predictive models
DataScienceTools
VisualizationTools
Reference
Architecture
Azure
Azure Active Directory
• Identity management & authentication across
Azure resources
Data sources
• Relational databases
• File exports
• Big data sources
Azure Data Factory
• PaaS hybrid ETL/ELT
service
• Can move data via
Data Factory Pipelines
or SSIS packages
Power BI
• SaaS analytics
• Excel integration
• Seamless, native
integration w/
Azure data sources
Excel
• Self-service analytics
• Pivot tables & charts
3rd Party
Visualization Tools
• Tools connecting
to SQL & Analysis
Services
AzureSynapseAnalytics
Azure Analysis Services
• PaaS semantic model
• Centralized calculations,
hierarchies, KPIs, etc.
• In-memory, compressed
Azure SQL Database
• PaaS SQL database
• Built in DR & HA
• On-demand scale
DataMarts&VirtualizedLayer
Azure Data Catalog
• Fully managed cloud metadata repository
• Enable data discovery & capturing team tribal knowledge
Azure Monitor
• Monitor cloud & on-premises environments to
maintain performance & availability
Power BI
Report Server
• Paginated reports
• Pixel perfect reports
• Document
generation
• Data driven
subscriptions
SQL Pool
SQL
Python
.NET
Java
R
Scala
Azure Synapse Studio
• Management
• Monitoring
• Security
• MetaStore
10. My Scripts to Deploy this All…
https://github.com/Dbakevlar/Modern-Data-Warehouse
12. Azure Synapse Analytics
Integrated data platform for BI, AI and continuous intelligence
Platform
Azure
Data Lake Storage
Common Data Model
Enterprise Security
Optimized for Analytics
METASTORE
SECURITY
MANAGEMENT
MONITORING
DATA INTEGRATION
Analytics Runtimes
PROVISIONED ON-DEMAND
Form Factors
SQL
Languages
Python .NET Java Scala R
Experience Synapse Analytics Studio
Artificial Intelligence / Machine Learning / Internet of Things
Intelligent Apps / Business Intelligence
METASTORE
SECURITY
MANAGEMENT
MONITORING
13. Azure (15) Database & DW (26) File Storage (6) NoSQL (3) Services and App (28) Generic (4)
Blob storage Amazon Redshift Oracle Amazon S3 Cassandra Amazon MWS Oracle Service Cloud Generic HTTP
Cosmos DB - SQL API DB2 Phoenix File system Couchbase Common Data Service PayPal Generic OData
Cosmos DB - MongoDB API Drill PostgreSQL FTP MongoDB Concur QuickBooks Generic ODBC
Data Explorer Google BigQuery Presto Google Cloud Storage Dynamics 365 Salesforce Generic REST
Data Lake Storage Gen1 Greenplum SAP BW Open Hub HDFS Dynamics AX Salesforce Service Cloud
Data Lake Storage Gen2 HBase SAP BW via MDX SFTP Dynamics CRM Salesforce Marketing Cloud
Database for MariaDB Hive SAP HANA Google AdWords SAP Cloud for Customer (C4C)
Database for MySQL Apache Impala SAP table HubSpot SAP ECC
Database for PostgreSQL Informix Spark Jira ServiceNow
File Storage MariaDB SQL Server Magento Shopify
SQL Database Microsoft Access Sybase Marketo Square
SQL Database MI MySQL Teradata Office 365 Web table
SQL Data Warehouse Netezza Vertica Oracle Eloqua Xero
Search index Oracle Responsys Zoho
Table storage
90+ Connectors out of the box
15. Develop Hub
Overview
It provides development experience to
query, analyze, model data
Benefits
Multiple languages to analyze data
under one umbrella
Switch over notebooks and scripts
without loosing content
Code intellisense offers reliable code
development
16. OVER clause
Defines a window or specified set of rows within a query
result set
Computes a value for each row in the window
Aggregate functions
COUNT, MAX, AVG, SUM, APPROX_COUNT_DISTINCT,
MIN, STDEV, STDEVP, STRING_AGG, VAR, VARP,
GROUPING, GROUPING_ID, COUNT_BIG, CHECKSUM_AGG
Ranking functions
RANK, NTILE, DENSE_RANK, ROW_NUMBER
Analytical functions
LAG, LEAD, FIRST_VALUE, LAST_VALUE, CUME_DIST,
PERCENTILE_CONT, PERCENTILE_DISC, PERCENT_RANK
ROWS | RANGE
PRECEDING, UNBOUNDING PRECEDING, CURRENT ROW,
BETWEEN, FOLLOWING, UNBOUNDED FOLLOWING
Windowing functions
SELECT
ROW_NUMBER() OVER(PARTITION BY PostalCode ORDER BY SalesYTD DESC
) AS "Row Number",
LastName,
SalesYTD,
PostalCode
FROM Sales
WHERE SalesYTD <> 0
ORDER BY PostalCode;
Row Number LastName SalesYTD PostalCode
1 Mitchell 4251368.5497 98027
2 Blythe 3763178.1787 98027
3 Carson 3189418.3662 98027
4 Reiter 2315185.611 98027
5 Vargas 1453719.4653 98027
6 Ansman-Wolfe 1352577.1325 98027
1 Pak 4116870.2277 98055
2 Varkey Chudukaktil 3121616.3202 98055
3 Saraiva 2604540.7172 98055
4 Ito 2458535.6169 98055
5 Valdez 1827066.7118 98055
6 Mensa-Annan 1576562.1966 98055
7 Campbell 1573012.9383 98055
8 Tsoflias 1421810.9242 98055
Azure Synapse Analytics > SQL >
17. Overview
A materialized view pre-computes, stores, and maintains its
data in Azure SQL Data Warehouse like a table.
Materialized views are automatically updated when data in
underlying tables are changed. This is a synchronous
operation that occurs as soon as the data is changed.
The auto caching functionality allows SQL DW Query
Optimizer to consider using indexed view even if the view is
not referenced in the query.
Supported aggregations: MAX, MIN, AVG, COUNT,
COUNT_BIG, SUM, VAR, STDEV
Benefits
Automatic and synchronous data refresh with data changes
in base tables. No user action is required.
High availability and resiliency as regular tables
Materialized views
-- Create indexed view
CREATE INDEXED VIEW Sales.vw_Orders
WITH
(
DISTRIBUTION = ROUND_ROBIN |
HASH(ProductID)
)
AS
SELECT SUM(UnitPrice*OrderQty) AS Revenue,
OrderDate,
ProductID,
COUNT_BIG(*) AS OrderCount
FROM Sales.SalesOrderDetail
GROUP BY OrderDate, ProductID;
GO
-- Disable index view and put it in suspended mode
ALTER INDEX ALL ON Sales.vw_Orders DISABLE;
-- Re-enable index view by rebuilding it
ALTER INDEX ALL ON Sales.vw_Orders REBUILD;
Azure Synapse Analytics > SQL >
20. SQL On-Demand
Overview
An interactive query service that provides T-SQL queries over
high scale data in Azure Storage.
Benefits
Serverless
No infrastructure
Pay only for query execution
No ETL
Offers security
Data integration with Databricks, HDInsight
T-SQL syntax to query data
Supports data in various formats (Parquet, CSV, JSON)
Support for BI ecosystem
Azure Synapse Analytics > SQL >
Azure Storage
SQL On
Demand
Query
Power BI
Azure Data Studio
SSMS
SQL DW
Read and write
data files
Curate and transform data
Sync table
definitions
Read and write
data files
21. Languages
Overview
Supports multiple languages to develop
notebook
• PySpark (Python)
• Spark (Scala)
• .NET Spark (C#)
• Spark SQL
Benefits
Allows to write multiple languages in one
notebook
%%<Name of language>
Offers use of temporary tables across
languages
23. What Happens to Existing Azure SQL
Data Warehouse?
Its not going “away”
Current SQL Data Warehouses will continue
Azure Portal will soon display “Synapse SQL Pool”, which is more accurately named
◦ SQL Pool
◦ SQL On-demand
◦ Spark Pool
◦ Code Artifacts
◦ Metadata
24. Data Is Ready- Now What?
Push to Azure DB
Leave in Azure Data Lake Storage
Connect to Analysis Services for Multi-dimensional Modeling
Power BI for final modeling and visualizations/reports/dashboards/apps
Use third party tools with data
42. What Kinds of Visualizations?
Choose from numerous modern visualization types:
◦ Filter data:
◦ Slicer
◦ Display numeric values:
◦ Card, Multi Row Card, Table, Matrix, KPI
◦ Graphically visualize data:
◦ Bar, Column, Line, Combo, Scatter, Waterfall, Pie, Donut,
Funnel, Treemap, Gauge, R Script
◦ Spatially visualize data:
◦ Map, Filled map, Shape map (preview)
https://powerbi.microsoft.com/en-us/developers/custom-visualization/
43. Custom Visuals
Custom visuals can be imported to extend beyond the out-of-the-box visualizations
◦ A gallery of visuals created by the Power BI community is available at https://app.powerbi.com/visuals
◦ Browse through the visuals or submit one of your
own for others to use
◦ The list of available visuals is growing each month
◦ Custom visuals will render in the Power BI service
46. What Data
Sources
Can Power
BI Connect
TO?
Over 100 different data sources
What is available in the service may be
be different than the desktop
If hybrid connection, (on-prem/non-
Azure cloud) the Power BI Gateway
will be required
47. Get [A LOT
OF] Data
**Custom connectors can also
be created.
50. Modeling Data
Work in Data View to inspect, explore, and understand data in the
model
It is a different experience from how you can view tables, columns, and
data in Query Editor
This is a view of the data after it has been loaded into the model
53. Measures
Uses DAX, (Data Analysis Expressions)
Over 200 functions, operators and constructs
Incredibly flexible
Similar to Excel formulas, (MDX) but designed to work with relational data
54. KPIs
Key Performance Indicators, (KPIs) also called
“strategic measures”
◦ Helps understand if company goals are being
achieved
◦ Goal values must be part of the dataset in Power BI
55. KPI Demonstration
Choose the data
Choose the timeline for the KPI
Sort by the indicator
Change to a KPI visual
Update any fields
61. Row Level Security
Excludes data from visualizations and reports
Is set up at report level
Uses DAX Filters
Filters assigned to roles
Assigned to users and groups through roles
Admins can test out roles before releasing to
production
64. Power BI Gateway
The Power BI Gateway—Personal is used to refresh supported on-
premises data sources
Only available in 64-bit
Runs as a service if configured with an administrator account;
otherwise runs as an application
Data transfer is secured (SSL) through Azure Service Bus
Often no requirement to open firewall ports, (unless VM installation)
Certain scenarios cannot be scheduled for data refresh:
Custom SQL statements
Excel worksheet data
Direct Connect or DirectQuery data sources
65. Power BI Gateway- Enterprise
Installation of the On-Premises Data Gateway serves large groups of users
to refresh supported on-premises data sources
It is the successor to the Power BI Gateway—Enterprise
IT can:
Centrally manage the set of users who have access to the underlying data
sources
Gain visibility into gateway usage, such as most commonly accessed data
sources, and the users accessing them
Data sources:
SQL Server Analysis Services
(Multidimensional and Tabular modes)
SQL Server
Oracle, Teradata, SAP HANA…
78. Content Packs to Apps- Why?
Allows for distinct collection of reports/dashboards/visualizations
One link to access them all vs. searching
Package and distribute
Notifications, alerting and row level security
79. Creating a Content Pack/App
Significantly Easy
No Code Solution
Allows you to share multiple reports/dashboards/datasets with groups/users
Can embed URL to other applications
81. Summary
Power BI has extensive visualizations, reporting and
dashboard analytics features
Ability to pull data from over 100 data sources
As part of the larger analytics solution with Azure
Synapse Analytics, an enterprise solution for
analytics, IOT and machine learning can be created
with ease.
82. Resources
Power BI site
http://powerbi.microsoft.com
Power BI documentation
http://support.powerbi.com/
Power BI community
http://community.powerbi.com/
Power BI blog
http://blogs.msdn.com/b/powerbi/
83. References
Power BI Desktop knowledge base
https://support.powerbi.com/knowledgebase/topics/68530-power-bi-desktop
Tips and tricks for creating reports in Power BI Desktop
https://support.powerbi.com/knowledgebase/articles/464157-tips-and-tricks-for-
creating-reports-in-power-bi-d
DAX Resource Center
http://social.technet.microsoft.com/wiki/contents/articles/1088.dax-resource-
center.aspx
Power BI Visuals Gallery
https://app.powerbi.com/visuals
A ZB of data is 1 trillion GB and currently, we currently product 16.3ZB per year
Up from .01ZB in 2013, 50ZB in 2019
49% of this in public clouds
Over 30% will be created in real time by IOT and other devices
$1.6 trillian in sales by 2025 from IOT
1 interaction every 18 seconds
most popular IoT devices of streaming device, home automation, and smart speaker are found in over 20% of homes in the United States.
23% of IOT investment is in Smart City initiatives
It won’t be as much about collecting all the data, but strategically choosing what to collect that is of value
Where in education, “unique student identifier” numbers make it possible for data to be readily aggregated without revealing individual identity and for analysts to investigate things like learning gains by pupils in various schools and circumstances.
Data is now the key strategic asset whether we’re talking about business, healthcare, or education.
Everything that’s happening in the world around us - is producing incredibly rich data that can help us create new experiences, new efficiencies, new models and even new inventions.
Leveraging this data can be the differentiator for your students, classroom, school, and district.
While data is pervasive, actionable intelligence from data is elusive.
The educators that I’ve been working with want to transform data to intelligent action and reinvent their education processes.
In the past, this has not been easy.
To do this, these educators need to be able to effectively and quickly analyze their data – so they can move from seeing “what happened” and understanding “why it happened” to predicting “what will happen” and ultimately, knowing “what should I do”.
Doing so will allow them to become an even more intelligent and effective educator.
The Microsoft data platform brings AI to your data so you gain deep knowledge about your business and customers like never before. Only Microsoft brings machine learning to database engines and to the edge, for faster predictions and better security.
What we used to deploy
Customers often needed the same ecosystem to achieve their goals.
Limitless Analytics Service
Houses the thing most companies want: two primary analytics systems: Datawarehouses and data lakes
Petabyte SCALE
Very simple to deploy for customers
For those of use that use SQL, this offers us advanced functions to work with analytics queries that are essential to our job.
Current Limitations:
If MIN/MAX aggregates are used in the SELECT list, the indexed view will automatically be disabled when UPDATE and DELETE occur in the referenced base tables. Run ALTER INDEX with REBUILD to re-enable the indexed view
Only INNER JOIN is supported
Only HASH and ROUND_ROBIN distributions are supported
Only CLUSTERED COLUMNSTORE INDEX is supported
ALTER VIEW is not supported
Power BI
Power BI is a cloud-based business analytics service that enables anyone to visualize and analyze data with greater speed, efficiency, and understanding. It connects users to a broad range of live data through easy-to-use dashboards, provides interactive reports, and delivers compelling visualizations that bring data to life.
Power BI in many ways is a connector between people and the power of the Microsoft Data Platform including data that lives in the cloud, your on-premise databases, in Excel spreadsheets or text files.
You don’t have to be a technical expert, data scientist, or statistician to take advantage of the wide variety of intelligence analytical capabilities that we have - statistical analysis, machine learning, building custom application.
All of this advanced technology and the value of converting data into intelligence flows through Power BI.
Stay connected from any device
Power BI mobile apps are available for iPhone, iPad, Android Phone, and Windows 8.1.
Power BI dashboards
With updates to Power BI customers can now see all their data through a single pane of glass. Live Power BI dashboards show visualizations and KPIs from data that reside both on-premises and in the cloud, providing a consolidated view across their business regardless of where their data lives.
Simplifying how you interact with data, natural language query is built into the dashboard allowing users to type questions and receive answers from data in the form of interactive visualizations.
You can then explore their data further by drilling through the dashboard into the underlying reports, discovering new insights that they can pin back to the dashboard to monitor performance going forward.
Go over top features
Power BI Knowledgebase: https://support.powerbi.com/knowledgebase/topics/65160-visualizations-in-reports
Tip: Hover the cursor of each icon to reveal a tooltip description of the visualization type
https://app.powerbi.com/visuals
https://www.census.gov/programs-surveys/ase/data.html
Doownload data and then bring into Power BI with get data
The three views provide alternate user experiences to work with their model.
Create queries and use the Query Editor to filter, cleanse and reshape data
Configure/refine relationships to establish the foundations of a model
Enrich the model with calculation logic and formatting
Design interactive reports with a broad range of modern data visualizations
Publish solutions directly to the Power BI service
Ability to transform data right from Power BI. Data can be saved, refreshed
Import and direct query with transformation
Rename columns, tables from the data modeling interface or from the main visuals.
Power BI knowledgebase: https://support.powerbi.com/knowledgebase/articles/663202-data-view-in-power-bi-desktop
Measures calculate a result from an expression formula. When you create your own measures, you’ll use the Data Analysis Expressions (DAX) formula language. DAX includes a library of over 200 functions, operators, and constructs. Its library provides immense flexibility in creating measures to calculate results for just about any data analysis need.
DAX formulas are a lot like Excel formulas. DAX even has many of the same functions as Excel, such like DATE, SUM, and LEFT. But, DAX’s functions are meant to work with relational data like we have in Power BI Desktop.
To build a KPI example, use the kscope tbl pbix and use revenue
Indicator - controls the indicator’s display units and decimal places.
Trend axis - when set to On, the visual shows the trend axis as the background of the KPI visual.
Goals - when set to On, the visual shows the goal and the distance from the goal as a percentage.
Color coding > Direction - people consider some KPIs better for higher values and consider some better for lower values. For example, earnings versus wait time. Typically a higher value of earnings is better versus a higher value of wait time. Select high is good and, optionally, change the color settings.
Insert Ask your data
Ask questions like, “What is the “calculation/column/row” over the “calculation/column/rows”
Power BI will create the best visual to display the data.
It will offer best suggestions based on what is already built
Power BI Knowledgebase: https://support.powerbi.com/knowledgebase/topics/70394-q-a-in-power-bi
View Performance Analyzer
Using a common web page, we’ll “scrape” data from an HTML page and create a table to be used for analytics
https://www.edweek.org/ew/issues/education-statistics/index.html
Pull in table and do an HTML scrape
Pull it in as is and separated
Transform the data by splitting the column
Rename the columns
Build out visuals from the data
Allows hybrid connectivity to Power BI from on-prem data sources and non-Azure cloud
Must be managed by your organization
Easy to set up and maintain
Power BI Knowledgebase: https://support.powerbi.com/knowledgebase/articles/474669-data-refresh-in-power-bi
Power BI Knowledgebase: https://powerbi.microsoft.com/en-us/documentation/powerbi-gateway-enterprise/
A dashboard often has all info clearly displayed. It can be interactive when research is required, but should give a clear view of the current status of a situation or scenario.
Power BI Knowledgebase: https://support.powerbi.com/knowledgebase/topics/65158-all-about-dashboards
Note: Live dashboards can be achieved with Azure Stream Analytics integration or the Power BI REST API. Both topics are covered later in this course.
Ability to use Excel from Power BI with a .odc file, (office Data connection) file
May need to download OLE DB plugin to be used with this, a one-time download
Can generate a QR Code of the report to be used to access it/share the report
View Notifications, NOT WHERE YOU SET THEM UP.
Settings, which we’ll get to in a minute.
Download- Demonstrate
Help & Support, plus feedback
Storage Admin- Manage Group Storage will take you to the current workspace storage you’re in. If you want to switch, click on the workspace and then options settings Manage Group Storage.
Content packs are just as they sound- content created in the format you want from various reports, dashboards, etc.
They are being replaced by Power BI Apps
Managed embedded codes here for any that might need updating or testing.
Considerable configuration options for Power BI service here
Under dashborads, datasets and workbooks, there are settings here for each one in each category.
For datasets, this is where you can configure your connection settings for the gateway of data sources that require a gateway.
See all your data lineage in a report, dashboard, app
This is the lineage for the data for my app.
Use this slide to provide relevant resources to allow attendees to continue with deeper content.