
Download as PDF, PPTX

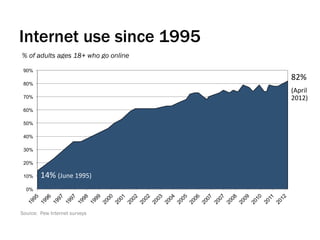
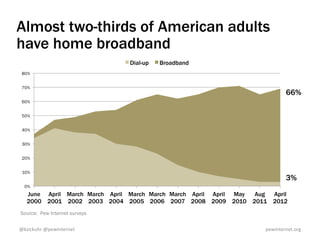
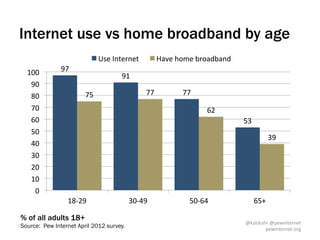
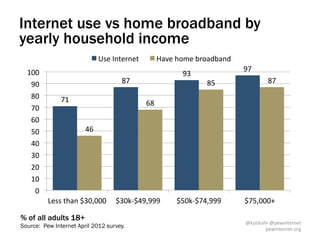
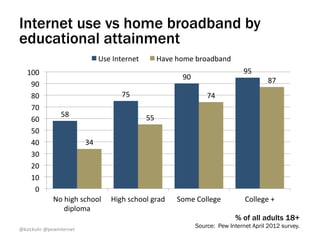
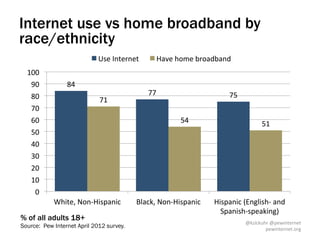
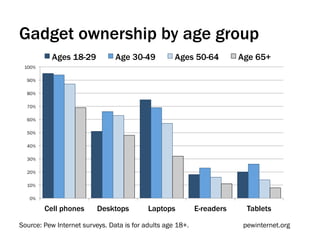
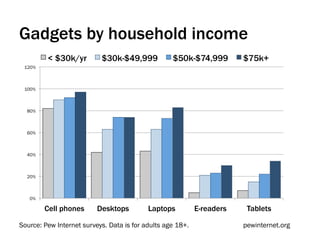
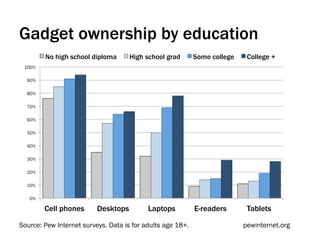
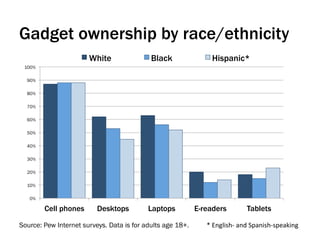
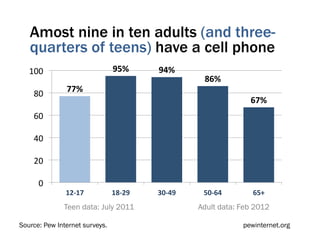

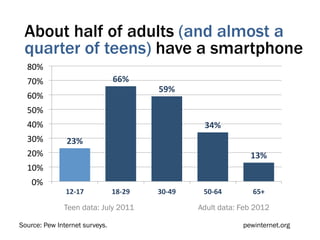
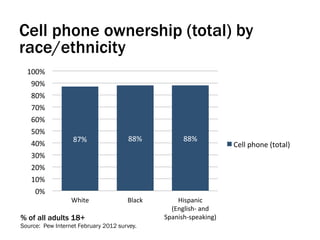

- The document discusses internet and mobile device usage trends in the United States based on surveys conducted by the Pew Research Center. - Key findings include that 82% of American adults now use the internet, with 66% having home broadband access. Cell phone ownership is near universal at 95% of adults, while about half of adults and a quarter of teens have smartphones. - Internet and technology adoption varies based on age, income, education levels, and race/ethnicity. Younger, wealthier, and more educated Americans are more likely to use broadband and own the latest digital devices.


