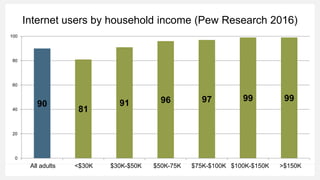
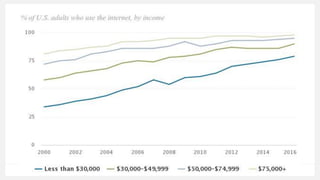
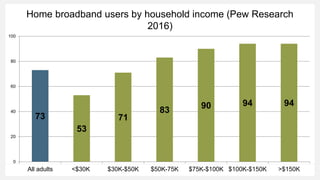
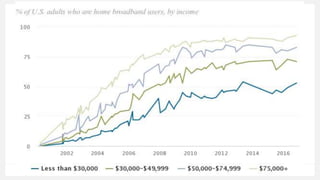
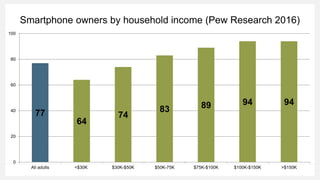
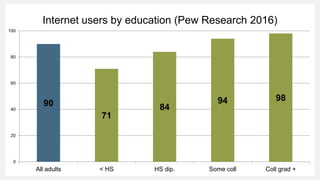
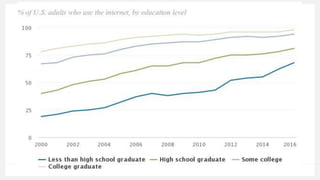
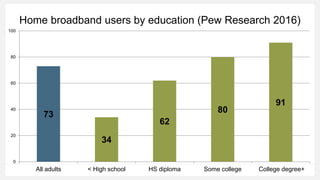
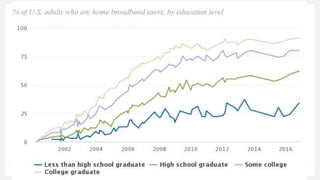
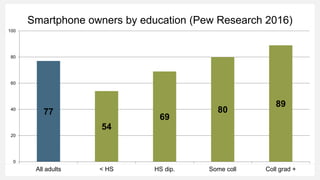
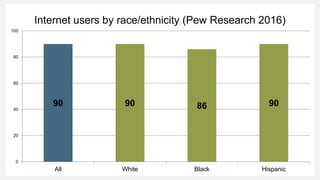
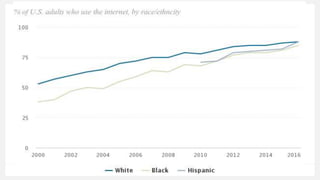
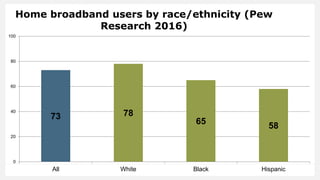
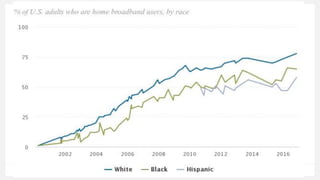
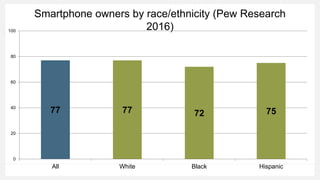
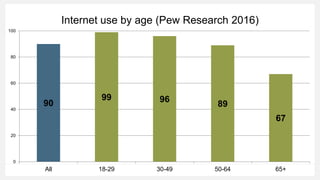
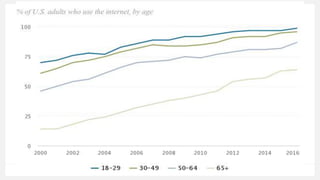
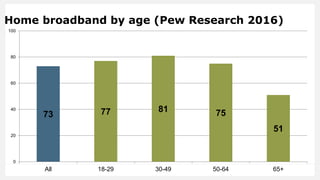
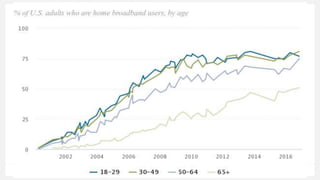
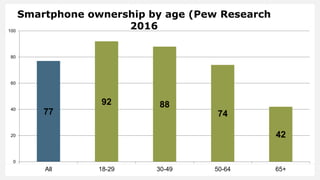
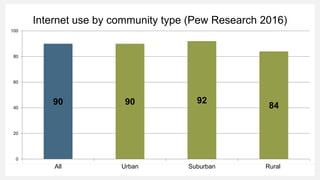
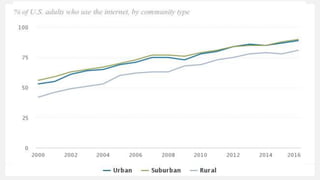
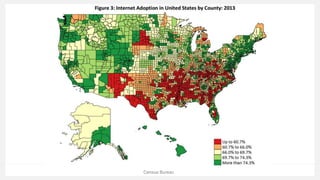
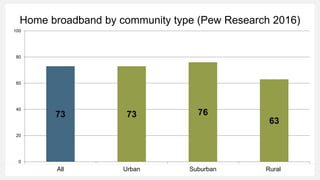
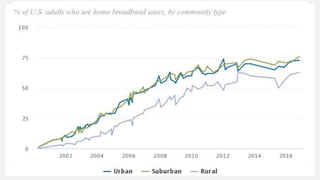
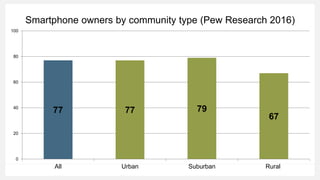
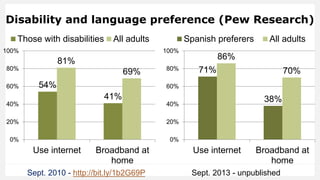
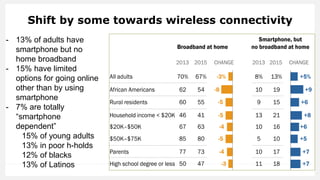
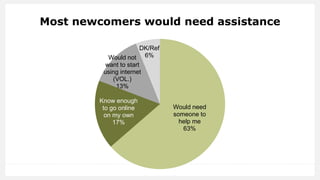
Digital Divides
Lee Rainie
Director Internet, Science and Technology Research
2.9.17
Feeding America
Internet
Home broadband
Smartphone
Household income
Internet users by household income (Pew Research 2016)
90
81
91 96 97 99 99
0
20
40
60
80
100
All adults <$30K $30K-$50K $50K-75K $75K-$100K $100K-$150K >$150K
Home broadband users by household income (Pew Research
2016)
73
53
71
83 90 94 94
0
20
40
60
80
100
All adults <$30K $30K-$50K $50K-75K $75K-$100K $100K-$150K >$150K
Smartphone owners by household income (Pew Research 2016)
77
64
74
83 89 94 94
0
20
40
60
80
100
All adults <$30K $30K-$50K $50K-75K $75K-$100K $100K-$150K >$150K
Educational attainment
Internet users by education (Pew Research 2016)
90
71
84
94 98
0
20
40
60
80
100
All adults < HS HS dip. Some coll Coll grad +
Home broadband users by education (Pew Research 2016)
73
34
62
80
91
0
20
40
60
80
100
All adults < High school HS diploma Some college College degree+
Smartphone owners by education (Pew Research 2016)
77
54
69
80
89
0
20
40
60
80
100
All adults < HS HS dip. Some coll Coll grad +
Race and ethnicity
Internet users by race/ethnicity (Pew Research 2016)
90 90 86 90
0
20
40
60
80
100
All White Black Hispanic
Home broadband users by race/ethnicity (Pew
Research 2016)
73 78
65 58
0
20
40
60
80
100
All White Black Hispanic
Smartphone owners by race/ethnicity (Pew Research
2016)
77 77 72 75
0
20
40
60
80
100
All White Black Hispanic
Age
Internet use by age (Pew Research 2016)
90
99 96
89
67
0
20
40
60
80
100
All 18-29 30-49 50-64 65+
Home broadband by age (Pew Research 2016)
73 77 81 75
51
0
20
40
60
80
100
All 18-29 30-49 50-64 65+
Smartphone ownership by age (Pew Research
2016
77
92 88
74
42
0
20
40
60
80
100
All 18-29 30-49 50-64 65+
Community type
Internet use by community type (Pew Research 2016)
90 90 92
84
0
20
40
60
80
100
All Urban Suburban Rural
Census Bureau
Home broadband by community type (Pew Research 2016)
73 73 76
63
0
20
40
60
80
100
All Urban Suburban Rural
Smartphone owners by community type (Pew Research 2016)
77 77 79
67
0
20
40
60
80
100
All Urban Suburban Rural
Disability and language preference (Pew Research)
54%
41%
81%
69%
0%
20%
40%
60%
80%
100%
Use internet Broadband at
home
Those with disabilities All adults
Sept. 2010 - http://bit.ly/1b2G69P
71%
38%
86%
70%
0%
20%
40%
60%
80%
100%
Use internet Broadband at
home
Spanish preferers All adults
Sept. 2013 - unpublished
Shift by some towards wireless connectivity
- 13% of adults have
smartphone but no
home broadband
- 15% have limited
options for going online
other than by using
smartphone
- 7% are totally
“smartphone
dependent”
15% of young adults
13% in poor h-holds
12% of blacks
13% of Latinos
Most newcomers would need assistance
Would need
someone to
help me
63%
Know enough
to go online
on my own
17%
Would not
want to start
using internet
(VOL.)
13%
DK/Ref
6%
Thank you!

Digital Divides – Feeding America

  • 1.
    Digital Divides Lee Rainie DirectorInternet, Science and Technology Research 2.9.17 Feeding America
  • 2.
  • 3.
  • 4.
    Internet users byhousehold income (Pew Research 2016) 90 81 91 96 97 99 99 0 20 40 60 80 100 All adults <$30K $30K-$50K $50K-75K $75K-$100K $100K-$150K >$150K
  • 6.
    Home broadband usersby household income (Pew Research 2016) 73 53 71 83 90 94 94 0 20 40 60 80 100 All adults <$30K $30K-$50K $50K-75K $75K-$100K $100K-$150K >$150K
  • 8.
    Smartphone owners byhousehold income (Pew Research 2016) 77 64 74 83 89 94 94 0 20 40 60 80 100 All adults <$30K $30K-$50K $50K-75K $75K-$100K $100K-$150K >$150K
  • 9.
  • 10.
    Internet users byeducation (Pew Research 2016) 90 71 84 94 98 0 20 40 60 80 100 All adults < HS HS dip. Some coll Coll grad +
  • 12.
    Home broadband usersby education (Pew Research 2016) 73 34 62 80 91 0 20 40 60 80 100 All adults < High school HS diploma Some college College degree+
  • 14.
    Smartphone owners byeducation (Pew Research 2016) 77 54 69 80 89 0 20 40 60 80 100 All adults < HS HS dip. Some coll Coll grad +
  • 15.
  • 16.
    Internet users byrace/ethnicity (Pew Research 2016) 90 90 86 90 0 20 40 60 80 100 All White Black Hispanic
  • 18.
    Home broadband usersby race/ethnicity (Pew Research 2016) 73 78 65 58 0 20 40 60 80 100 All White Black Hispanic
  • 20.
    Smartphone owners byrace/ethnicity (Pew Research 2016) 77 77 72 75 0 20 40 60 80 100 All White Black Hispanic
  • 21.
  • 22.
    Internet use byage (Pew Research 2016) 90 99 96 89 67 0 20 40 60 80 100 All 18-29 30-49 50-64 65+
  • 24.
    Home broadband byage (Pew Research 2016) 73 77 81 75 51 0 20 40 60 80 100 All 18-29 30-49 50-64 65+
  • 26.
    Smartphone ownership byage (Pew Research 2016 77 92 88 74 42 0 20 40 60 80 100 All 18-29 30-49 50-64 65+
  • 27.
  • 28.
    Internet use bycommunity type (Pew Research 2016) 90 90 92 84 0 20 40 60 80 100 All Urban Suburban Rural
  • 30.
  • 31.
    Home broadband bycommunity type (Pew Research 2016) 73 73 76 63 0 20 40 60 80 100 All Urban Suburban Rural
  • 33.
    Smartphone owners bycommunity type (Pew Research 2016) 77 77 79 67 0 20 40 60 80 100 All Urban Suburban Rural
  • 34.
    Disability and languagepreference (Pew Research) 54% 41% 81% 69% 0% 20% 40% 60% 80% 100% Use internet Broadband at home Those with disabilities All adults Sept. 2010 - http://bit.ly/1b2G69P 71% 38% 86% 70% 0% 20% 40% 60% 80% 100% Use internet Broadband at home Spanish preferers All adults Sept. 2013 - unpublished
  • 35.
    Shift by sometowards wireless connectivity - 13% of adults have smartphone but no home broadband - 15% have limited options for going online other than by using smartphone - 7% are totally “smartphone dependent” 15% of young adults 13% in poor h-holds 12% of blacks 13% of Latinos
  • 36.
    Most newcomers wouldneed assistance Would need someone to help me 63% Know enough to go online on my own 17% Would not want to start using internet (VOL.) 13% DK/Ref 6%
  • 37.