Downloaded 40 times


![What these
changes
[could] mean
for libraries](https://image.slidesharecdn.com/digitaldifferences-120720000252-phpapp02/85/Digital-differences-58-320.jpg)

![“Our library is a critical
link in our community.
It provides access to
books, computers,
[and] knowledge, and is
a critical social center.”
– E-book-borrowing patron](https://image.slidesharecdn.com/digitaldifferences-120720000252-phpapp02/85/Digital-differences-65-320.jpg)

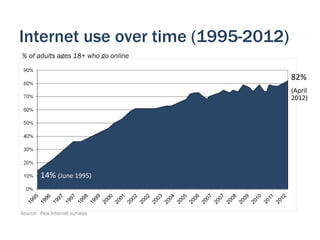
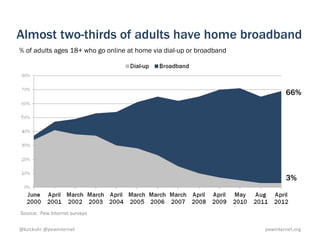
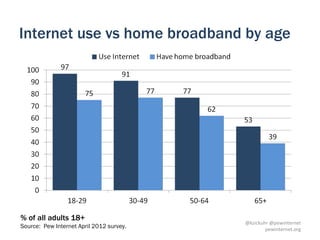
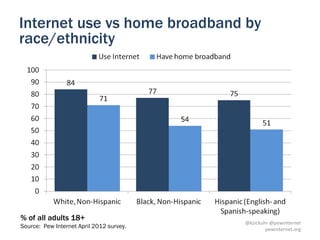
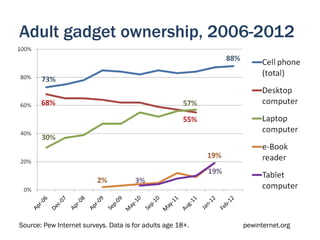
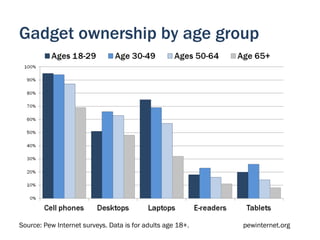
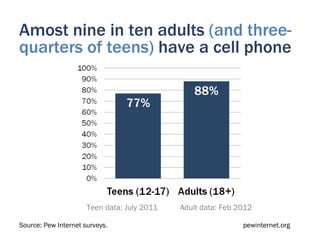
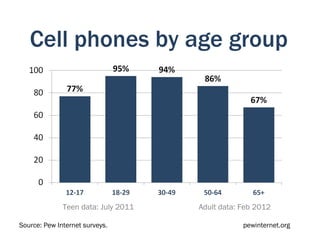
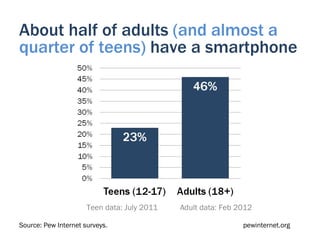
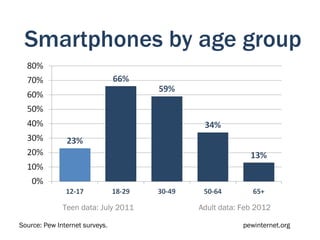
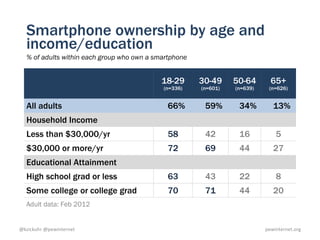
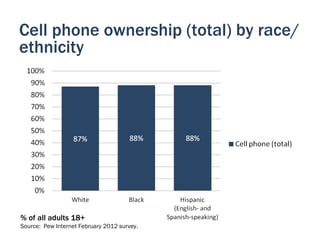
This document summarizes a presentation given by Kathryn Zickuhr of the Pew Research Center's Internet & American Life Project. The presentation discusses trends in digital technology use among Americans, including growth in internet access and smartphone/tablet ownership over time. It also examines differences in technology adoption and activities across age, income, education and racial/ethnic groups. Key findings include that 82% of American adults now go online, 66% have home broadband, and about half own smartphones. Tablet and e-reader ownership has also grown substantially in recent years.