
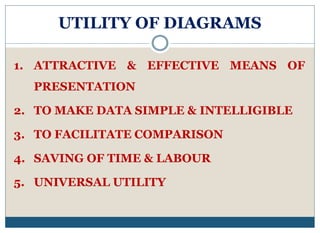
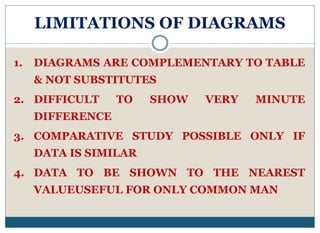
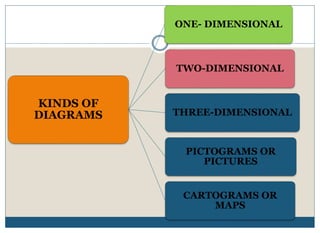
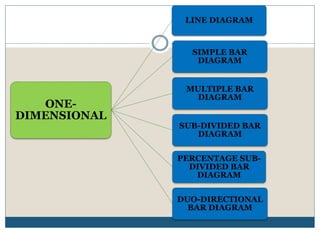
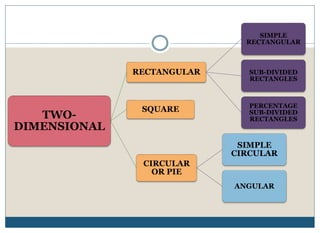
The document discusses the utility and limitations of diagrams. It notes that diagrams are an attractive and effective means of presentation that make data simple and intelligible, facilitate comparison, and save time and labor. However, diagrams are complementary to tables and not substitutes, have difficulty showing very minute differences, and only allow for comparative study if the data is similar. The document also categorizes diagrams as one-dimensional, two-dimensional, three-dimensional, or pictograms/maps and provides examples of types within each category.


