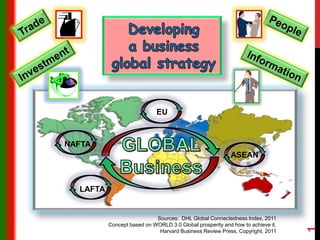
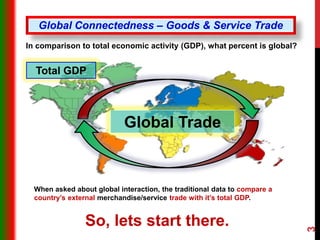
Sources: DHL Global Connectedness Index, 2011
Concept based on WORLD 3.0 Global prosperity and how to achieve it,
Harvard Business Review Press, Copyright, 2011
1
NAFTA
LAFTA
EU
ASEAN
World is flat.
The world is one huge market.
Anything or anyone can go anywhere, anytime.
Do you think this is true?
Are there barriers to connectedness?
2
Global Connectedness – Goods & Service Trade
In comparison to total economic activity (GDP), what percent is global?
When asked about global interaction, the traditional data to compare a
country’s external merchandise/service trade with it’s total GDP.
So, lets start there.
Global Trade
3
Total GDP
Global Connectedness – Merchandise & Service Trade
With both merchandise and service international trade at only 30% of the
world GDP, there is still a great deal of growth potential. This 22% could
actually be closer to 15% if you consider re-exporting of semi-finished
products exported to another country for final processing and supplied to
the end user. We could be connected a great deal more.
1930
9%
of GDP
2015
22%
of GDP
Growth in trade
connectedness
Source: DHL Global Connectedness Index, 2016
4
Japan’s Global Connectedness – Merchandise & Service Trade
Japan’s external trade ratio is well below the average.
It is mainly due to it large domestic market. It has
much room for expansion.
Outward
15%
of GDP
Inward
16%
of GDP
Source: DHL Global Connectedness Index, 2016
From worldwide suppliers
To worldwide
markets
5
USA’s Global Connectedness – Merchandise & Service Trade
The United States’ external trade ratio is below the
average. It is mainly due to it large domestic market
too. It can expand much more.
Outward
8%
of GDP
Inward
13%
of GDP Source: DHL Global Connectedness Index, 2016
USA
From worldwide
suppliers
To worldwide
markets
6
China’s Global Connectedness – Merchandise & Service Trade
The China’s external trade ratio is closer to the average. This
might be one of the main reasons China has such high growth. It
is helped by valuable imports and it is financed by exports. In the
future, serving the domestic market will become more important as
wealth is created.
Outward
21%
of GDP
Inward
15%
of GDP
Source: DHL Global Connectedness Index, 2016
China
From worldwide
suppliers
To worldwide
markets
7
Global Connectedness – Foreign Direct Investment (FDI)
Source: DHL Global Connectedness Index, 2011
FDI peeked
in
2000
20%
of capital
formation
Foreign direct investment (FDI) to capital formation
(Total investment in fixed assets)
FDI settled in
2010
10%
of capital formation
FDI fell in
2007
15%
of capital
formation
There is great global economic benefits of FDI (financial transfer, technical
transfer, business knowhow transfer, etc.)
8
Global Connectedness – Financial Movement
Source: “Home Bias in International Equity Portfolios: A Review (August 2007)
Foreign equity investment (share purchase only)
Foreign equity investment
2005 ~ 2007
20%
of all investments
There is much room for foreigners investing in foreign companies. It
trust and better communication continues to grow so should
investment.
9
Global Connectedness – Communication & Information
20%
of all internet connections are international.
5%
of all phone calls are international.
Source: DHL Global Connectedness Index, 2011
We could communicate and share information much more than we are
now. This would build trust, investment and greater prosperity.
10
53/140
Bits per second per
internet user
International calls
International email
63/140
Outward per minutes/capita
112/140
Inward per minutes/capita
Source: DHL Global Connectedness Index, 2012
(World ranking among 140 countries (99% of world GDP and 95% of population)
Japan’s Global Ranking – Telephone/Internet Communication
Of 140
countries
Outward calls
Inward calls
11
Outward email data
Inward email data
Visiting foreign countries & foreign populations
1.9%
Of Japanese
population is
from another
country.
Source: UN report Trends in International Migrant Stock: The 2015 Revision.
14.3%
Of USA
population is
from another
country.
Connecting face-to-face
What percent of the world population are from foreign countries?
3% of the world population live outside of their home country.
What percent of the world population have studied in a foreign country?
2% of university student have studied outside their country.
What professionals are foreigners in the US?
33% of USA engineers are from foreign countries.
27% of USA mathematician, statisticians and computer science
specialists are from foreign countries.
24% of USA scientists and researches are from foreign countries.
12
United Arab Emirates 7,826,981 83.7
Singapore 2,323,252 42.9
Switzerland 2,438,702 28.9
Israel 2,046,873 26.5
New Zealand 1,132,736 25.1
Germany 12,005,690 14.9
United States 46,627,102 14.3
Sweden 1,639,771 14.3
United Kingdom 8,543,120 11.3
France 7,784,418 11.1
Greece 1,242,514 11.1
Italy 5,788,875 8.0
Russia 11,643,276 7.7
Turkey 4,580,678 5.81
Japan 2,437,169 1.9
India 5,338,486 0.4
Egypt 297,448 0.4
China 848,511 0.1
Indonesia 295,433 0.1
Vietnam 68,290 0.1
Visiting foreign countries & foreign populations
Connecting face-to-face
(foreign population & percentage of total population)
THE BENEFIT: Advanced cultural diversity, learning,
teaching, blending, interaction and understanding
13
20% 40% 60% 80% 100%0
Source: Concept based on Redefining Global Strategy,
Crossing Borders in a World Where Differences Still Matters, Harvard Business School Press, Copyright, 2007
Global Connectedness – Overall Summary
Level of international connection
International to domestic telephone calls
Foreign university students to total
Management research with global content to total
Charity to foreign country to domestic
Foreign direct investment to capital formation
Foreign tourists to total
Foreign related patents to domestic
Foreign held stock to domestic
Foreign trade to GDP
Immigrants to total population
14
40% 80% 120% 160% 200%0
Source: Pankaj Ghemawat and Rajiv Malick, “The Industry-Level Structure of International Trade Networks: A
Gravity-Based Approach”, working paper, Harvard Business School, February 2003
Global Connectedness – Overall Summary
Factors that improve connected (over average)
Common
language
Colony or
colonizer
Common
currency
Common land
border
Common regional
trading block
+188%
+114%
+125%
+42%
+47%
15
Looking at foreign markets & production bases
Differences from us & other regions
Source: World 3.0 GLOBAL PROSPERITY AND HOW TO ACHIEVE IT
Are all other regions very different from us?
Are there great differences between us and the other location?
Is there great distance between us and the other location?
In World 3.0 both distance and differences still matter greatly. Those
differences must be explored in each case to determine the ideal level of
connectedness. Some issues should be kept at the local level, other
issues at the global level.
Yes No
16
CAGE - Differences
Source: World 3.0 GLOBAL PROSPERITY AND HOW TO ACHIEVE IT
G-Geographic – Are there great geographic differences?
E-Economic – Are there great economic differences?
A-Administrative – Are there great administrative differences?
C-Culture – Are there great cultural differences?
Yes No
17
C- Cultural Differences – Industry Sensitivity Indicators
Source: World 3.0 GLOBAL PROSPERITY AND HOW TO ACHIEVE IT
Country of Origin – Is country of origin a major concern?
Language – Is high language communication skill required?
Tastes – Are there great preference/standards differences?
Traditions – Are there strong historic traditions in the industry?
Yes No
18
A- Administrative Differences – Industry Sensitivity Indicators
Source: World 3.0 GLOBAL PROSPERITY AND HOW TO ACHIEVE IT
Government Involvement – Is the government involved in
funding, procurement, standard-setting, etc?
Yes No
National Priority – Is this industry of strategic national priority?
Rigidity/flexibility – Are the products highly specialized,
capital intensive (can affect potential and risks)?
Restraints – Are there strong operating procedure restrictions
(imports, exports, FDI)?
19
G- Geographic Distance – Industry Sensitivity Indicators
Source: World 3.0 GLOBAL PROSPERITY AND HOW TO ACHIEVE IT
Hazards/fragile – Is quality transportation and freight hazards a concern?
Weight/Value – Are the products high weight & low value?
Perishable – Does the product lose its value quickly (time-sensitive)?
Yes No
20
E – Economic Distance – Industry Sensitivity Indicators
Source: World 3.0 GLOBAL PROSPERITY AND HOW TO ACHIEVE IT
Yes No
Cost Content – Is the product costing heavily dependent on local
factors (labor, material process, equipment, etc.)?
Scale – Is it difficult to standardize the product
to suit a wide range of international markets?
Pricing – Are the products price sensitive? Price negotiations on
price is very common when deciding to buy?
Distribution – Is the supply chain poorly developed and very
different from your home market?
21
What global connectedness offers (ADDING)
Source: Redefining Global Strategy, Pankaj Ghemawat, Harvard Business School Press, 2007
A – ADDING BUSINESS, production volume/economies of scale
D – DECREASING COSTS through regional costing differences
D – DIFFERENTIATING, offering different products
and solutions to increase willingness to pay more
I – IMPROVING COMPETITIVE ADVANTAGE
and bargaining power
N – NORMALIZE RISKS as success in one market
balances failures in others
G – GENERATING CAPACITY by spreading
and diffusing knowledge
22
ADDING Value Scorecard – A – Adding volume, or growth
Source: Redefining Global Strategy, Pankaj Ghemawat, Harvard Business School Press, 2007
Confirm the goals of entering a foreign market
or producing overseas
Forecast the profit potential of added growth and volume
Forecast potential on a global level, regional level,
national level, distributor level and end-user level
Determine the company capacity for expansion
Determine the effect of volume on competitiveness
Determine added supply requirements
23
ADDING Value Scorecard – D – Decrease Costs
Source: Redefining Global Strategy, Pankaj Ghemawat, Harvard Business School Press, 2007
24
Confirm where the cost reduction will come from
(separate all costs)
Explore any added cost that might occur
Explore any potential indirect costs
Project long-term cost increases
Determine fixed cost, variable costs and break-even point
Determine main factors that determine costs
increases/decreases (like currency movements)
Estimate any potential shortages that could influence costs
ADDING Value Scorecard – D – Differentiating
& increasing willingness to pay
Source: Redefining Global Strategy, Pankaj Ghemawat, Harvard Business School Press, 2007
Look at R & D-to-sales and advertising-to-sales ratios
in industry and your strengths among competitors
Focus on customer willingness to pay and product benefit
to them
Project impact of differentiation by global changes
Anticipate competitor reaction to your global strategy
Segment market appropriately
25
ADDING Value Scorecard – I – Improving bargaining power
Source: Redefining Global Strategy, Pankaj Ghemawat, Harvard Business School Press, 2007
Determine international differences in industry profitability
Determine any market entry/exit bearers
Determine customer switching bearers
Determine potential for substitution
Determine change on influence with suppliers
Determine change on influence on customers
Determine moves of competitors to response to your
cross-border operation
Explore and react to regulatory and nonmarket restraints
and local business ethics
26
ADDING Value Scorecard – N – Neutralizing risks
Source: Redefining Global Strategy, Pankaj Ghemawat, Harvard Business School Press, 2007
Identify the key risks in your industry
(capital intensity, labor concerns, supply
shortages, legal restrictions,
demand volatility)
Assess how much cross-boarder operations
reduce or increase risks
Compare benefits to risks by cross-boarder
operation
27
Risk rating for material development projects in rural areas
Source: Nippon Export and Investment Insurance
A Japan, Singapore, Germany, USA, Britain
B South Korea, Spain, Slovakia
C China, Malaysia, Poland, Chile
D Russia, India, Thailand, Mexico, Algeria, Morocco
E Philippines, Turkey, Hungary, Colombia
F Vietnam, Greece, Egypt, Angola
G Cambodia, Honduras, Cameroon, Bolivia
H North Korea, Myanmar, Iraq, Lebanon, Libya
Review national risk rating by governments, insurance companies
and financial institutions. They specialize in risk management.
Below is just on source rating anywhere in these countries. The
higher the risk, the greater the profit potential must be.
Highest
Lowest
RISK
28
ADDING Value Scorecard – G – Generating knowledge,
resources and capacity
Source: Redefining Global Strategy, Pankaj Ghemawat, Harvard Business School Press, 2007
Access local specifications and learn user requirements
Access local distribution requirements
Explore similar capacities that could be of value
Hold discussions with suppliers, consultants, target users,
distributors, political leaders and local firms
Hire people who are open, willing to learn and adapt
Create cross-boarder teams in diverse locations
Expand on cross-boarder interaction and assignments
Explore
valuable
diversity
29
Strategies for Global Value Creation
Source: Redefining Global Strategy, Pankaj Ghemawat, Harvard Business School Press, 2007
TRANSFER
EXPERTISE
Offer
new value
ADAPTATION
Make appropriate
market &
production
adjustments WEALTH
CREATION
Confirm profit
potential
30
Strategies for Global Value Creation - Adaption
Source: Redefining Global Strategy, Pankaj Ghemawat, Harvard Business School Press, 2007
ADAPTATION
Make appropriate
market &
production
adjustments
31
Strategies for Global Value Creation - Adaption
Source: Redefining Global Strategy, Pankaj Ghemawat, Harvard Business School Press, 2007
Design: reduce
process costs
Use production standardization,
platforms and modules to
reduce production costs
Focus: reduce
need for costly
variation
Target a specific region,
segment, product line or
value chain process
Innovation:
improve
effectiveness
Explore new
applications and
combinations for
the foreign market
Variation
Modify the product and
marketing promotional
program.
Externalization: reduce
variation burden
Outsource certain functions through
strategic alliances, franchising, etc.
32
Strategies for Global Value Creation – Transfer Expertise
Source: Redefining Global Strategy, Pankaj Ghemawat, Harvard Business School Press, 2007
TRANSFER
EXPERTISE
Offer
new value
33
Transferring expertise – Regional strategies
Source: Redefining Global Strategy, Pankaj Ghemawat, Harvard Business School Press, 2007
1. Regional or home focus: One processing location
mainly service home market. Small amount of second
market attention
2. Regional portfolio: Move to one off-shore foreign direct
investment to supply that market
3. Regional hub: Create an off-shore production operation
to serve the surrounding markets in that region
4. Regional platforms: Standardize components in each
production operation to supply several regions
5. Regional mandates: Awarding certain regions
assignments to specialize in specific global
responsibilities and roles.
6. Regional networks: A broad configuration of
coordinated processes to supply the whole cross-
boarder network of markets
90% of global companies
34
3. Regional hub
R2R1
1. Regional focus
R2R1
2. Regional portfolio
R2R1
= One product line
R = Region = minor effort
= minor effort
Home production,
major and minor
markets.
Major and minor
production, cross
sharing products
Major and minor
production, major
and minor markets
Increasing complexity & managerial challenge
with regional development issues,
supervision issues and coordination issues
Transferring expertise – Regional strategies review
35
6. Regional networks
R2R1
4. Platforms
R2
5. Regional Mandates
R2R1R1
Even more of a complex
managerial challenge
= One product line
R = Region = minor effort
= minor effort
R4R3
Products and
components for
global markets
Massive,
coordinated and
controls worldwide
supply system.
HQ request for
production
specialization for
global markets
Transferring expertise – Regional strategies review
36
Strategies for Global Value Creation – Wealth creation
Source: Redefining Global Strategy, Pankaj Ghemawat, Harvard Business School Press, 2007
WEALTH
CREATION
Confirm profit
potential
37
Wealth Creation – Questions to ask
Source: Redefining Global Strategy, Pankaj Ghemawat, Harvard Business School Press, 2007
1. Volume: Can wealth be created by adding volume
across-boarders?
2. Costs: Can costs be reduced by cross-boarder projects?
3. Differentiation: Can differentiation be created by cross-
boarder activities which increase willingness to buy?
4. Bargaining Power: Will bargaining power be improved
by crossing boarders?
5. Risks: Will risks be reduced by going across boarders?
6. Capacity: Will added skills, valuable experience and
knowledge be gained which will increase capacity
through foreign market activities?
38
Combinations of global value creation strategies
Source: Redefining Global Strategy, Pankaj Ghemawat, Harvard Business School Press, 2007
Selling products across boarders
Transfer
expertise
mainly as is
Adapt
mainly to local
market
Producing products across boarders
Ideal point
Ideal point
Where should your company be on these lines?
Where is the competition on these lines?
What will be your competitive advantage?
39
Getting started using a refined global strategy analysis
Source: Redefining Global Strategy, Pankaj Ghemawat, Harvard Business School Press, 2007
1. Performance Review: In what regions is the customer
underserved for your product? Can they be profitably
supplied?
2. Industry’s competitive environment: Who are the top
players in the industry? What cross-boarder production is
there? Are products standardized? Are prices moving up
or down? What is the relationship between costing and
volume? What is the main distribution method? How
important is advertising/marketing, R&D, labor costs,
capital investment in your industry?
3. CAGE: Do the CAGE analysis and determine market
differences.
4. Global Value Creation: Using the ADAPTATION, TRANSFER
EXPERTISE, WEALTH CREATION material, determine what
value could be created.
5. ADDING: Do the ADDING analysis and determine your ideal
strategy.
40
41
A successful global strategy has many benefits:
1. It can help a company expand when its industry is declining.
2. It can help a company reduce its costs much more that it can
in its home market only.
3. It can make a company far more competitive than its
competitors.
4. It can give a company bargaining power it does not have in
its domestic market only.
5. It can reduce a company’s overall risks.
6. It can provide great experiences which will develop its
overall abilities.

Developing a global strategy

  • 1.
    Sources: DHL GlobalConnectedness Index, 2011 Concept based on WORLD 3.0 Global prosperity and how to achieve it, Harvard Business Review Press, Copyright, 2011 1 NAFTA LAFTA EU ASEAN
  • 2.
    World is flat. Theworld is one huge market. Anything or anyone can go anywhere, anytime. Do you think this is true? Are there barriers to connectedness? 2
  • 3.
    Global Connectedness –Goods & Service Trade In comparison to total economic activity (GDP), what percent is global? When asked about global interaction, the traditional data to compare a country’s external merchandise/service trade with it’s total GDP. So, lets start there. Global Trade 3 Total GDP
  • 4.
    Global Connectedness –Merchandise & Service Trade With both merchandise and service international trade at only 30% of the world GDP, there is still a great deal of growth potential. This 22% could actually be closer to 15% if you consider re-exporting of semi-finished products exported to another country for final processing and supplied to the end user. We could be connected a great deal more. 1930 9% of GDP 2015 22% of GDP Growth in trade connectedness Source: DHL Global Connectedness Index, 2016 4
  • 5.
    Japan’s Global Connectedness– Merchandise & Service Trade Japan’s external trade ratio is well below the average. It is mainly due to it large domestic market. It has much room for expansion. Outward 15% of GDP Inward 16% of GDP Source: DHL Global Connectedness Index, 2016 From worldwide suppliers To worldwide markets 5
  • 6.
    USA’s Global Connectedness– Merchandise & Service Trade The United States’ external trade ratio is below the average. It is mainly due to it large domestic market too. It can expand much more. Outward 8% of GDP Inward 13% of GDP Source: DHL Global Connectedness Index, 2016 USA From worldwide suppliers To worldwide markets 6
  • 7.
    China’s Global Connectedness– Merchandise & Service Trade The China’s external trade ratio is closer to the average. This might be one of the main reasons China has such high growth. It is helped by valuable imports and it is financed by exports. In the future, serving the domestic market will become more important as wealth is created. Outward 21% of GDP Inward 15% of GDP Source: DHL Global Connectedness Index, 2016 China From worldwide suppliers To worldwide markets 7
  • 8.
    Global Connectedness –Foreign Direct Investment (FDI) Source: DHL Global Connectedness Index, 2011 FDI peeked in 2000 20% of capital formation Foreign direct investment (FDI) to capital formation (Total investment in fixed assets) FDI settled in 2010 10% of capital formation FDI fell in 2007 15% of capital formation There is great global economic benefits of FDI (financial transfer, technical transfer, business knowhow transfer, etc.) 8
  • 9.
    Global Connectedness –Financial Movement Source: “Home Bias in International Equity Portfolios: A Review (August 2007) Foreign equity investment (share purchase only) Foreign equity investment 2005 ~ 2007 20% of all investments There is much room for foreigners investing in foreign companies. It trust and better communication continues to grow so should investment. 9
  • 10.
    Global Connectedness –Communication & Information 20% of all internet connections are international. 5% of all phone calls are international. Source: DHL Global Connectedness Index, 2011 We could communicate and share information much more than we are now. This would build trust, investment and greater prosperity. 10
  • 11.
    53/140 Bits per secondper internet user International calls International email 63/140 Outward per minutes/capita 112/140 Inward per minutes/capita Source: DHL Global Connectedness Index, 2012 (World ranking among 140 countries (99% of world GDP and 95% of population) Japan’s Global Ranking – Telephone/Internet Communication Of 140 countries Outward calls Inward calls 11 Outward email data Inward email data
  • 12.
    Visiting foreign countries& foreign populations 1.9% Of Japanese population is from another country. Source: UN report Trends in International Migrant Stock: The 2015 Revision. 14.3% Of USA population is from another country. Connecting face-to-face What percent of the world population are from foreign countries? 3% of the world population live outside of their home country. What percent of the world population have studied in a foreign country? 2% of university student have studied outside their country. What professionals are foreigners in the US? 33% of USA engineers are from foreign countries. 27% of USA mathematician, statisticians and computer science specialists are from foreign countries. 24% of USA scientists and researches are from foreign countries. 12
  • 13.
    United Arab Emirates7,826,981 83.7 Singapore 2,323,252 42.9 Switzerland 2,438,702 28.9 Israel 2,046,873 26.5 New Zealand 1,132,736 25.1 Germany 12,005,690 14.9 United States 46,627,102 14.3 Sweden 1,639,771 14.3 United Kingdom 8,543,120 11.3 France 7,784,418 11.1 Greece 1,242,514 11.1 Italy 5,788,875 8.0 Russia 11,643,276 7.7 Turkey 4,580,678 5.81 Japan 2,437,169 1.9 India 5,338,486 0.4 Egypt 297,448 0.4 China 848,511 0.1 Indonesia 295,433 0.1 Vietnam 68,290 0.1 Visiting foreign countries & foreign populations Connecting face-to-face (foreign population & percentage of total population) THE BENEFIT: Advanced cultural diversity, learning, teaching, blending, interaction and understanding 13
  • 14.
    20% 40% 60%80% 100%0 Source: Concept based on Redefining Global Strategy, Crossing Borders in a World Where Differences Still Matters, Harvard Business School Press, Copyright, 2007 Global Connectedness – Overall Summary Level of international connection International to domestic telephone calls Foreign university students to total Management research with global content to total Charity to foreign country to domestic Foreign direct investment to capital formation Foreign tourists to total Foreign related patents to domestic Foreign held stock to domestic Foreign trade to GDP Immigrants to total population 14
  • 15.
    40% 80% 120%160% 200%0 Source: Pankaj Ghemawat and Rajiv Malick, “The Industry-Level Structure of International Trade Networks: A Gravity-Based Approach”, working paper, Harvard Business School, February 2003 Global Connectedness – Overall Summary Factors that improve connected (over average) Common language Colony or colonizer Common currency Common land border Common regional trading block +188% +114% +125% +42% +47% 15
  • 16.
    Looking at foreignmarkets & production bases Differences from us & other regions Source: World 3.0 GLOBAL PROSPERITY AND HOW TO ACHIEVE IT Are all other regions very different from us? Are there great differences between us and the other location? Is there great distance between us and the other location? In World 3.0 both distance and differences still matter greatly. Those differences must be explored in each case to determine the ideal level of connectedness. Some issues should be kept at the local level, other issues at the global level. Yes No 16
  • 17.
    CAGE - Differences Source:World 3.0 GLOBAL PROSPERITY AND HOW TO ACHIEVE IT G-Geographic – Are there great geographic differences? E-Economic – Are there great economic differences? A-Administrative – Are there great administrative differences? C-Culture – Are there great cultural differences? Yes No 17
  • 18.
    C- Cultural Differences– Industry Sensitivity Indicators Source: World 3.0 GLOBAL PROSPERITY AND HOW TO ACHIEVE IT Country of Origin – Is country of origin a major concern? Language – Is high language communication skill required? Tastes – Are there great preference/standards differences? Traditions – Are there strong historic traditions in the industry? Yes No 18
  • 19.
    A- Administrative Differences– Industry Sensitivity Indicators Source: World 3.0 GLOBAL PROSPERITY AND HOW TO ACHIEVE IT Government Involvement – Is the government involved in funding, procurement, standard-setting, etc? Yes No National Priority – Is this industry of strategic national priority? Rigidity/flexibility – Are the products highly specialized, capital intensive (can affect potential and risks)? Restraints – Are there strong operating procedure restrictions (imports, exports, FDI)? 19
  • 20.
    G- Geographic Distance– Industry Sensitivity Indicators Source: World 3.0 GLOBAL PROSPERITY AND HOW TO ACHIEVE IT Hazards/fragile – Is quality transportation and freight hazards a concern? Weight/Value – Are the products high weight & low value? Perishable – Does the product lose its value quickly (time-sensitive)? Yes No 20
  • 21.
    E – EconomicDistance – Industry Sensitivity Indicators Source: World 3.0 GLOBAL PROSPERITY AND HOW TO ACHIEVE IT Yes No Cost Content – Is the product costing heavily dependent on local factors (labor, material process, equipment, etc.)? Scale – Is it difficult to standardize the product to suit a wide range of international markets? Pricing – Are the products price sensitive? Price negotiations on price is very common when deciding to buy? Distribution – Is the supply chain poorly developed and very different from your home market? 21
  • 22.
    What global connectednessoffers (ADDING) Source: Redefining Global Strategy, Pankaj Ghemawat, Harvard Business School Press, 2007 A – ADDING BUSINESS, production volume/economies of scale D – DECREASING COSTS through regional costing differences D – DIFFERENTIATING, offering different products and solutions to increase willingness to pay more I – IMPROVING COMPETITIVE ADVANTAGE and bargaining power N – NORMALIZE RISKS as success in one market balances failures in others G – GENERATING CAPACITY by spreading and diffusing knowledge 22
  • 23.
    ADDING Value Scorecard– A – Adding volume, or growth Source: Redefining Global Strategy, Pankaj Ghemawat, Harvard Business School Press, 2007 Confirm the goals of entering a foreign market or producing overseas Forecast the profit potential of added growth and volume Forecast potential on a global level, regional level, national level, distributor level and end-user level Determine the company capacity for expansion Determine the effect of volume on competitiveness Determine added supply requirements 23
  • 24.
    ADDING Value Scorecard– D – Decrease Costs Source: Redefining Global Strategy, Pankaj Ghemawat, Harvard Business School Press, 2007 24 Confirm where the cost reduction will come from (separate all costs) Explore any added cost that might occur Explore any potential indirect costs Project long-term cost increases Determine fixed cost, variable costs and break-even point Determine main factors that determine costs increases/decreases (like currency movements) Estimate any potential shortages that could influence costs
  • 25.
    ADDING Value Scorecard– D – Differentiating & increasing willingness to pay Source: Redefining Global Strategy, Pankaj Ghemawat, Harvard Business School Press, 2007 Look at R & D-to-sales and advertising-to-sales ratios in industry and your strengths among competitors Focus on customer willingness to pay and product benefit to them Project impact of differentiation by global changes Anticipate competitor reaction to your global strategy Segment market appropriately 25
  • 26.
    ADDING Value Scorecard– I – Improving bargaining power Source: Redefining Global Strategy, Pankaj Ghemawat, Harvard Business School Press, 2007 Determine international differences in industry profitability Determine any market entry/exit bearers Determine customer switching bearers Determine potential for substitution Determine change on influence with suppliers Determine change on influence on customers Determine moves of competitors to response to your cross-border operation Explore and react to regulatory and nonmarket restraints and local business ethics 26
  • 27.
    ADDING Value Scorecard– N – Neutralizing risks Source: Redefining Global Strategy, Pankaj Ghemawat, Harvard Business School Press, 2007 Identify the key risks in your industry (capital intensity, labor concerns, supply shortages, legal restrictions, demand volatility) Assess how much cross-boarder operations reduce or increase risks Compare benefits to risks by cross-boarder operation 27
  • 28.
    Risk rating formaterial development projects in rural areas Source: Nippon Export and Investment Insurance A Japan, Singapore, Germany, USA, Britain B South Korea, Spain, Slovakia C China, Malaysia, Poland, Chile D Russia, India, Thailand, Mexico, Algeria, Morocco E Philippines, Turkey, Hungary, Colombia F Vietnam, Greece, Egypt, Angola G Cambodia, Honduras, Cameroon, Bolivia H North Korea, Myanmar, Iraq, Lebanon, Libya Review national risk rating by governments, insurance companies and financial institutions. They specialize in risk management. Below is just on source rating anywhere in these countries. The higher the risk, the greater the profit potential must be. Highest Lowest RISK 28
  • 29.
    ADDING Value Scorecard– G – Generating knowledge, resources and capacity Source: Redefining Global Strategy, Pankaj Ghemawat, Harvard Business School Press, 2007 Access local specifications and learn user requirements Access local distribution requirements Explore similar capacities that could be of value Hold discussions with suppliers, consultants, target users, distributors, political leaders and local firms Hire people who are open, willing to learn and adapt Create cross-boarder teams in diverse locations Expand on cross-boarder interaction and assignments Explore valuable diversity 29
  • 30.
    Strategies for GlobalValue Creation Source: Redefining Global Strategy, Pankaj Ghemawat, Harvard Business School Press, 2007 TRANSFER EXPERTISE Offer new value ADAPTATION Make appropriate market & production adjustments WEALTH CREATION Confirm profit potential 30
  • 31.
    Strategies for GlobalValue Creation - Adaption Source: Redefining Global Strategy, Pankaj Ghemawat, Harvard Business School Press, 2007 ADAPTATION Make appropriate market & production adjustments 31
  • 32.
    Strategies for GlobalValue Creation - Adaption Source: Redefining Global Strategy, Pankaj Ghemawat, Harvard Business School Press, 2007 Design: reduce process costs Use production standardization, platforms and modules to reduce production costs Focus: reduce need for costly variation Target a specific region, segment, product line or value chain process Innovation: improve effectiveness Explore new applications and combinations for the foreign market Variation Modify the product and marketing promotional program. Externalization: reduce variation burden Outsource certain functions through strategic alliances, franchising, etc. 32
  • 33.
    Strategies for GlobalValue Creation – Transfer Expertise Source: Redefining Global Strategy, Pankaj Ghemawat, Harvard Business School Press, 2007 TRANSFER EXPERTISE Offer new value 33
  • 34.
    Transferring expertise –Regional strategies Source: Redefining Global Strategy, Pankaj Ghemawat, Harvard Business School Press, 2007 1. Regional or home focus: One processing location mainly service home market. Small amount of second market attention 2. Regional portfolio: Move to one off-shore foreign direct investment to supply that market 3. Regional hub: Create an off-shore production operation to serve the surrounding markets in that region 4. Regional platforms: Standardize components in each production operation to supply several regions 5. Regional mandates: Awarding certain regions assignments to specialize in specific global responsibilities and roles. 6. Regional networks: A broad configuration of coordinated processes to supply the whole cross- boarder network of markets 90% of global companies 34
  • 35.
    3. Regional hub R2R1 1.Regional focus R2R1 2. Regional portfolio R2R1 = One product line R = Region = minor effort = minor effort Home production, major and minor markets. Major and minor production, cross sharing products Major and minor production, major and minor markets Increasing complexity & managerial challenge with regional development issues, supervision issues and coordination issues Transferring expertise – Regional strategies review 35
  • 36.
    6. Regional networks R2R1 4.Platforms R2 5. Regional Mandates R2R1R1 Even more of a complex managerial challenge = One product line R = Region = minor effort = minor effort R4R3 Products and components for global markets Massive, coordinated and controls worldwide supply system. HQ request for production specialization for global markets Transferring expertise – Regional strategies review 36
  • 37.
    Strategies for GlobalValue Creation – Wealth creation Source: Redefining Global Strategy, Pankaj Ghemawat, Harvard Business School Press, 2007 WEALTH CREATION Confirm profit potential 37
  • 38.
    Wealth Creation –Questions to ask Source: Redefining Global Strategy, Pankaj Ghemawat, Harvard Business School Press, 2007 1. Volume: Can wealth be created by adding volume across-boarders? 2. Costs: Can costs be reduced by cross-boarder projects? 3. Differentiation: Can differentiation be created by cross- boarder activities which increase willingness to buy? 4. Bargaining Power: Will bargaining power be improved by crossing boarders? 5. Risks: Will risks be reduced by going across boarders? 6. Capacity: Will added skills, valuable experience and knowledge be gained which will increase capacity through foreign market activities? 38
  • 39.
    Combinations of globalvalue creation strategies Source: Redefining Global Strategy, Pankaj Ghemawat, Harvard Business School Press, 2007 Selling products across boarders Transfer expertise mainly as is Adapt mainly to local market Producing products across boarders Ideal point Ideal point Where should your company be on these lines? Where is the competition on these lines? What will be your competitive advantage? 39
  • 40.
    Getting started usinga refined global strategy analysis Source: Redefining Global Strategy, Pankaj Ghemawat, Harvard Business School Press, 2007 1. Performance Review: In what regions is the customer underserved for your product? Can they be profitably supplied? 2. Industry’s competitive environment: Who are the top players in the industry? What cross-boarder production is there? Are products standardized? Are prices moving up or down? What is the relationship between costing and volume? What is the main distribution method? How important is advertising/marketing, R&D, labor costs, capital investment in your industry? 3. CAGE: Do the CAGE analysis and determine market differences. 4. Global Value Creation: Using the ADAPTATION, TRANSFER EXPERTISE, WEALTH CREATION material, determine what value could be created. 5. ADDING: Do the ADDING analysis and determine your ideal strategy. 40
  • 41.
    41 A successful globalstrategy has many benefits: 1. It can help a company expand when its industry is declining. 2. It can help a company reduce its costs much more that it can in its home market only. 3. It can make a company far more competitive than its competitors. 4. It can give a company bargaining power it does not have in its domestic market only. 5. It can reduce a company’s overall risks. 6. It can provide great experiences which will develop its overall abilities.