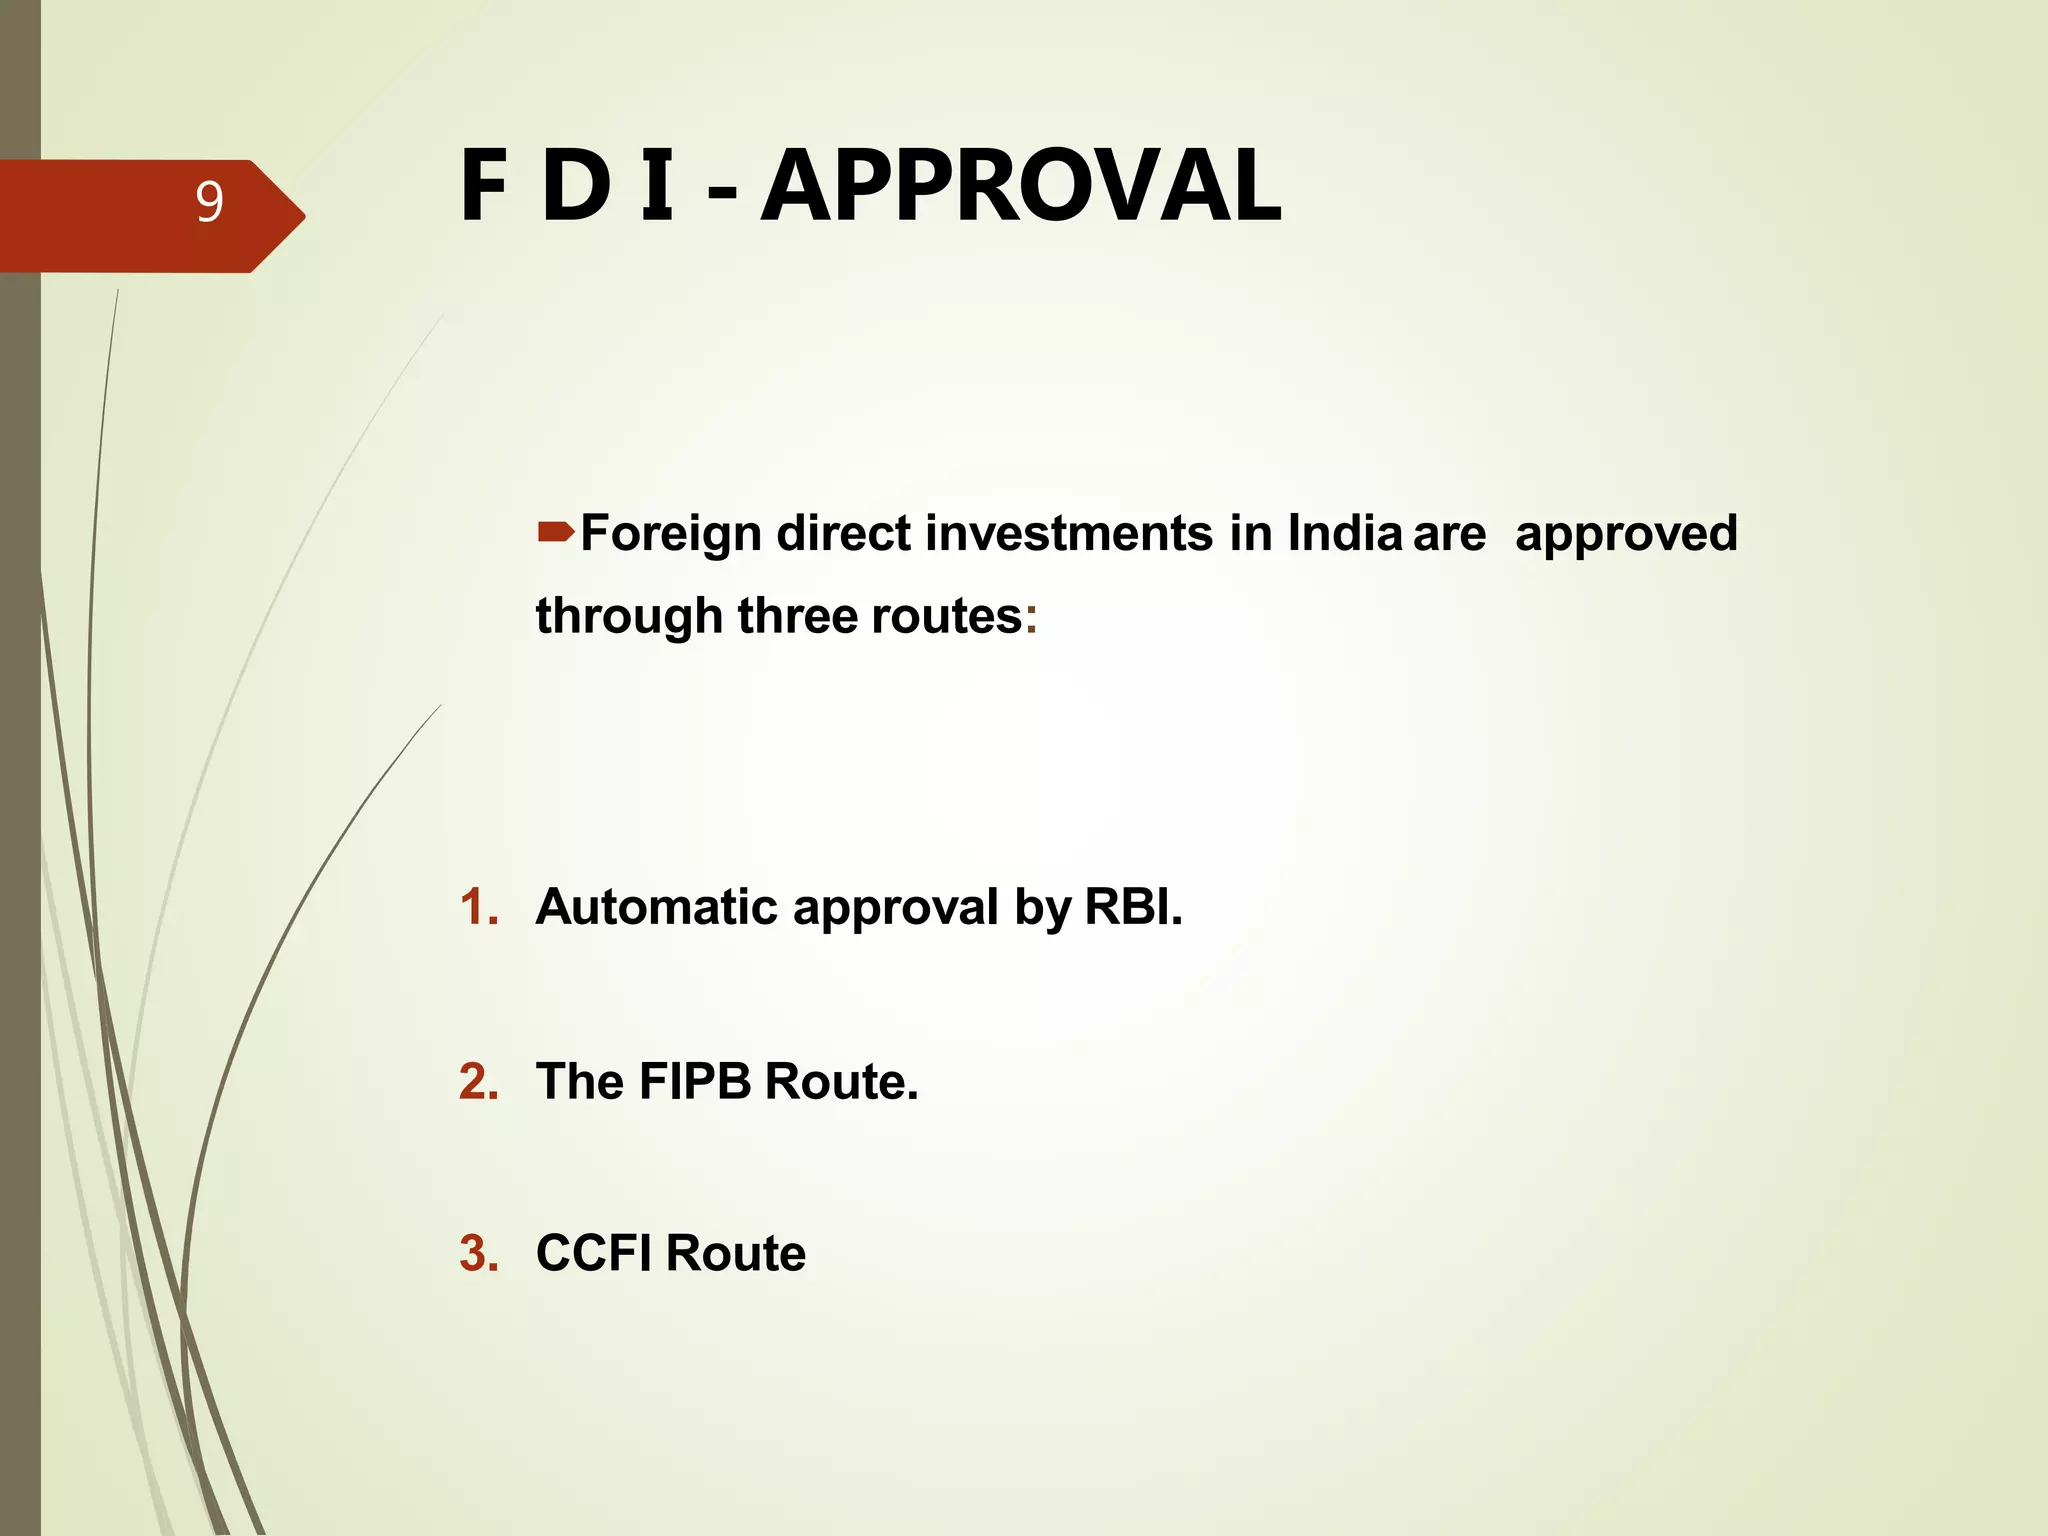
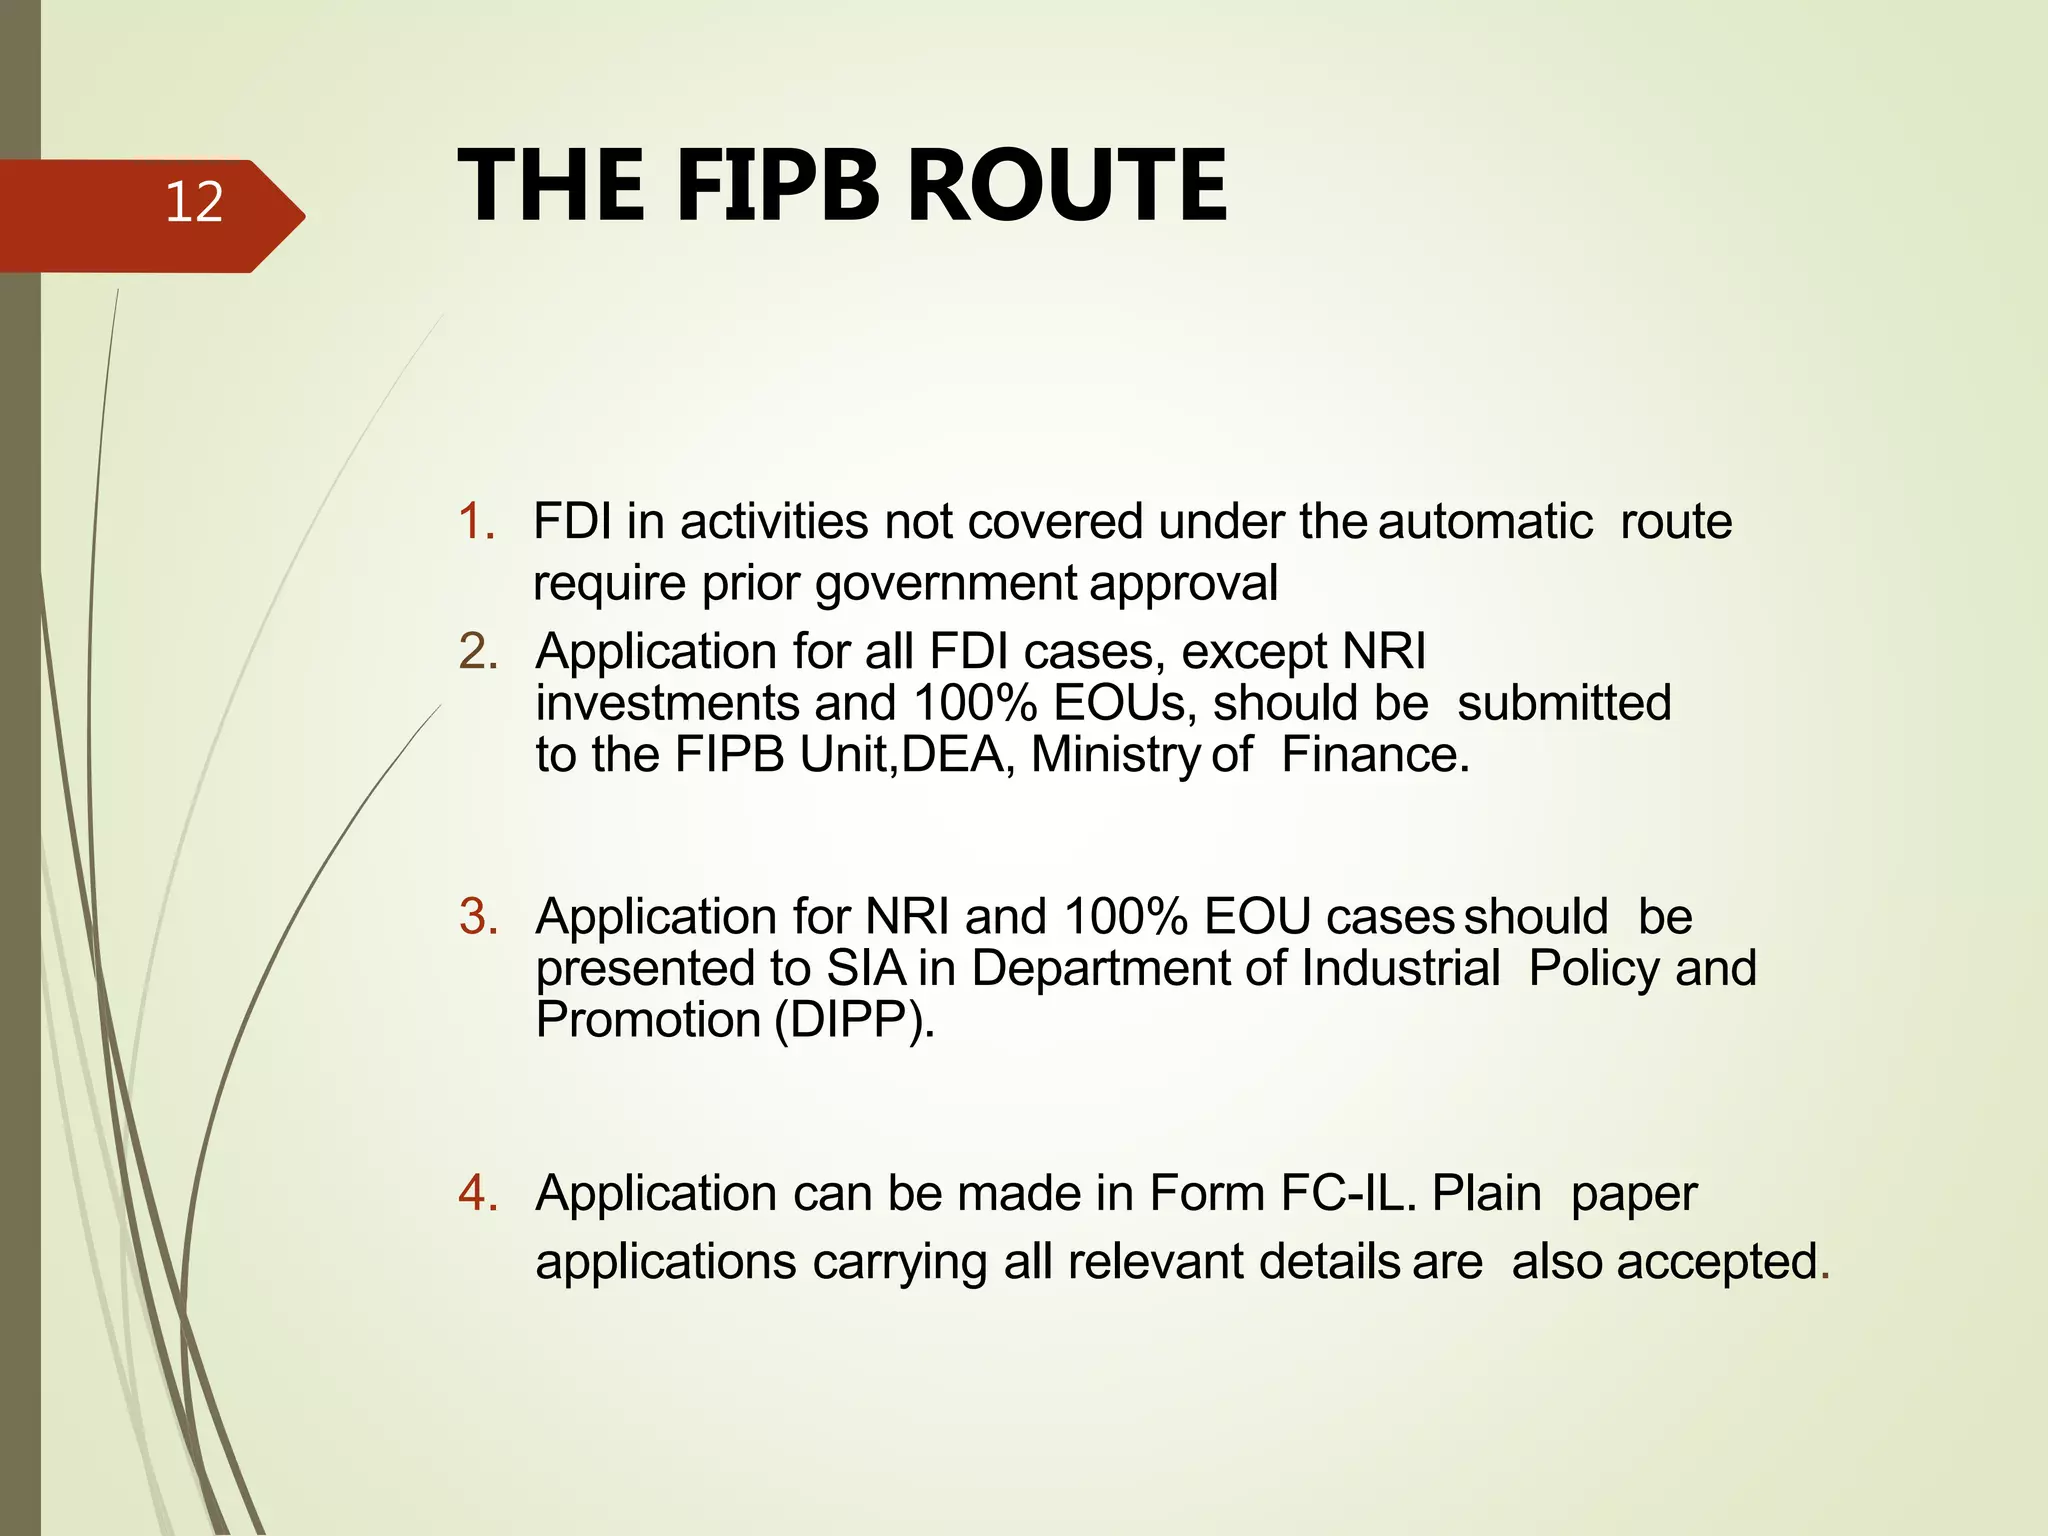
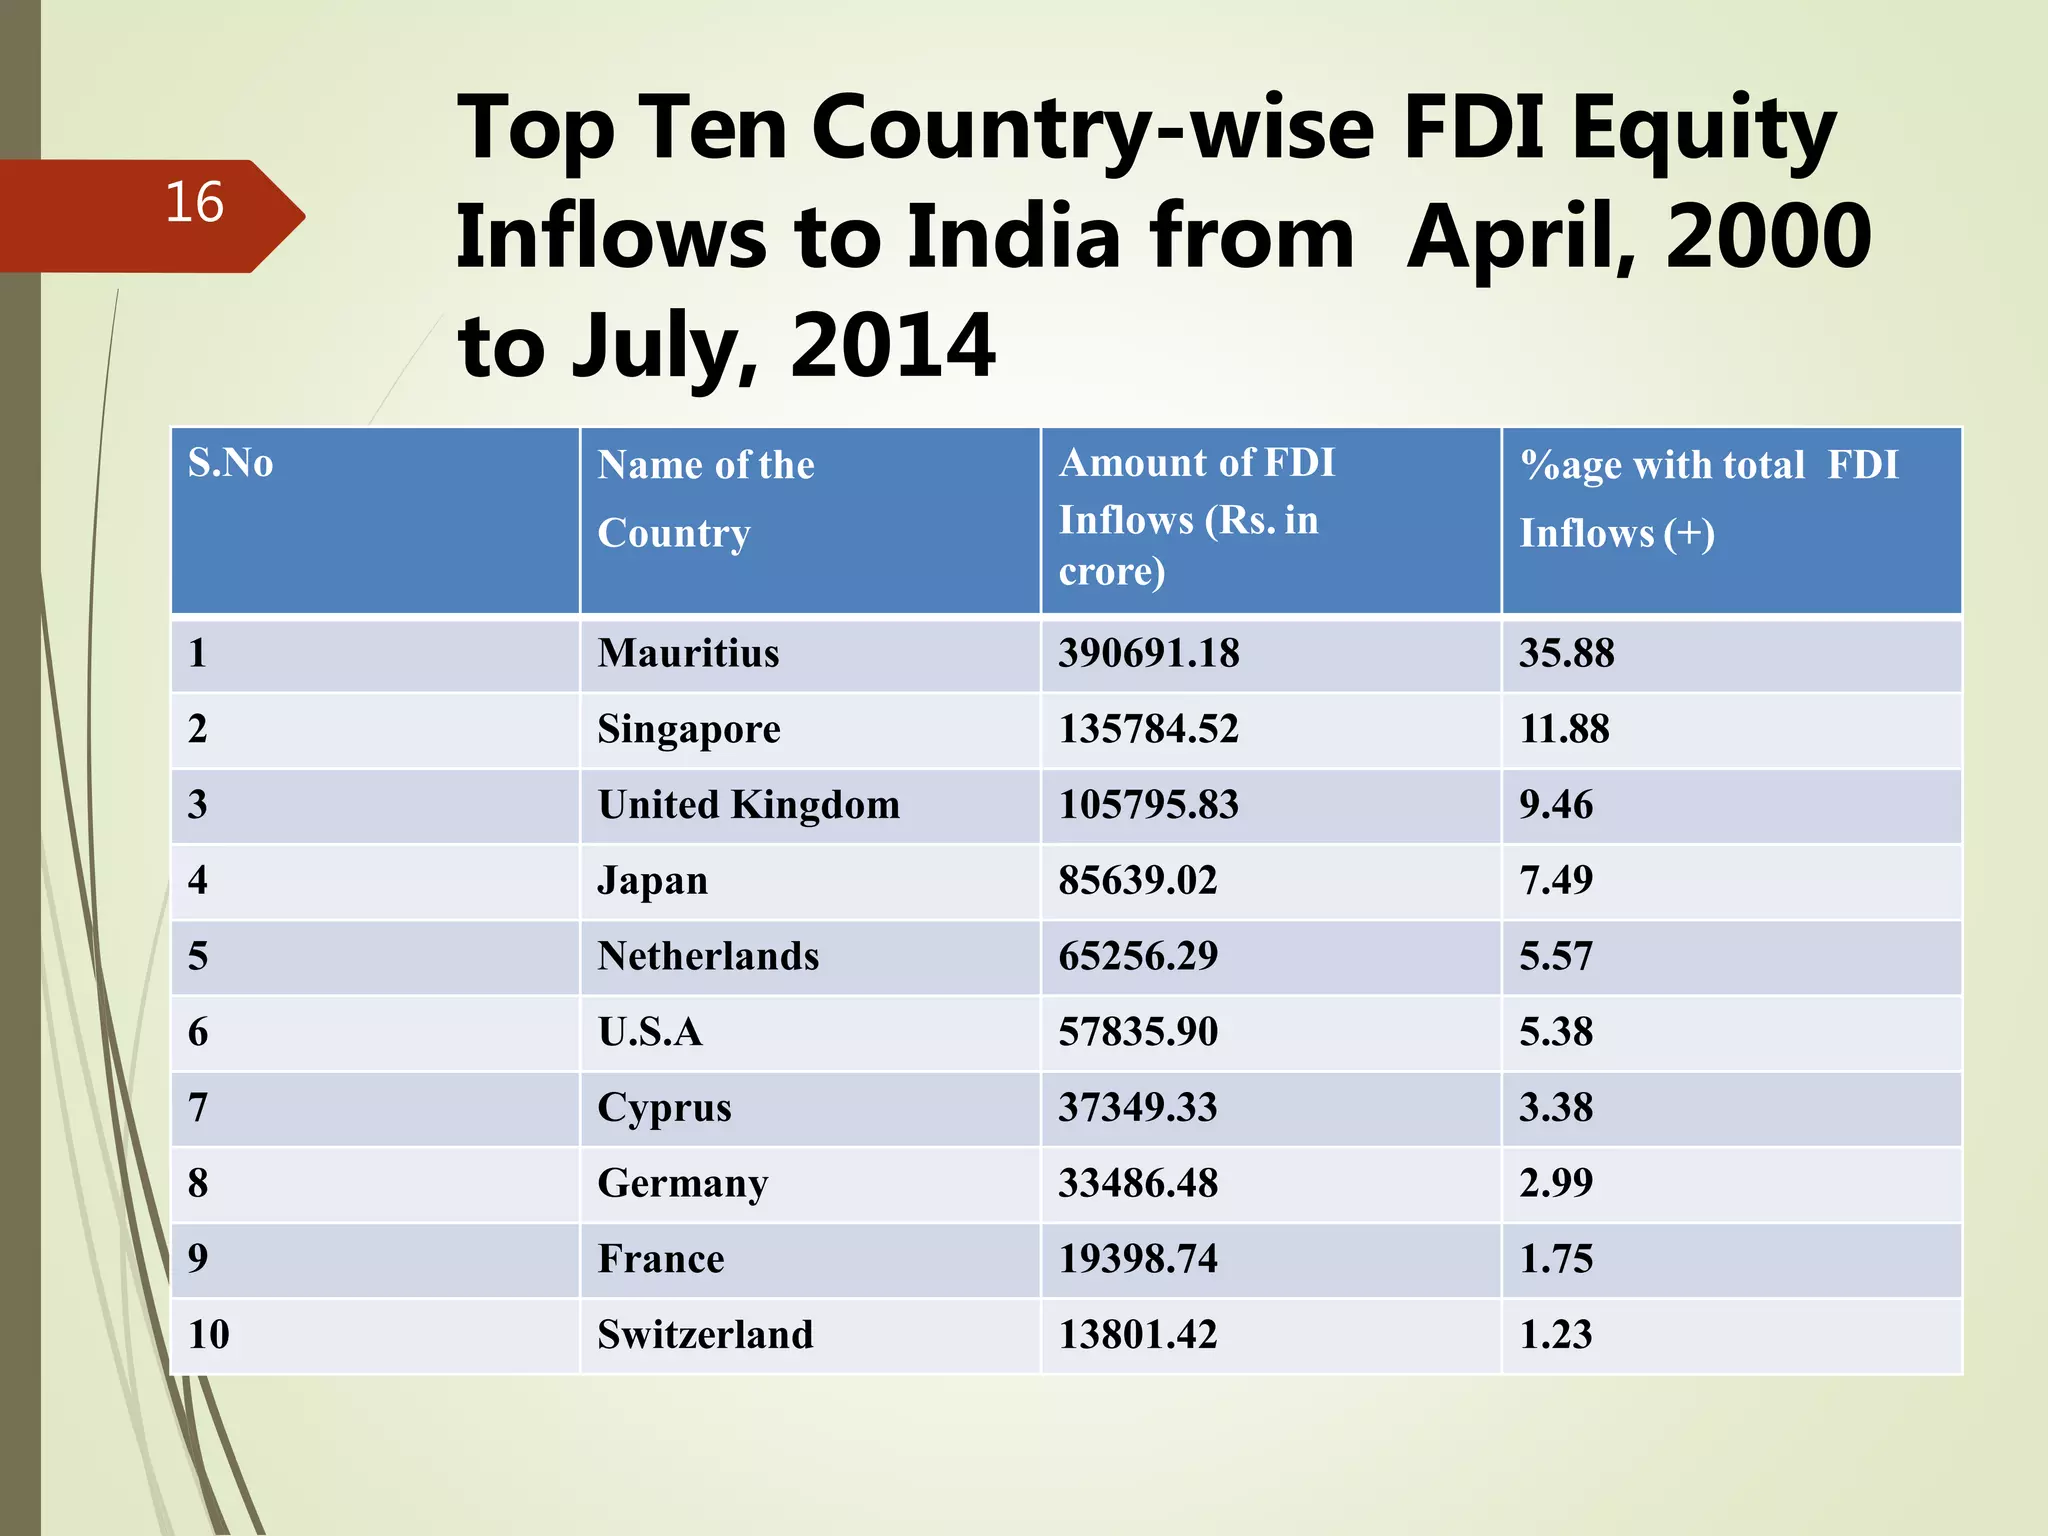
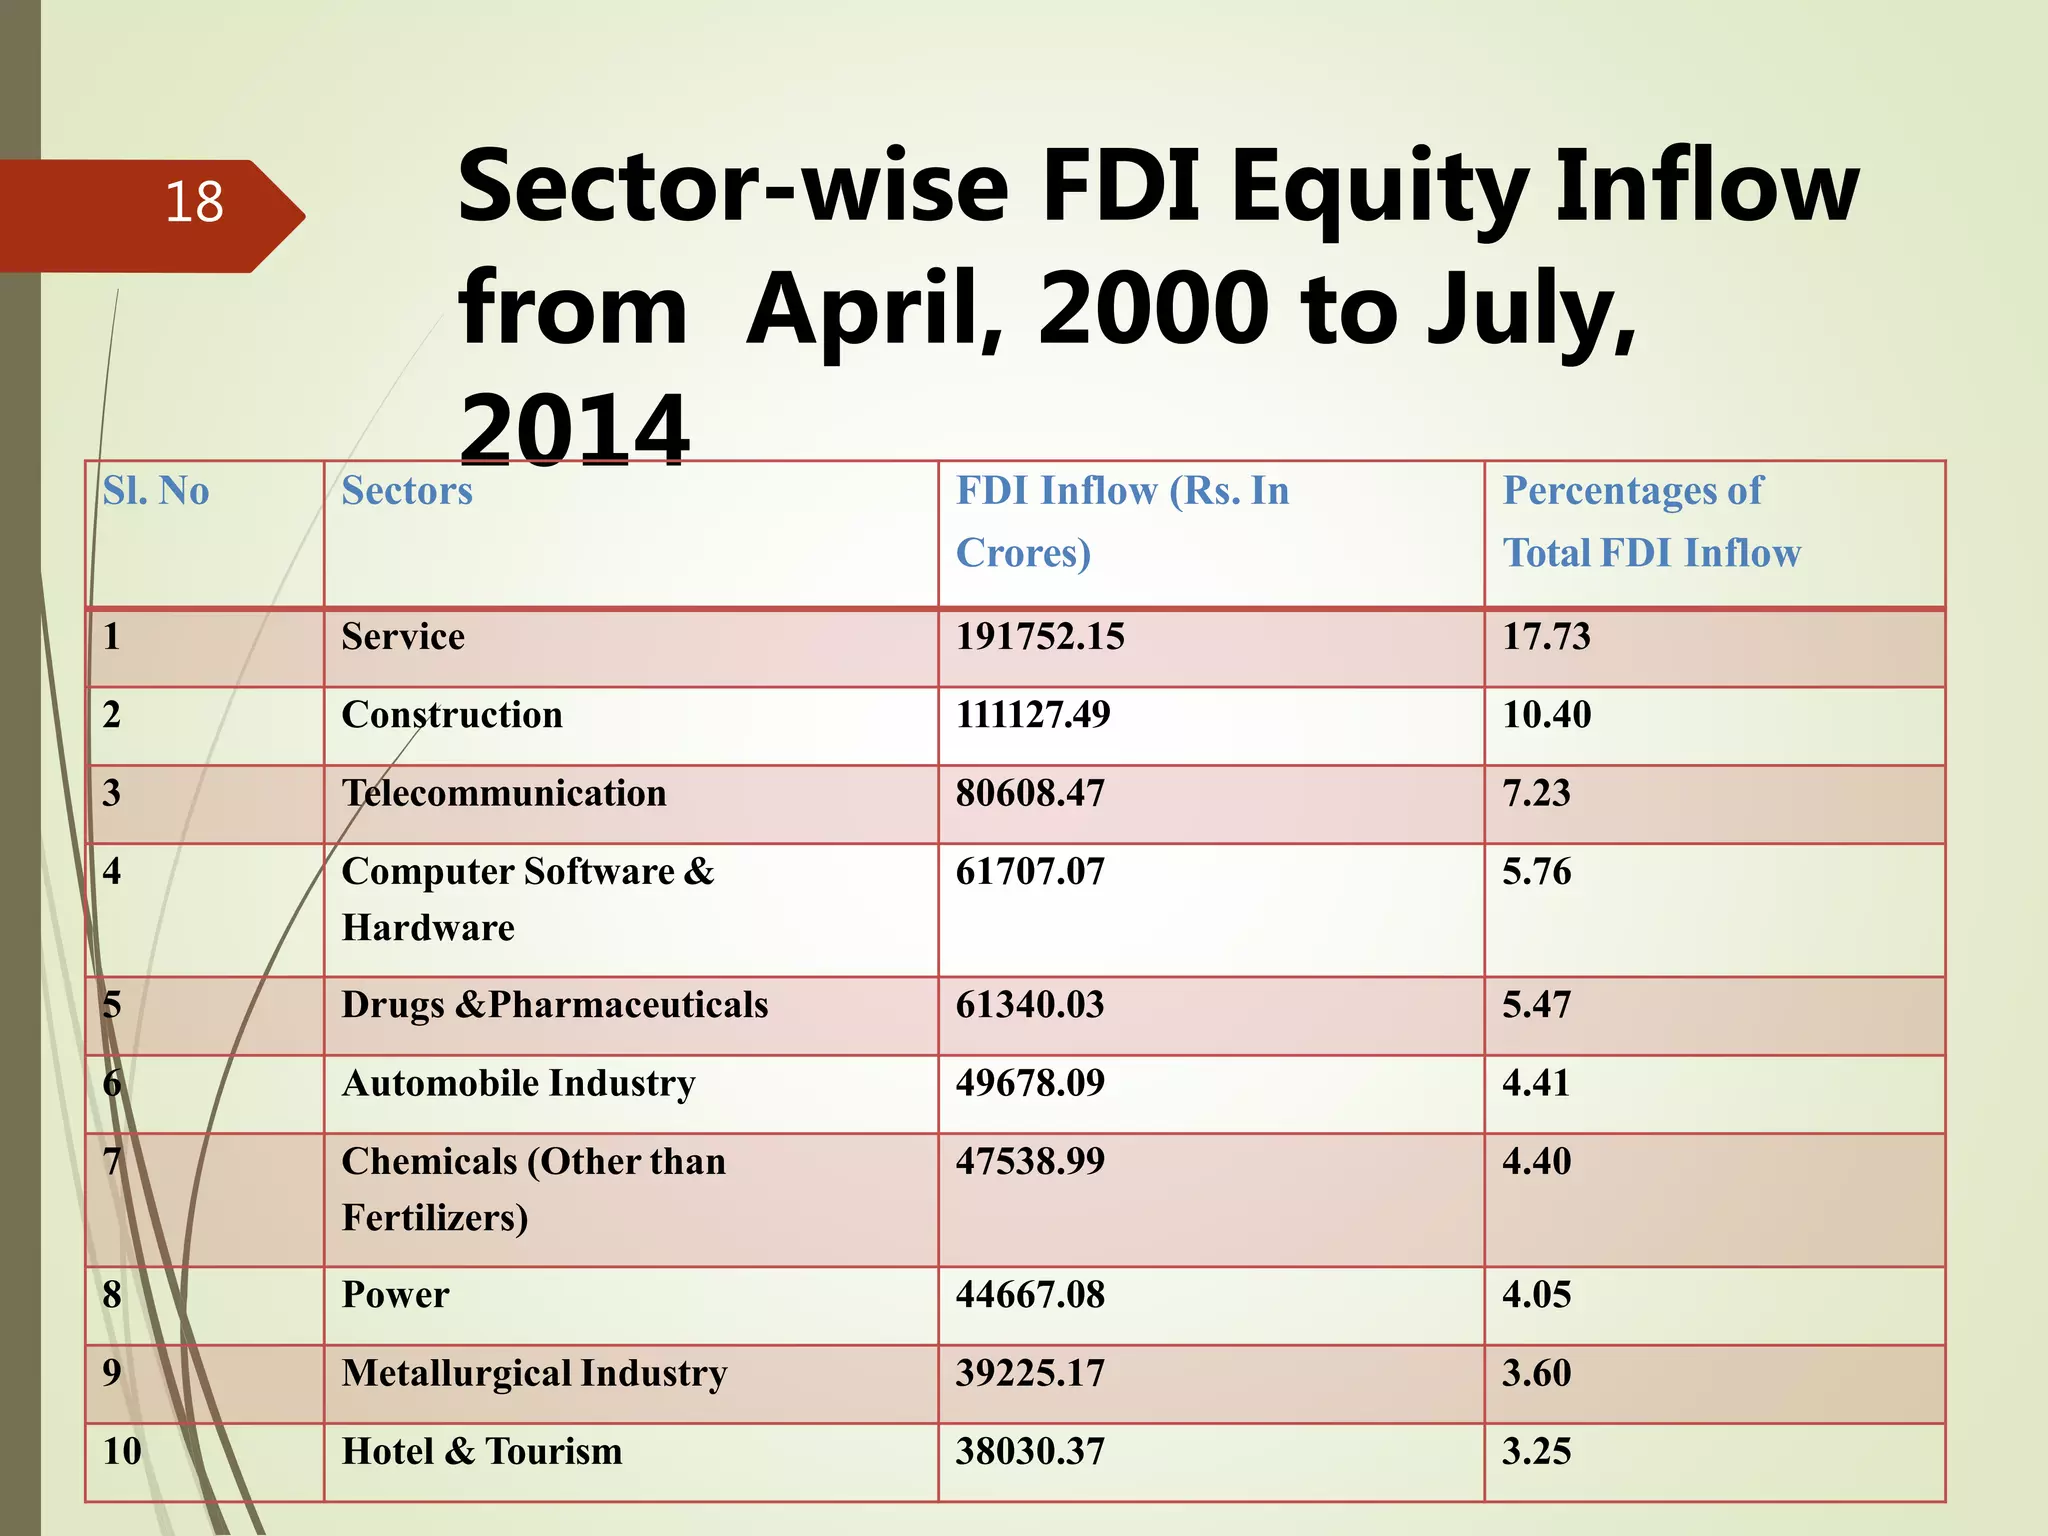
Foreign direct investment (FDI) refers to direct investment into production in another country. FDI is generally preferred over other forms of external financing as it is non-debt creating and returns depend on project performance. India permits FDI through various routes like automatic approval, government approval, or Cabinet Committee approval depending on the sector and investment amount. The top sectors to receive FDI in India are services, construction, and telecommunications. Mauritius, Singapore, and the United States are the top countries investing in India, with Mauritius being the largest source of FDI.
2. WHAT IS FDI
• . Foreign direct investment (FDI
• It is a direct investment into production or business in
a country by an individual or company in another
country.
• It can be either by buying a company in the target
country or by expanding operations of an existing
business in that country
2
3. Generally speaking FDI refers to capital inflows from
abroad that invest in the production capacity of the
economy and are
Usually preferred over other forms of external finance
because they are
Non-debt creating, non-volatile and their returns depend on
the performance of the projects financed by the investors.
FDI also facilitates international trade and transfer of
knowledge, skills and technology
3
4. Why FDI
1. Gain a foothold in a new geographicmarket.
2. Increase a firm’s global competitiveness and
positioning.
3. Fill gaps in a company’s product lines in aglobal industry.
4. Reduce costs in areas such as R&D, production, and
distribution
4
5. Foreign Direct Investment (FDI) is
permitted as under the following forms of
investments-
1. Through financial collaborations.
2. Through joint ventures and technical collaborations.
3. Through capital markets via Euro issues.
4. Through private placements or preferential allotments.
5
6. FACTORS REQUIRED TO
ATTRACT FDI
1. Low cost BUT Qualified, Educated/Skilled Labor Pool.
2. Long-term Market Potential OR Yields greater than can
be achieved Domestically.
3. Access to Natural Resources.
4. Geography
5. Stability of the economic and Political
Environment.
6
7. FORBIDDEN TERRITORIES
FDI is not permitted in the following industrial sectors:
1. Arms and ammunition.
2. Atomic Energy.
3. Railway Transport.
4. Coal and lignite
7
8. 5 Mining of iron, manganese, chrome, gypsum, sulphur,
gold, diamonds, copper, zinc.
6 Lottery Business
7 Agricultural or plantation activities
8 Housing and Real Estate Business (except development of
townships, construction of residen-tial/commercial premises,
roads or bridges to the extent specified in NotificationNo.
FEMA 136/2005-RB dated July 19, 2005).
8
9. F D I - APPROVAL
Foreign direct investments in India are approved
through three routes:
1. Automatic approval by RBI.
2. The FIPB Route.
3. CCFI Route
9
10. AUTOMATIC ROUTE
No need of Prior Approval From FIPB,RBI,GOI.
BUT
The investors are only required to notify the Regional Office
concerned of the Reserve Bank of
India within 30 days of receipt of inward remittances.
AND
File the required documents along with formFC- GPR
with that Office within 30 days of issue of shares to the
non-resident investors.
10
11. The Reserve Bank of India accords automatic approval
within a period of two weeks (provided certain parameters
are met) to all proposals involving:
1. foreign equity up to 50% in 3 categoriesrelating to mining
activities .
2. foreign equity up to 51% in 48specified
industries.
3. foreign equity up to 74% in 9 categories
11
12. THE FIPB ROUTE
1. FDI in activities not covered under the automatic route
require prior government approval
2. Application for all FDI cases, except NRI
investments and 100% EOUs, should be submitted
to the FIPB Unit,DEA, Ministry of Finance.
3. Application for NRI and 100% EOU casesshould be
presented to SIA in Department of Industrial Policy and
Promotion (DIPP).
4. Application can be made in Form FC-IL. Plain paper
applications carrying all relevant details are also accepted.
12
13. CCFI ROUTE
1. Investment proposals falling outside the automatic
route.
2. Having a project cost of Rs. 6,000 million or more would
require prior approval of Cabinet Committee of Foreign
Investment (“CCFI”).
3. Decision of CCFI usually conveyed in 8-10 weeks.
Thereafter, filings have to be madeby the Indian company
with the RBI
13
14. ADVANTAGES OF FDI
Employment and Economic Boost-
Increased Productivity-
Increment in Income-
Quality of products and flow of technology-
Increase in government revenue-
Increased Capital Investment.
New Technology and “Know How” Transfer.
14
15. Disadvantages of F.D.I
Bad deal for the small entrepreneurs-
Inflation-
Limited employment generation-
Cultural erosion-
Corruption
Technological Dependence on Foreign Technology
Sources
15
16. Top Ten Country-wise FDI Equity
Inflows to India from April, 2000
to July, 2014
16
S.No Name of the
Country
Amount of FDI
Inflows (Rs. in
crore)
%age with total FDI
Inflows (+)
1 Mauritius 390691.18 35.88
2 Singapore 135784.52 11.88
3 United Kingdom 105795.83 9.46
4 Japan 85639.02 7.49
5 Netherlands 65256.29 5.57
6 U.S.A 57835.90 5.38
7 Cyprus 37349.33 3.38
8 Germany 33486.48 2.99
9 France 19398.74 1.75
10 Switzerland 13801.42 1.23
17. 17
S.
No.
State-wise Inflows of FDI Cumulative
FDI ( 2000 to
2014)
%age to
total
Inflows
1 MAHARASHTRA, DADRA & NAGAR HAVELI, DAMAN &
DIU
328,166 30
2 DELHI, PART OF UP ANDHARYANA 216,274 19
3 TAMIL NADU, PONDICHERRY 71,017 6
4 KARNATAKA 63,294 6
5 GUJARAT 45,627 4
6 ANDHRA PRADESH 45,160 4
7 WEST BENGAL, SIKKIM, ANDAMAN & NICOBAR ISLANDS 13,584 1
8 CHANDIGARH, PUNJAB, HARYANA, HIMACHAL PRADESH 6,227 0.6
9 RAJASTHAN 6,623 0.5
10. MADHYA PRADESH, CHATTISGARH 6,095 0.5
11 KERALA, LAKSHADWEEP 4,893 0.4
12 GOA 3,710 0.4
13 UTTAR PRADESH, UTTRANCHAL 1,965 0.2
14 ORISSA 1,926 0.2
15 ASSAM, ARUNACHAL PRADESH,MANIPUR,
MEGHALAYA, MIZORAM, NAGALAND, TRIPURA
352 0
16 BIHAR, JHARKHAND 247 0
17 JAMMU & KASHMIR 26 0
18 REGIONS NOT INDICATED# 292,906 26.06
19 TOTAL 1,108,091 100
18. Sector-wise FDI Equity Inflow
from April, 2000 to July,
2014
18
Sl. No Sectors FDI Inflow (Rs. In
Crores)
Percentages of
Total FDI Inflow
1 Service 191752.15 17.73
2 Construction 111127.49 10.40
3 Telecommunication 80608.47 7.23
4 Computer Software &
Hardware
61707.07 5.76
5 Drugs &Pharmaceuticals 61340.03 5.47
6 Automobile Industry 49678.09 4.41
7 Chemicals (Other than
Fertilizers)
47538.99 4.40
8 Power 44667.08 4.05
9 Metallurgical Industry 39225.17 3.60
10 Hotel & Tourism 38030.37 3.25
20. CONCLUSION
• A large number of changes were introduced in the country after LPG
era after 1991.
• A structural breakthrough in the volume of the FDI inflows into the
economy maintained a fluctuating and unsteady trend during
reform period.
• More than 50 per cent of the total FDI inflows received in India
come from Mauritius, Singapore and the USA.
• The main reason for higher investment from Mauritius was that
the fact that India entered into a double taxation avoidance
agreement (DTAA) with Mauritius were protected from taxation in
India.
• The service sector had received the larger proportion followed by
computer software and hardware sector and then
telecommunication sector
20