There is a lot of talk about protecting America from foreign influence in the US lately whether it be Latin America, the Middle East or Asia. That will only weaken the US, as trade has created great prosperity for the US, whether in wealth creation, pollution reduction, food supply increase, job creation or war prevention. Global collaboration is the best way to create prosperity and a better standard of living for everyone. People will have to be willing to adjust to change though. Ask any respectable economist. I did some research on this a good two years ago, but it is still valid today. Review this presentation. Imagine the past and think about what can be achieved in the future. We just have to start connecting and collaborating more globally. When language barriers come down with advances in translation technology, we will reach heights that no one had ever dreamed of. I hope this presentation gets people thinking.
Call Girls Pune Just Call 9907093804 Top Class Call Girl Service Available
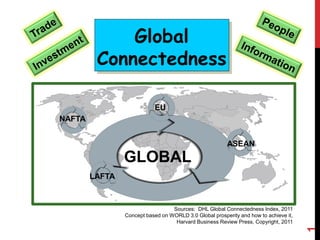
Global Collaborating Creates Prosperity
1. Global
Connectedness
Sources: DHL Global Connectedness Index, 2011
Concept based on WORLD 3.0 Global prosperity and how to achieve it,
Harvard Business Review Press, Copyright, 2011
1
NAFTA
LAFTA
EU
ASEAN
2. World is flat.
The world is one huge market.
Anything or anyone can go anywhere, anytime.
Do you think this is true?
Are there barriers to connectedness? 2
3. Global Connectedness – Goods & Service Trade
In comparison to total economic activity (GDP), what percent is global?
When asked about global interaction, the traditional data to compare a
country’s external merchandise/service trade with it’s total GDP.
So, lets start there.
Global Trade
3
Total GDP
4. Global Connectedness – Merchandise & Service Trade
With both merchandise and service international trade at only 30% of the
world GDP, there is still a great deal of growth potential. This 30% could
actually be closer to 20% if you consider re-exporting of semi-finished
products exported to another country for final processing and supplied to the
end user. We could be connected a great deal more.
1930
9%
of GDP
2011
30%
of GDP
Growth in trade
connectedness
Source: DHL Global Connectedness Index, 2012
4
5. Japan’s Global Connectedness – Merchandise & Service Trade
Japan’s external trade ratio is well below the average. It
is mainly due to it large domestic market. It has much
room for expansion.
Outward
15%
of GDP
Inward
16%
of GDP
Source: DHL Global Connectedness Index, 2016
From worldwide suppliers
To worldwide
markets
5
6. USA’s Global Connectedness – Merchandise & Service Trade
The United States’ external trade ratio is below the
average. It is mainly due to it large domestic market too.
It can expand much more.
Outward
8%
of GDP
Inward
13%
of GDP Source: DHL Global Connectedness Index, 2016
USA
From worldwide
suppliers
To worldwide
markets
6
7. China’s Global Connectedness – Merchandise & Service Trade
The China’s external trade ratio is closer to the average. This might
be one of the main reasons China has such high growth. It is helped
by valuable imports and it is financed by exports. In the future,
serving the domestic market will become more important as
wealth is created.
Outward
21%
of GDP
Inward
15%
of GDP
Source: DHL Global Connectedness Index, 2016
China
From worldwide
suppliers
To worldwide
markets
7
8. Global Connectedness – Foreign Direct Investment (FDI)
Source: DHL Global Connectedness Index, 2011
FDI
peeked in
2000
20%
of capital
formation
Foreign direct investment (FDI) to capital formation
(Total investment in fixed assets)
FDI settled in
2010
10%
of capital formation
FDI fell in
2007
15%
of capital
formation
There is great global economic benefits of FDI (financial transfer, technical
transfer, business knowhow transfer, etc.)
8
9. Global Connectedness – Financial Movement
Source: “Home Bias in International Equity Portfolios: A Review (August 2007)
Foreign equity investment (share purchase only)
Foreign equity investment
2005 ~ 2007
20%
of all investments
There is much room for foreigners investing in foreign companies. It
trust and better communication continues to grow so should investment.
9
10. Global Connectedness – Communication & Information
20%
of all internet connections are international.
5%
of all phone calls are international.
Source: DHL Global Connectedness Index, 2011
We could communicate and share information much more than we are
now. This would build trust, investment and greater prosperity.
10
11. 53/140
Bits per second per
internet user
International calls
International email
63/140
Outward per minutes/capita
112/140
Inward per minutes/capita
Source: DHL Global Connectedness Index, 2012
(World ranking among 140 countries (99% of world GDP and 95% of population)
Japan’s Global Ranking – Telephone/Internet Communication
Of 140
countries
Outward calls
Inward calls
11
Outward email data
Inward email data
12. Global Connectedness – Visiting foreign countries
1.9%
Of Japanese
population is
from another
country.
Source: UN report Trends in International Migrant Stock: The 2015 Revision.
14.3%
Of USA
population is
from another
country.
Connecting face-to-face
What percent of the world population are from foreign countries?
3% of the world population live outside of their home country.
What percent of the world population have studied in a foreign country?
2% of university student have studied outside their country.
What professionals are foreigners in the US?
33% of USA engineers are from foreign countries.
27% of USA mathematician, statisticians and computer science
specialists are from foreign countries.
24% of USA scientists and researches are from foreign countries. 12
13. United Arab Emirates 7,826,981 83.7
Singapore 2,323,252 42.9
Switzerland 2,438,702 28.9
Israel 2,046,873 26.5
New Zealand 1,132,736 25.1
Germany 12,005,690 14.9
United States 46,627,102 14.3
Sweden 1,639,771 14.3
United Kingdom 8,543,120 11.3
France 7,784,418 11.1
Greece 1,242,514 11.1
Italy 5,788,875 8.0
Russia 11,643,276 7.7
Turkey 4,580,678 5.81
Japan 2,437,169 1.9
India 5,338,486 0.4
Egypt 297,448 0.4
China 848,511 0.1
Indonesia 295,433 0.1
Vietnam 68,290 0.1
Global Connectedness – Visiting foreign countries
Connecting face-to-face
THE BENEFIT: advanced cultural diversity, learning,
teaching, blending, interaction and understanding
13
14. World 0.0
Business interaction & trade in one city
Source: Concept based on WORLD 3.0 Global prosperity and how to
achieve it, Harvard Business Review Press, Copyright, 2011
Imagine a city or village completely independent from the outside world. It grows
its own food, makes its own clothes, handles all medical problems, etc.
That was the world thousands of years ago.
14
15. Business interaction and trade from
village to area to whole state
The village starts to connect with other villages, trade with each other
and help each other when need be. They make agreements on how to
work together. Then, that connection and trade continues to grow.
15
16. Business interaction & trade within a state to the whole nation
The villages in the state continue to expand their connections.
Eventually, connections expand into a nation.
More opportunities,
better life, more
products/services
available
16
17. National business interaction & trade
World 1.0
We now enter the world of “World 1.0” in which a country tries to trade
as much as possible within its boundries, but tries to restrict outside
influence. It tries to protect the connections it has established.
17
USA
18. Regional business interaction & trade
As time passes, a country learns that it is influenced by its neighbors.
Therefore, more connection, interaction and trade expands again.
Additional
opportunities,
products and
services available
18
19. World 0.0
Business interaction & trade in one city
Source: Concept based on WORLD 3.0 Global prosperity and how
to achieve it, Harvard Business Review Press, Copyright, 2011
That was the total world thousands of years ago.
Imagine a city or village
completely independent from
the outside world. It grows its
own food, makes its own
clothes, handles all medical
problems, etc.
山形
19
20. World 1.0
Business interaction & trade in one city
The village starts to connect with other villages, trade with each other
and help each other when need be. They make agreements on how to
work together. Then, that connection and trade continues to grow.
20
21. National business interaction & trade
World 1.0
We now enter the world of “World 1.0” in which a country tries to trade
as much as possible within its boundries, but tries to restrict outside
influence. It tries to protect the connections it has established.
Stop!
21
22. TPP business interaction & trade
(TPP-Trans-Pacific Partnership free trade)
There are 11 countries in talks now. Japan and Thailand are
considering attending. These talks could help expand global
interaction and trade within the Pacific region. It is highly
recommended that Japan attends the talks. Through the talks, the
value of global trade and the potential concerns could be evaluated.
USA
Canada
Mexico
Peru
Chile
Vietnam
Malaysia
Singapore
Brunei
Australia
New Zealand
Thailand
Japan
TPP
Trans-Pacific
Partnership
Much more opportunities,
improved life, even more
products/services
available
22
23. Global business interaction & trade
World 2.0
With the internet and inexpensive global communications some believe
we are in “World 2.0” in which there is only one market, the global
market. They believe all markets are equal and should have free access.
23
24. What is World 3.0?
World 3.0
It is not World 0.0, World 1.0 or World 2.0. It is World 3.0.
Source: World 3.0 GLOBAL PROSPERITY AND HOW TO ACHIEVE IT
24
25. World 3.0 – Looking at connection differently
World 3.0
Source: World 3.0 GLOBAL PROSPERITY AND HOW TO ACHIEVE IT
What only affects a local region?
What affects the globe?
What are the differences?
What is the distance?
In World 3.0 both distance and differences still matter greatly.
Those differences must be explored in each case to determine
the ideal level of connectedness. Some issues should be kept at
the local level, other issues at the global level.
MuchLittle
25
26. CAGE - Differences
Source: World 3.0 GLOBAL PROSPERITY AND HOW TO ACHIEVE IT
G-Geographic – How great are the geographic differences?
E-Economic – How great are the economic differences?
A-Administrative – How great are the administrative differences?
C-Culture – How great are the cultural differences?
MuchLittle
26
27. C- Cultural Differences
Source: World 3.0 GLOBAL PROSPERITY AND HOW TO ACHIEVE IT
Social/ethnic networks – How great are social networks?
Language – How great are language/communication
differences?
Religion – How great are religious differences?
Values – How different are norms, values and work ethics?
MuchLittle
27
28. A- Administrative Differences
Source: World 3.0 GLOBAL PROSPERITY AND HOW TO ACHIEVE IT
Trade Bloc – Are the countries in a shared regional trading bloc?
Colonial Ties – Do the countries have a colonial history?
Currency/measurements – Is there a common
currency/measurements?
Political – Are there good/poor political relations?
Legal System – Are the laws/regulations similar?
MuchLittle
28
29. G- Geographic Distance
Source: World 3.0 GLOBAL PROSPERITY AND HOW TO ACHIEVE IT
Common Border – Is there a common border between the countries?
Physical Distance – Are the countries/cities close to each other?
Climate – Are there similar climates between the countries?
Remoteness – Is the country far away from other countries?
Port – Is the country landlocked or is there an available port?
MuchLittle
29
30. E- Economic Distance
Source: World 3.0 GLOBAL PROSPERITY AND HOW TO ACHIEVE IT
Natural resources – Are there concerns over in raw materials?
Income – Is there a great consumer income difference?
Financial – Are there major financial differences?
Organizational – Are quality local companies available?
Supply chain – Are there developed supply chains in each country?
MuchLittle
Human resources – Is there a difference in knowhow, skills?
30
31. Example: New Zealand’s Bilateral Global Connectedness
Source: Global Connectedness and Bilateral Economic Linkages
Which Countries? NEW ZEALAND TREASURY, Working Paper, June, 2004
These factors and ranking are to determine New Zealand’s bilateral
trade barrier liberalization and promotion campaigns by close
economic partners (CEP) which will produce the greatest economic and
technical development.
Factors New Zealand uses for
promoting country connectedness
31
Highest inward/outward FDI by country
Highest inward/outward R & D by country
Highest inward/outward goods traded by country
Highest inward/outward tourism by country
Highest inward/outward education exports by country
Highest inward/outward immigration/emigration by country
32. New Zealand’s Conclusion
Countries to deepen R & D contact
Source: Global Connectedness and Bilateral Economic Linkages
Which Countries? NEW ZEALAND TREASURY, Working Paper, June, 2004
Example: New Zealand’s Bilateral Global Connectedness
Global R & D technological leaders
Countries geographically close
Countries that have extensive trade with now
Countries have extensive FDI with now
Countries have co-investment potential
Countries receptive to collaboration
Countries with common language
Countries with shared technological specialty
Targets: #1-USA, Japan, UK, Germany & Australia,
Future targets: Korea, Taiwan and China
32
33. New Zealand’s Conclusion
Countries to deepen FDI with
Source: Global Connectedness and Bilateral Economic Linkages
Which Countries? NEW ZEALAND TREASURY, Working Paper, June, 2004
Example: New Zealand’s Bilateral Global Connectedness
Have high FDI now
Have technology that could be learned
Have technology that could be applied
Have knowhow that would stimulate local
companies
Could develop knowhow that is needed
Have technology that could develop local
natural resources
Have technology that is not available now
Countries with MNC with management expertise
33
34. New Zealand’s Conclusion
Non-economic promotion to select countries
Source: Global Connectedness and Bilateral Economic Linkages
Which Countries? NEW ZEALAND TREASURY, Working Paper, June, 2004
Example: New Zealand’s Bilateral Global Connectedness
Tourism programs
Educational programs
Expatriate associations
Overseas market information sharing
34
35. New Zealand’s Conclusion
Immigration-Concerns
Source: Global Connectedness and Bilateral Economic Linkages
Which Countries? NEW ZEALAND TREASURY, Working Paper, June, 2004
Example: New Zealand’s Bilateral Global Connectedness
Most ideas are replicated or modified from previous employment.
Can those ideas be imported through immigration?
Ideas are spread through the mobility of key engineers. Could they
be looked for?
Could more direct contacts with foreign engineers and other
researchers in conferences be encouraged/promoted?
Could import-competing companies be acquired for technology,
R&D collaboration, patents and licenses?
Could consultation with experts, communications with suppliers,
mergers and joint ventures/alliances be promoted?
Could R&D out-sourcing and personnel exchanges be promoted to
bring wealth to New Zealand?
Could researcher at universities be encouraged?
35
36. New Zealand’s Conclusion
Immigration-Concerns
Source: Global Connectedness and Bilateral Economic Linkages
Which Countries? NEW ZEALAND TREASURY, Working Paper, June, 2004
Example: New Zealand’s Bilateral Global Connectedness
As Pacific-Rim countries are targeted for FDI,
trade, services and R&D, those countries also
should be targeted for greater people exchange.
The UK also should be targeted so as to lever
off existing strong relationships in all
dimensions. For the future immigration from
India and Pakistan could be promoted with its
growing and well-educated middle class and its
fluency in English.
36
37. New Zealand’s Conclusion
Immigration - Emigration
Example: New Zealand’s Bilateral Global Connectedness
New Zealander living
outside the country
12%
of total population
Foreign population
in New Zealand
22%
of total population
Source: DHL Global Connectedness Index, 2011
(World ranking among 125 countries (98% of world GDP and 92% of population)
37
38. Source: Global Connectedness and Bilateral Economic Linkages
Which Countries? NEW ZEALAND TREASURY, Working Paper, June, 2004
Example: New Zealand’s Bilateral Global Connectedness
New Zealand’s Overall Conclusion
38
39. New Zealand’s Conclusion
Countries to deepen Trade
Source: Global Connectedness and Bilateral Economic Linkages
Which Countries? NEW ZEALAND TREASURY, Working Paper, June, 2004
Example: New Zealand’s Bilateral Global Connectedness
Pacific Rim
South Korea
ASEAN countries
Mexico
China
Chile
39
40. What global connectedness offers (ADDING)
Source: World 3.0 GLOBAL PROSPERITY AND HOW TO ACHIEVE IT
A – Adding production volume/economies of scale
D – Decreasing costs/economies of scale
D – Differentiating, offering different products
and solutions
I – Intensifies competition, forces companies to improve
N - Normalize risks. Success in one market
balances failures in others
G – Generates, spreads and diffuses knowledge
40
41. Global connectedness and pollution
Pollution
Source: World 3.0 GLOBAL PROSPERITY AND HOW TO ACHIEVE IT
Most ecological problems reside within countries and not between countries. That is not to say
pollution issues should be ignored globally. Some issues like global warming must be addressed
at the global level. River pollution could be handled within a countries or possibly between two
bordering countries. Global expansion could both caused and reduced pollution. Environmental
influence must be considered in any global activity.
41
42. Global connectedness and foreign funding
Financial
Source: World 3.0 GLOBAL PROSPERITY AND HOW TO ACHIEVE IT
Foreign direct investment (FDI) has shown to be very good for the global economy.
Investment in equities by foreign investors has also shown to be good for the global economy.
Foreign debt has been more problematic when it comes to overall global financial health.
42
43. Global connectedness and food supply/price risks
World food
Source: World 3.0 GLOBAL PROSPERITY AND HOW TO ACHIEVE IT
Globalization has not caused unstable food prices. Only 18% of wheat, 7% of rice and 10% of
all coarse grains (including corn) were traded across boarders in 2008 (The total production of
these three items is 60% of world caloric intake). Food exports to overall merchandise trade is
around 8.5% ~ 12.2%. This has helped stabilized supply and prices.
43
44. Global connectedness and unemployment
Source:
World 3.0 GLOBAL PROSPERITY AND HOW TO ACHIEVE IT
Globalization has not caused total unemployment. Labor is not a simple
commodity. People have different skills, experiences, preferences, capabilities and
learning potential. The cause of unemployment is very complicated. It is
influenced by shifts from production to services, changing union strengths, labor-
saving technology and tax changes. Most economists think technology is the
greatest cause of unemployment. Global trade has far less influence. It is not
written in news papers, but strong labor protection has curtailed job losses, but
stifled job creation.
Jobs
44
45. Global connectedness and military conflict
Globalization offers diversification and choices. These choices promote
understanding and respect across borders. Even when trade conflict occurs, it is
far better than military conflict. Quite often the lack of mutual trading is the
reasons why wars start. It is particularly true when countries hold monopolies on
valuable raw materials.
There is a direct link between trade (and its occasional conflict) and war.
War Region
45
46. Healthy competition
Where there is learning,
product development,
personnel development,
long-term strategy
development and
low stress working
environments
Fierce fighting
Where there is
discounting,
damaging
competitor moves,
high stress, and
an overall
unattractive
image
No
competition
Where there is
complacence,
no stress,
and no
development
activities
Global connectedness & extremes of competition
Globalization and openness will create competition. It must be done so there is neither
complacency or fierce fighting. Fierce fighting could be the result of the differences
mentioned earlier.
46
47. Global Connectedness Resistance
Source: Concept based on WORLD 3.0 Global prosperity and how
to achieve it, Harvard Business Review Press, Copyright, 2011
A great deal of the wealthiest
people in developing countries
are people who inherited their
wealth. They tend to be
protectionists along with
anyone in a non-competitive,
declining industry.
A great deal of the
wealthiest people in
industrialized countries
are self-made millionaires
(entrepreneurs) who
welcome competition.
Inherited wealth
protectionist
Interacting
entrepreneur
47
48. Global Connectedness
stimulates local growth
Connecting
factors
Merchandise/service
trade (35%)
Cross-boarder capital
movement (35%)
Cross-boarder
information flow (15%)
People cross-boarder
movement (15%)
Source of percentages: DHL Global Connectedness Index, 2012 48
Higher
GDP in
each
country
and
globally
Increased
local
prosperity
More local
choices.
lower costs
higher
quality
available
Stage #1:
Many have
doubts
Stage #2:
Achievement
surprise
Stage #3:
Feel life
improvement
49. Thank You
Global
Connectedness
The more we connect, the better we communicate.
The more we communicate, the greater we trust.
The greater we trust, the more we invest.
The more we invest, the greater the opportunities
for entrepreneurs.
The greater the number of entrepreneurs,
the great the chance all will prosper.
49