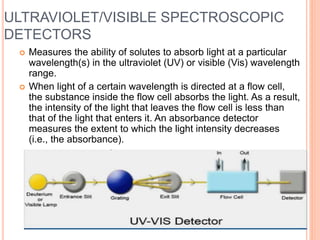
Detectors are used in HPLC to sense individual components as they leave the chromatography column. There are two main types of detectors: selective detectors that respond to a particular property of the solute and universal detectors that measure differences in bulk properties between the solute and mobile phase. Common detectors include UV-Vis absorbance, fluorescence, refractive index, electrochemical, and mass spectrometry detectors. An ideal detector has properties such as good stability, linear response, and high sensitivity.
Detectors are the brain of any chromatograhic system. It help us to record the chromatogram based on certain characteristics of the analyte and help us in identifying that compound both qualitatively and quantitatively.
A detector is a device used in high performance liquid chromatography (HPLC) to detect components of the mixture being eluted off the chromatography column.
• The detector senses the presence of the individual components as they leave (elute) the column.
• The detectors converts a change in effluents into an electric signal that is recorded by data system
The detailed information of UV Visible Spectroscopy, it includes the information regarding electronic transitions, Electromagnetic radiations, Various shifts.
UV - Visible Spectroscopy detailed information is included .The Spectroscopy study provide the information and the absorbance as well the concentration of the drugs is studied.
Fourier Transform Infrared Spectroscopy-:A type of infrared spectroscopy.It is method of obtaining an infrared spectrum by measuring interferogram and then performimg a Fourier Transform upon the interferogram to obtain the spectrum.
details about uv-visible spectroscopy. intoduction to uv-visible spectroscopy with principle,
instrumentation, application, beers lamberts law , detectors. helps to know details about uv-visible spectroscopy. complete notes of uv-visible spectroscopy.
Infrared spectroscopy (IR spectroscopy) is the spectroscopy that deals with the infrared
region of the electromagnetic spectrum, that is light with a longer wavelength and
lower frequency than visible light.
Infrared Spectroscopy is the analysis of infrared light interacting with a molecule.
A spectrophotometer is an instrument containing a monochromator, a device which produces a light beam containing wavelengths in a narrow band around a selected wavelength, and a means of measuring the ratio of that beam's intensity as it enters and leaves a cuvette 99 This describes a single-beam photometer.
Unlike a spectrometer (which is any instrument that can measure the
properties of light over a range of wavelengths), a spectrophotometer
measures only the intensity of light as a function of its wavelength.
Seminar of U.V. Spectroscopy by SAMIR PANDASAMIR PANDA
Spectroscopy is a branch of science dealing the study of interaction of electromagnetic radiation with matter.
Ultraviolet-visible spectroscopy refers to absorption spectroscopy or reflect spectroscopy in the UV-VIS spectral region.
Ultraviolet-visible spectroscopy is an analytical method that can measure the amount of light received by the analyte.
(May 29th, 2024) Advancements in Intravital Microscopy- Insights for Preclini...Scintica Instrumentation
Intravital microscopy (IVM) is a powerful tool utilized to study cellular behavior over time and space in vivo. Much of our understanding of cell biology has been accomplished using various in vitro and ex vivo methods; however, these studies do not necessarily reflect the natural dynamics of biological processes. Unlike traditional cell culture or fixed tissue imaging, IVM allows for the ultra-fast high-resolution imaging of cellular processes over time and space and were studied in its natural environment. Real-time visualization of biological processes in the context of an intact organism helps maintain physiological relevance and provide insights into the progression of disease, response to treatments or developmental processes.
In this webinar we give an overview of advanced applications of the IVM system in preclinical research. IVIM technology is a provider of all-in-one intravital microscopy systems and solutions optimized for in vivo imaging of live animal models at sub-micron resolution. The system’s unique features and user-friendly software enables researchers to probe fast dynamic biological processes such as immune cell tracking, cell-cell interaction as well as vascularization and tumor metastasis with exceptional detail. This webinar will also give an overview of IVM being utilized in drug development, offering a view into the intricate interaction between drugs/nanoparticles and tissues in vivo and allows for the evaluation of therapeutic intervention in a variety of tissues and organs. This interdisciplinary collaboration continues to drive the advancements of novel therapeutic strategies.
Richard's aventures in two entangled wonderlandsRichard Gill
Since the loophole-free Bell experiments of 2020 and the Nobel prizes in physics of 2022, critics of Bell's work have retreated to the fortress of super-determinism. Now, super-determinism is a derogatory word - it just means "determinism". Palmer, Hance and Hossenfelder argue that quantum mechanics and determinism are not incompatible, using a sophisticated mathematical construction based on a subtle thinning of allowed states and measurements in quantum mechanics, such that what is left appears to make Bell's argument fail, without altering the empirical predictions of quantum mechanics. I think however that it is a smoke screen, and the slogan "lost in math" comes to my mind. I will discuss some other recent disproofs of Bell's theorem using the language of causality based on causal graphs. Causal thinking is also central to law and justice. I will mention surprising connections to my work on serial killer nurse cases, in particular the Dutch case of Lucia de Berk and the current UK case of Lucy Letby.
A brief information about the SCOP protein database used in bioinformatics.
The Structural Classification of Proteins (SCOP) database is a comprehensive and authoritative resource for the structural and evolutionary relationships of proteins. It provides a detailed and curated classification of protein structures, grouping them into families, superfamilies, and folds based on their structural and sequence similarities.
Earliest Galaxies in the JADES Origins Field: Luminosity Function and Cosmic ...Sérgio Sacani
We characterize the earliest galaxy population in the JADES Origins Field (JOF), the deepest
imaging field observed with JWST. We make use of the ancillary Hubble optical images (5 filters
spanning 0.4−0.9µm) and novel JWST images with 14 filters spanning 0.8−5µm, including 7 mediumband filters, and reaching total exposure times of up to 46 hours per filter. We combine all our data
at > 2.3µm to construct an ultradeep image, reaching as deep as ≈ 31.4 AB mag in the stack and
30.3-31.0 AB mag (5σ, r = 0.1” circular aperture) in individual filters. We measure photometric
redshifts and use robust selection criteria to identify a sample of eight galaxy candidates at redshifts
z = 11.5 − 15. These objects show compact half-light radii of R1/2 ∼ 50 − 200pc, stellar masses of
M⋆ ∼ 107−108M⊙, and star-formation rates of SFR ∼ 0.1−1 M⊙ yr−1
. Our search finds no candidates
at 15 < z < 20, placing upper limits at these redshifts. We develop a forward modeling approach to
infer the properties of the evolving luminosity function without binning in redshift or luminosity that
marginalizes over the photometric redshift uncertainty of our candidate galaxies and incorporates the
impact of non-detections. We find a z = 12 luminosity function in good agreement with prior results,
and that the luminosity function normalization and UV luminosity density decline by a factor of ∼ 2.5
from z = 12 to z = 14. We discuss the possible implications of our results in the context of theoretical
models for evolution of the dark matter halo mass function.
Slide 1: Title Slide
Extrachromosomal Inheritance
Slide 2: Introduction to Extrachromosomal Inheritance
Definition: Extrachromosomal inheritance refers to the transmission of genetic material that is not found within the nucleus.
Key Components: Involves genes located in mitochondria, chloroplasts, and plasmids.
Slide 3: Mitochondrial Inheritance
Mitochondria: Organelles responsible for energy production.
Mitochondrial DNA (mtDNA): Circular DNA molecule found in mitochondria.
Inheritance Pattern: Maternally inherited, meaning it is passed from mothers to all their offspring.
Diseases: Examples include Leber’s hereditary optic neuropathy (LHON) and mitochondrial myopathy.
Slide 4: Chloroplast Inheritance
Chloroplasts: Organelles responsible for photosynthesis in plants.
Chloroplast DNA (cpDNA): Circular DNA molecule found in chloroplasts.
Inheritance Pattern: Often maternally inherited in most plants, but can vary in some species.
Examples: Variegation in plants, where leaf color patterns are determined by chloroplast DNA.
Slide 5: Plasmid Inheritance
Plasmids: Small, circular DNA molecules found in bacteria and some eukaryotes.
Features: Can carry antibiotic resistance genes and can be transferred between cells through processes like conjugation.
Significance: Important in biotechnology for gene cloning and genetic engineering.
Slide 6: Mechanisms of Extrachromosomal Inheritance
Non-Mendelian Patterns: Do not follow Mendel’s laws of inheritance.
Cytoplasmic Segregation: During cell division, organelles like mitochondria and chloroplasts are randomly distributed to daughter cells.
Heteroplasmy: Presence of more than one type of organellar genome within a cell, leading to variation in expression.
Slide 7: Examples of Extrachromosomal Inheritance
Four O’clock Plant (Mirabilis jalapa): Shows variegated leaves due to different cpDNA in leaf cells.
Petite Mutants in Yeast: Result from mutations in mitochondrial DNA affecting respiration.
Slide 8: Importance of Extrachromosomal Inheritance
Evolution: Provides insight into the evolution of eukaryotic cells.
Medicine: Understanding mitochondrial inheritance helps in diagnosing and treating mitochondrial diseases.
Agriculture: Chloroplast inheritance can be used in plant breeding and genetic modification.
Slide 9: Recent Research and Advances
Gene Editing: Techniques like CRISPR-Cas9 are being used to edit mitochondrial and chloroplast DNA.
Therapies: Development of mitochondrial replacement therapy (MRT) for preventing mitochondrial diseases.
Slide 10: Conclusion
Summary: Extrachromosomal inheritance involves the transmission of genetic material outside the nucleus and plays a crucial role in genetics, medicine, and biotechnology.
Future Directions: Continued research and technological advancements hold promise for new treatments and applications.
Slide 11: Questions and Discussion
Invite Audience: Open the floor for any questions or further discussion on the topic.
2. DETECTORS
• A chromatography detector is a device used
in high-performance liquid chromatography
(HPLC) to separate the components of a
mixture from a chromatography column.
• The detector senses the presence of
individual components as they leave the
column.
• Detectors convert changes in waste into an
electrical signal that is recorded by a data
system.
3. IDEAL PROPERTIES OF A DETECTOR
The detectors used in HPLC should have following
ideal properties
Good stability and reproducibility.
A linear response to solute.
Negligible base line noise.
Should be inexpensive.
Capable of providing information on the identity of the
solute.
A short response time independent of flow-rate.
High reliability and ease of operation.
The detector should be non-destructive.
5. THE DETECTORS USED IN HPLC ARE OF
MAJORLY TWO TYPES:
1. Selective detectors (solute property): These detectors
respond to a particular physical or chemical property
of the solute, being ideally independent of the mobile
phase. They are as follow:
✔Absorbance detectors
✔ Fluorescence detectors
✔ Electrochemical detectors Mass spectrometric
2. Detectors Universal detectors (bulk property):
measure the difference in some physical property of the
solute in the mobile phase compared to the mobile phase
alone. They are generally universal in application but tend
to have poor sensitivity and limited range. Such detectors
are usually affected by even small changes in the mobile-
phase composition which precludes the use of techniques
such as gradient elution. They are as follow:
7. ULTRAVIOLET/VISIBLE SPECTROSCOPIC
DETECTORS
Measures the ability of solutes to absorb light at a particular
wavelength(s) in the ultraviolet (UV) or visible (Vis) wavelength
range.
When light of a certain wavelength is directed at a flow cell,
the substance inside the flow cell absorbs the light. As a result,
the intensity of the light that leaves the flow cell is less than
that of the light that enters it. An absorbance detector
measures the extent to which the light intensity decreases
(i.e., the absorbance).
8. THREE COMMON TYPES OF UV/VIS
ABSORBANCE DETECTORS
Fixed Wavelength Detector
absorbance of only one given wavelength is
monitored by the system at all times (usually
254nm)
Simplest and cheapest of the UV/VIS detectors
Limited in flexibility
Limited in types of compounds that can be
monitored
Variable Wavelength Detector
A single wavelength is monitored at given time, but
any wavelength in a wide spectral range can be
selected
Wavelength vary from 190-900nm
More expensive, require more advanced optics.
More versatile, use for wider range of compound
More sensitive due to photomultiplier tube.
9. PHOTO DIODE ARRAY DETECTOR
operates by simultaneously monitoring absorbance of solutes at several
different wavelengths. Light from the broad emission source such as a
deuterium lamp is collimated by an achromatic lens system so that the total
light passes through the detector cell onto a holographic grating. In this way,
the sample is subjected to light of all wavelengths generated by the lamp.
The dispersed light from the grating is allowed to fall on to a diode array. The
array may contain many hundreds of diodes and the output from each diode
is regularly sampled by a computer and stored on a hard disc.
10. FLUORESCENCE DETECTOR
Fluorescence detectors for HPLC are similar in design to
the fluorometers and spectro-fluorometers. The
fluorescence detector is a near-ideal detector for those
solutes that exhibit molecular fluorescence. Their
sensitivity depends on the fluorescence properties of the
components in the elute.
11. REFRACTIVE INDEX DETECTOR
Measures the overall ability of the mobile phase and its solutes to
refract or bend light.
Refractive index detector measures the molecule's ability to deflect
light in a flowing mobile phase in a flow cell relative to a static mobile
phase contained in a reference cell.
The amount of defection is proportional to the concentration of the
solute in the mobile phase.
12. The Two chief types of RI detector are as follows.
The deflection refractometer, which measures the deflection of a
beam of monochromatic light by a double prism in which the reference
and sample cells are separated by a diagonal glass divide.
The Fresnel refractometer which measures the change in the
fractions of reflected and transmitted light at a glass-liquid interface as
the refractive index of the liquid changes.
13. ELECTROCHEMICAL DETECTORS
It is based on the measurement of the current resulting from an
oxidation/ reduction reaction of the analyte at a suitable electrode.
The level of current is directly proportional to the analyte
concentration.
Three electrodes are employed which are:
Working electrode
Auxiliary electrode
Reference electrode
14. ELECTRICAL CONDUCTIVITY DETECTOR
Used in analytical applications of ion-exchange chromatography for
the detection of ionic compounds.
Detector measures the ability of the mobile phase to conduct a
current when placed in a flow-cell between two electrodes.
Conductivity detectors measures electronic resistance and measured
value is directly proportional to the concentration of ions present in
the solution
15. EVAPORATIVE LIGHT SCATTERING
DETECTOR (ELSD)
Detection is based on the scattering of a beam of light by
particles of compound remaining after evaporation of the mobile
phase. It is a universal detector and does not required a
compound to have a chromophore for detection.
There are three steps involved in detection:
➤ Nebulization
➤ Mobile phase evaporation
➤ Detection
The flow from the column is nebulized with a stream of inert gas
(Nebulize means to convert a liquid into a fine spray or mist).
The mobile phase, which must be volatile, is evaporated, leaving
tiny particles of the analytes (you can see why this detection
method will not work with volatile compounds). The particles are
passed through a laser beam and they scatter the laser light.
The scattered light is measured at right angles to the laser beam
by a photodiode detector
17. MASS SPECTROMETER AS AN HPLC
DETECTOR
Liquid chromatography-mass spectrometry (LC-MS, or HPLC-MS) is
an analytical chemistry technique that combines the physical
separation capabilities of liquid chromatography (or HPLC) with the
mass analysis capabilities of mass spectrometry (MS).
It is a method that combines separation power of HPLC with
detection power of Mass spectrometry.
Mass spectrometry (MS) is a powerful analytical tool that can supply
both structural information about compounds and quantitative data
relating to mass.
18. INFRARED
SPECTROPHOTOMETRICDETECTOR
Infrared (IR) detectors have been used to a limited extent only for the
analysis of non-polar lipids, with the specific absorbance for the
carbonyl function between 1650 and 1860 cm-1 (or at about 5.75
microns) being the spectral region of value.
The wavelength scanning is provided by semicircular filter wedges,
the wavelength range being from 4000-690 cm-1.
It is not very sensitive and have serious drawback that most mobile
phase solvents absorb strongly in the IR region.
19. CHIRAL DETECTORS
Chiral detectors are used for detection of optically active compounds
such as amino acids, sugars, terpenes and other compounds
containing an asymmetric carbon.
There are two chiral detection techniques, polarimetry or optical
rotary dispersion (ORD) and circular dichorism (CD).
ORD detectors are based on differences in refractive index and CD
detectors differentiate enantiomers by measuring differences
between the absorption of light and left-handed circularly polarized
light due to existence of a chiral chromophores.
20. CONCLUSION
Detector is the key element which is present in any
device that is used for the identification and estimation of
any compound. It detects in a faster rate i.e., within some
fractions of second. Hence a detector is considered as a
brain of an instrument. Without the help of an detector, no
one would be able to analyze any compound.
21. REFERENCES
Handbook of pharmaceutical analysis- by Lena
Ohannesian and Antony J. Streeter.
Liquid chromatography detectors - by Raymond P.
W. Scott.
Chiral chromatography- by T. E. Beesley and R. P.
W. Scott.
High performance liquid chromatography detectors-
Review. International research journal of
pharmacy."