Download to read offline
![IJRET: International Journal of Research in Engineering and Technology eISSN: 2319-1163 | pISSN: 2321-7308
_______________________________________________________________________________________
Volume: 03 Special Issue: 16 | ICPECDM-2014 | Dec-2014, Available @ http://www.ijret.org 148
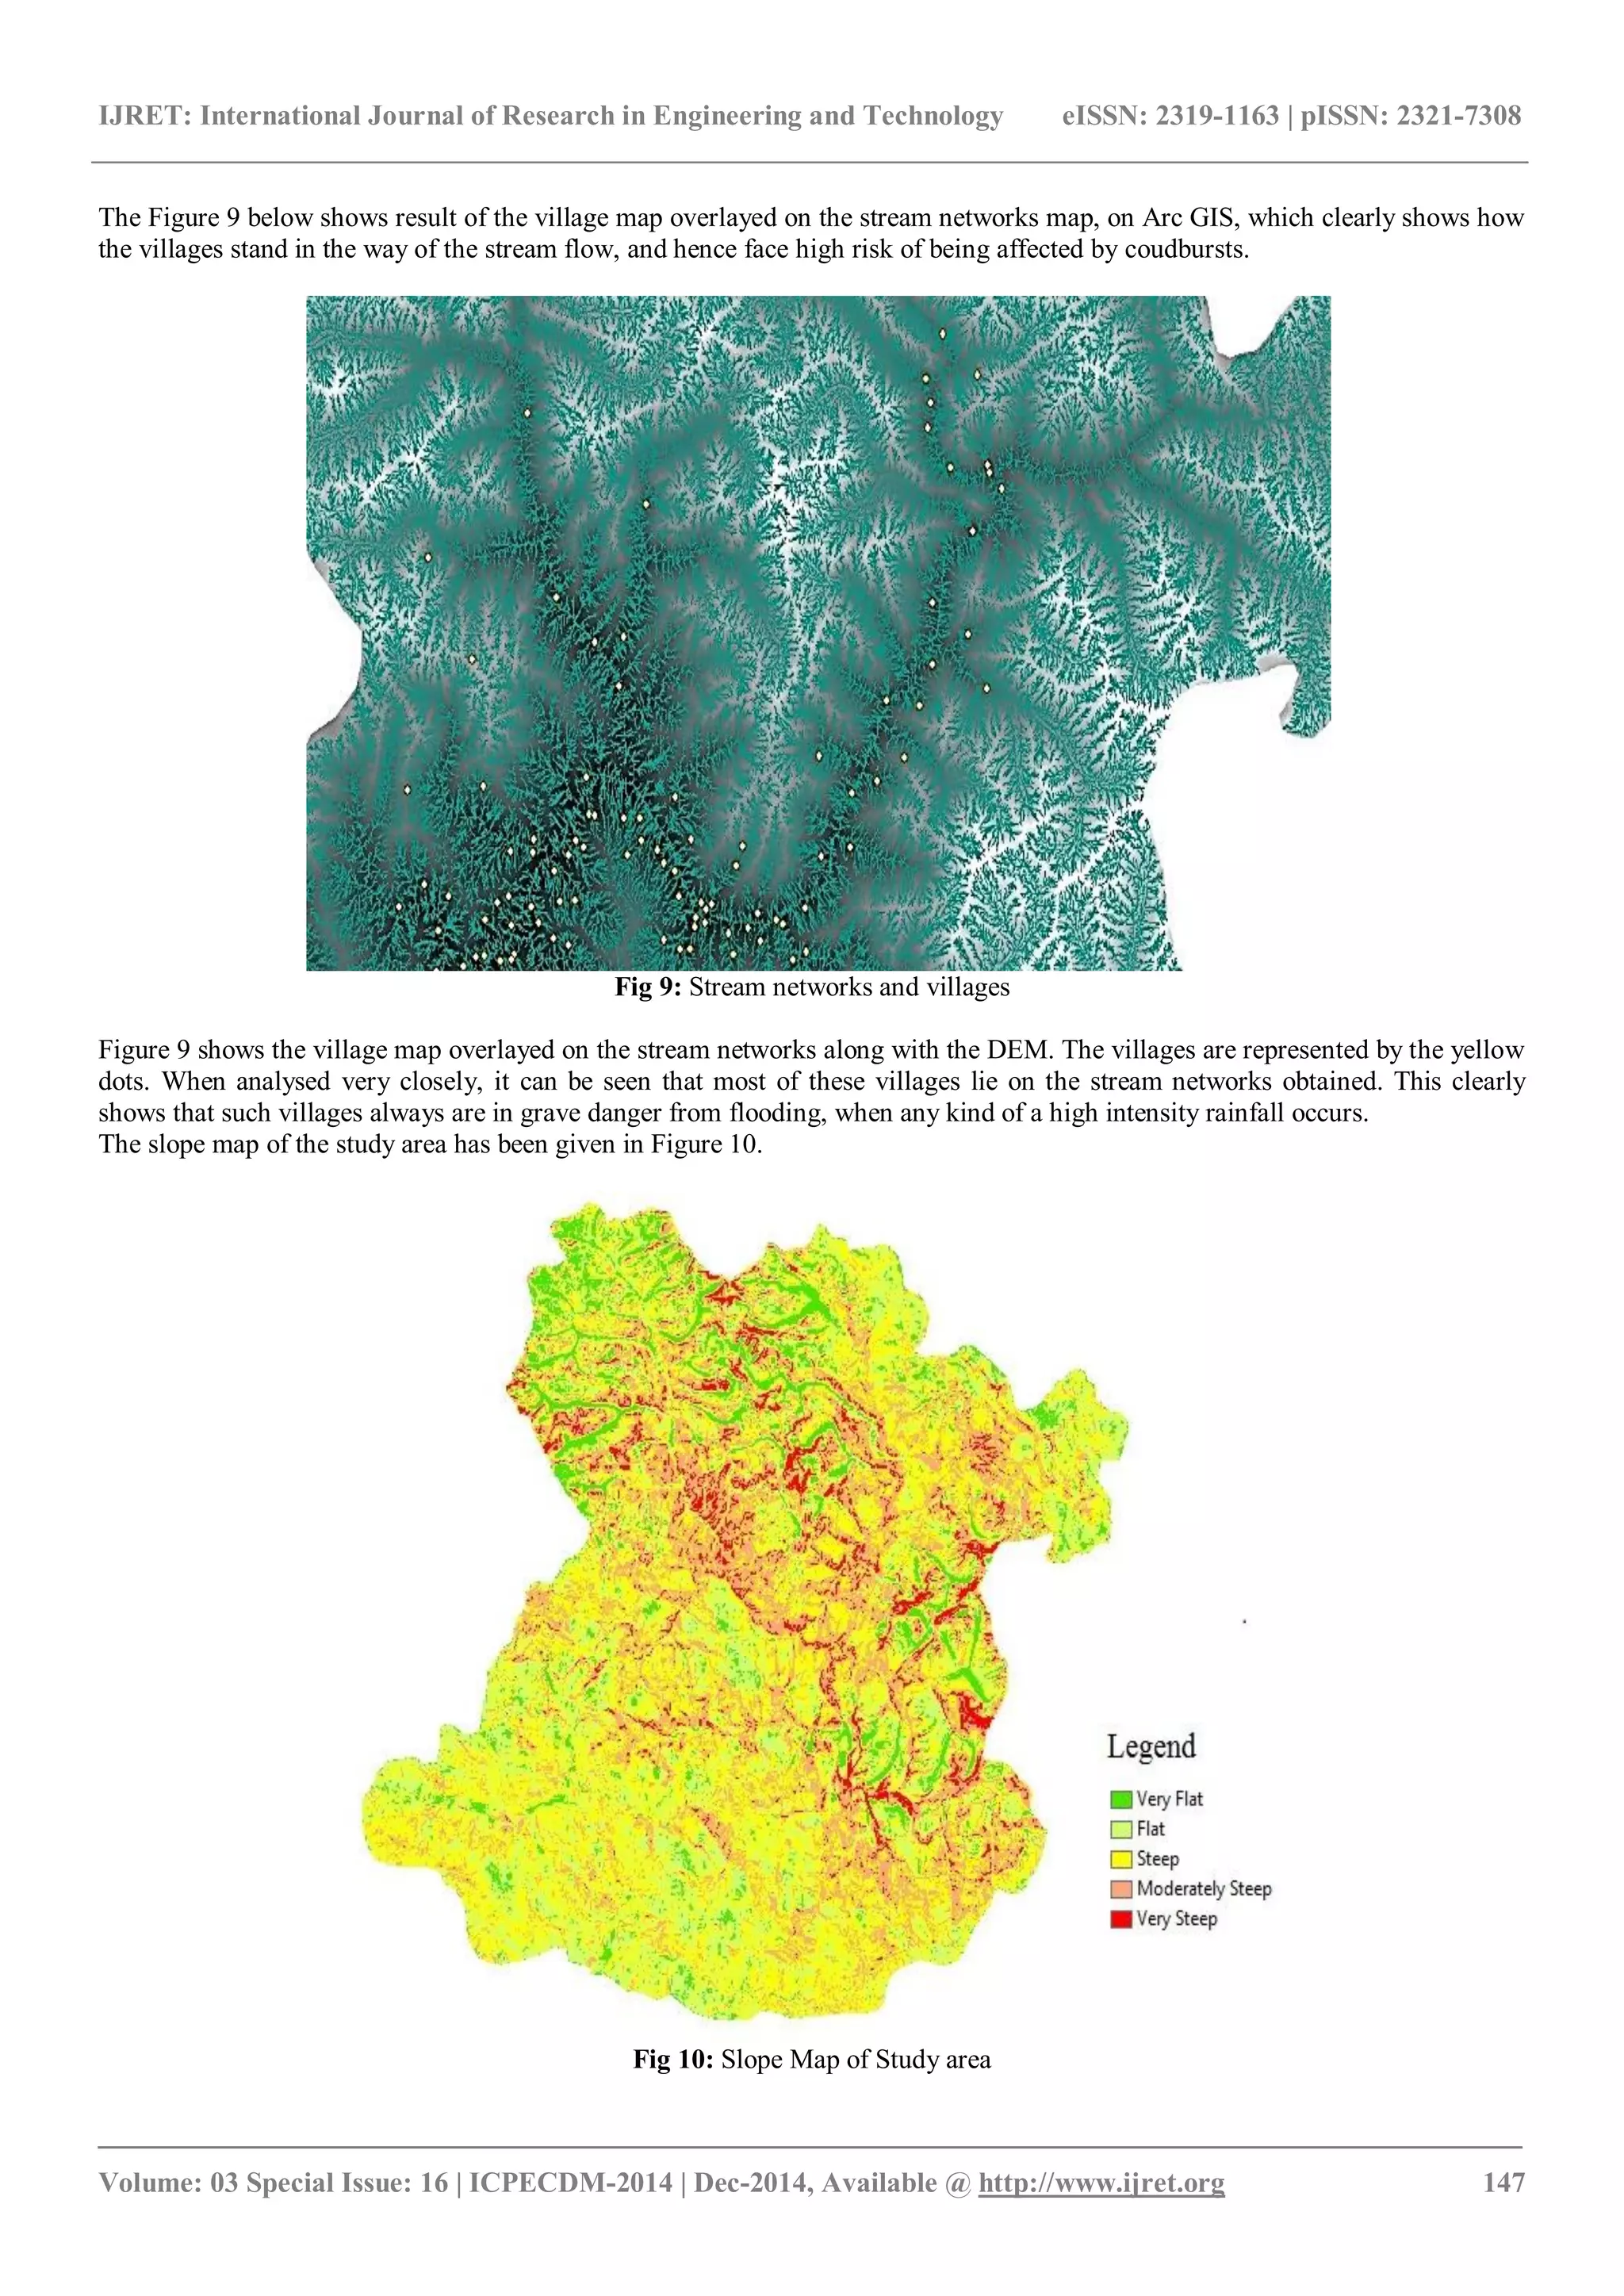
The study area has been classified by colours into Very Flat Land, Flat Land, Steep Land, Moderately Steep Land and Very Steep
Land. As can be seen, nearly 50% of the region show a trend of moderate and steep slope. Also more than 90% of the region has a
steep to very steep slope. It indicates that such a high gradient region is very much unsuitable for construction of any kind, be it
settlement or infrastructure. As it is such high slopes tend to be very unstable themselves, and with an infrastructure built on it,
would surely collapse.
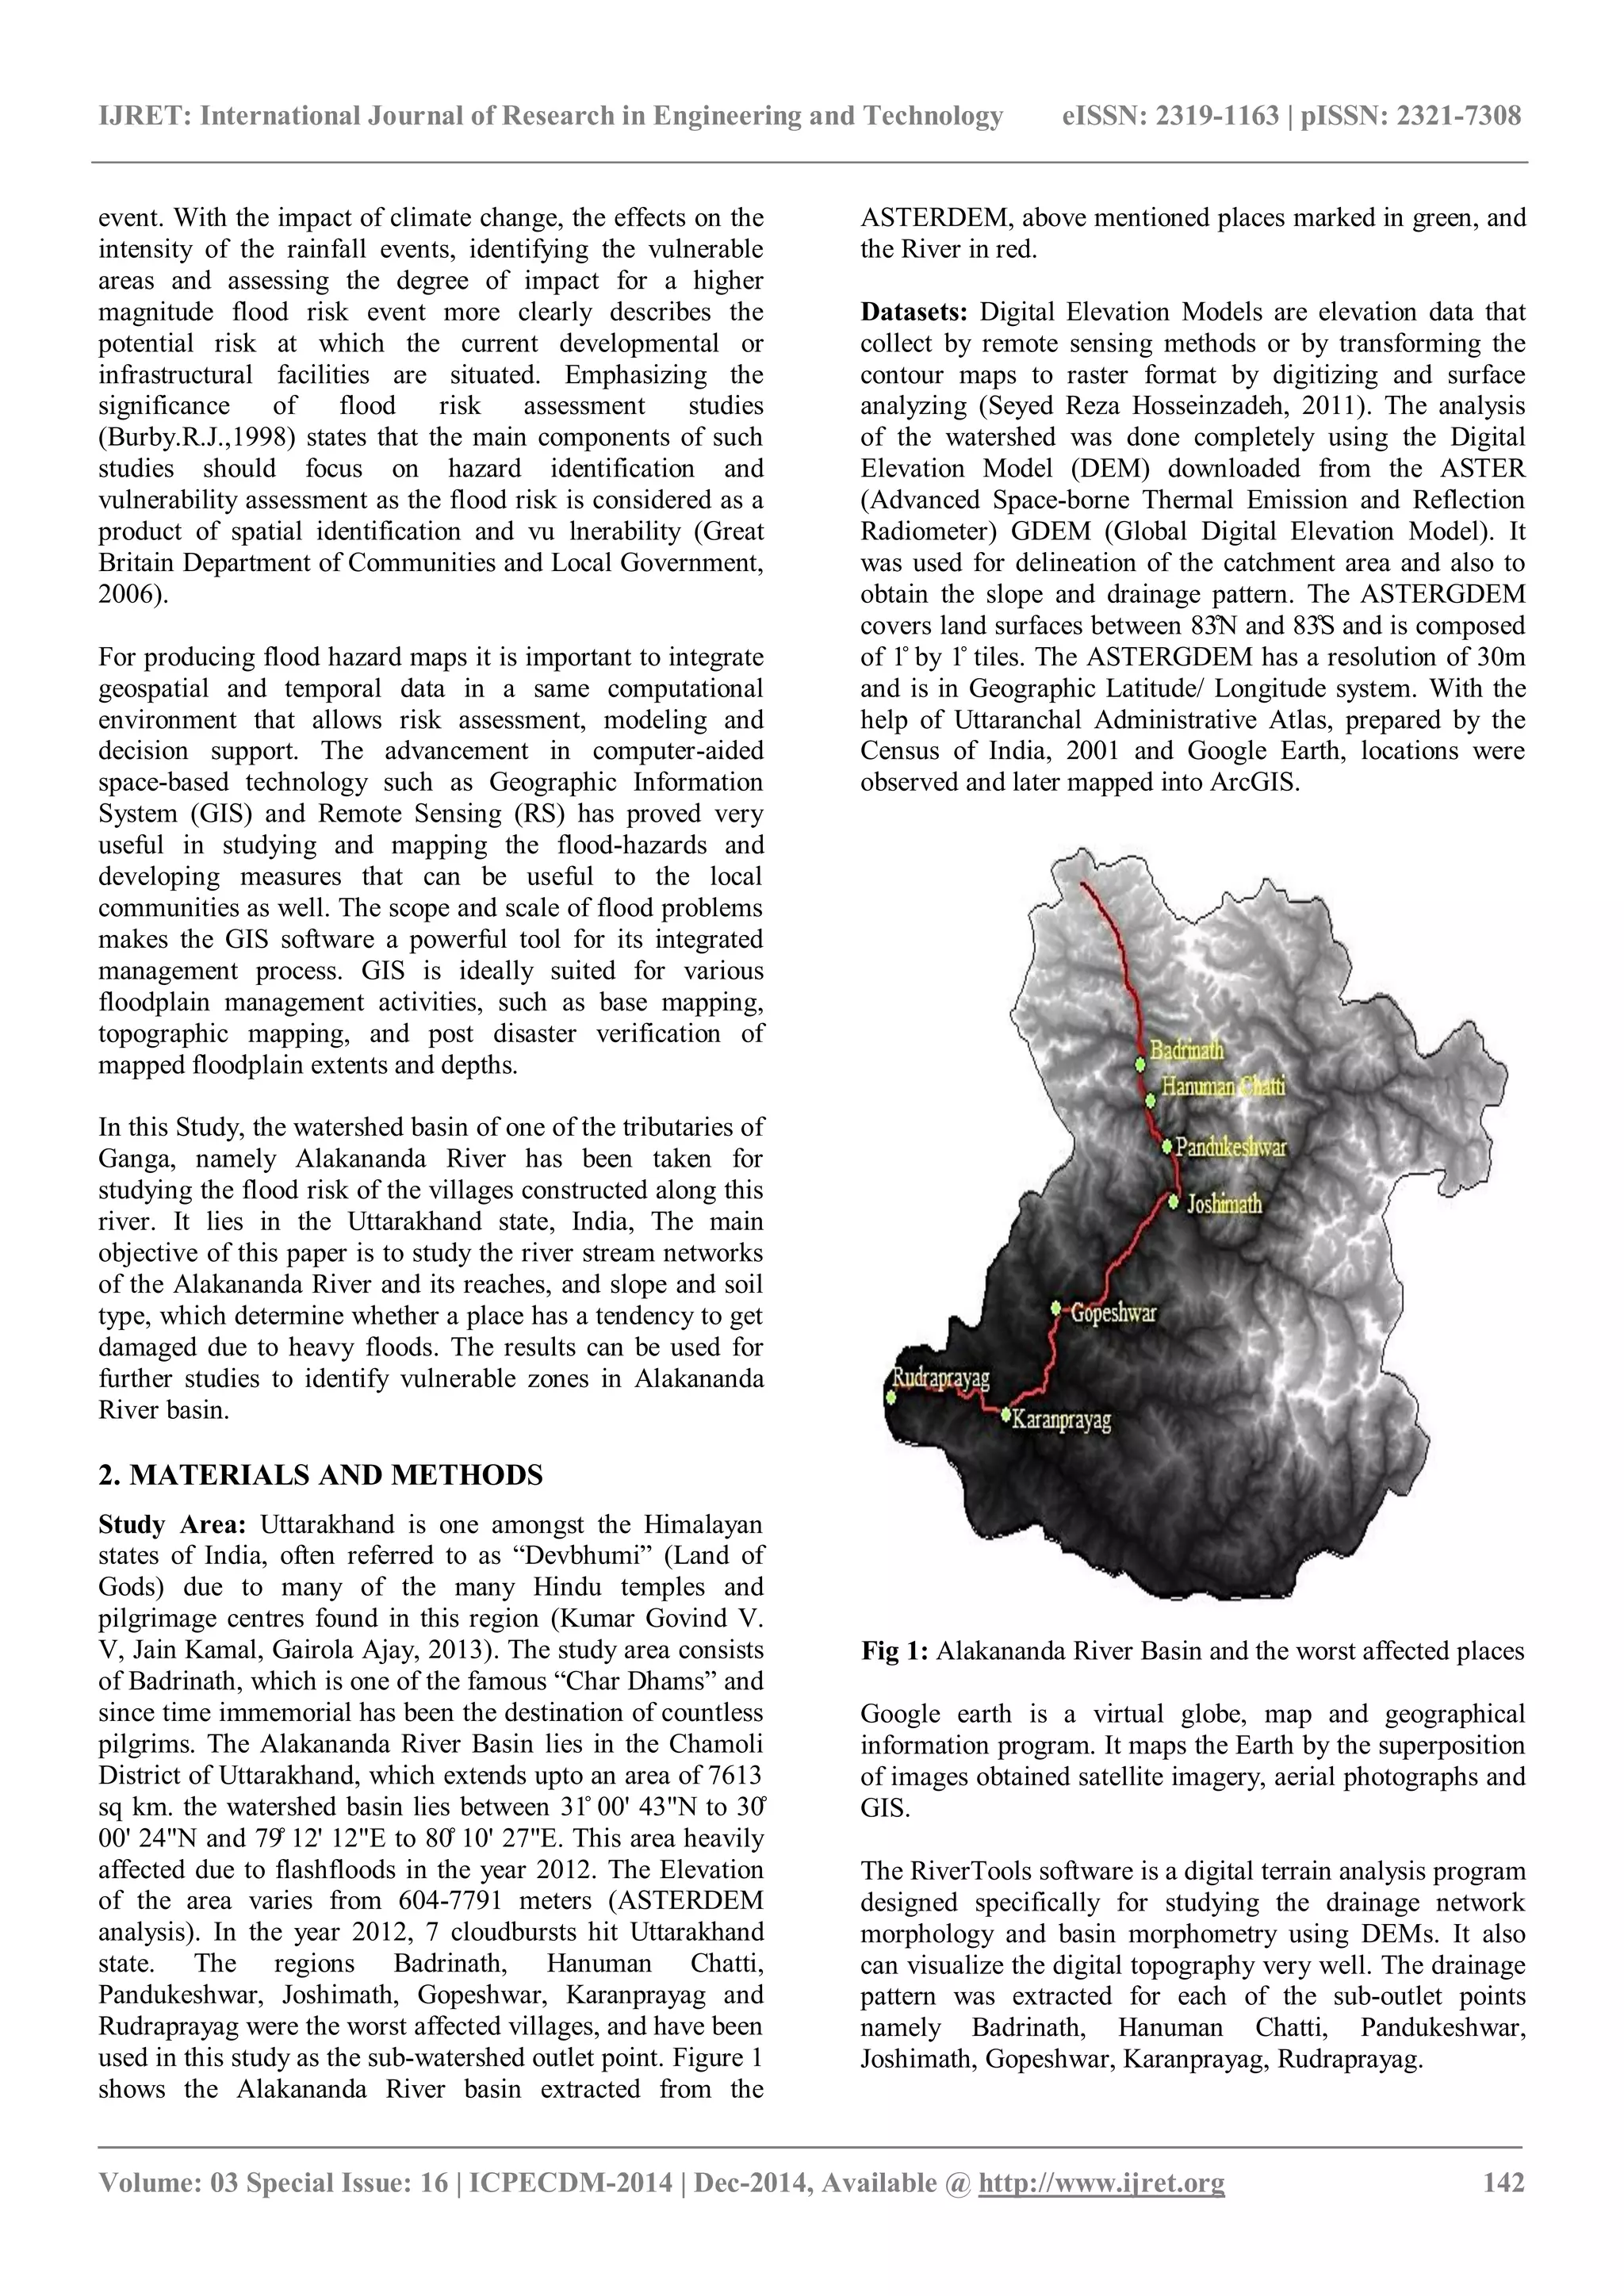
The soil map of the area was also studied (Figure 11).
Fig 11: Soil map of Uttarakhand
Soil map of the state shows that there are broadly three types
of soil in the region: first, the Glaciers with eternal snow,
second the Brown Hill Soils, and third, the Terai Soil. The
Glaciers and snow soil occur in the high altitudes of the
Himalaya. Here negligible rainfall occurs and main form of
precipitation is snow. The soil found here is very thin and
fragile. Since the texture of the soil is very course with high
gravel content, they are very much prone to displacements.
The Brown Hill soils are mixed with pebbles and gravels in
many regions. The texture varies from sandy to sandy loam,
therefore, coarse and are easily carried away by water. Most
of the region in the study area, namely Chamoli district is
covered by these two types of soils. The Terai Soil found in
other regions of the state is the soil found in the foothills of
the mountains, where it has been transported by hilly rivers
and streams and is made up of sandy material and raw
humus.
Thus when gathering all the information studies, we can say
that the villages located in such steeply sloping region and
with such coarse soil type, which is unable of withstanding
water flow, are always in a huge danger of flooding.
Application of GIS and RiverTools have helped to visualize
the proximity of the villages to the stream networks, and
hence point out the highly vulnerable villages.
4. CONCLUSION
From the river network study and the other parameters
studied, that is soil, slope and topographic position of
villages, the low-lying areas can be easily identified. Thus
the villages which are vulnerable to heavy floods along the
Alakananda River basin can be delineated. Further study of
the above work include the study of land use/cover pattern
of the area, which also highly affects the run-off from a
watershed. Also, hydraulic parameters of the river can be
evaluated using HEC-RAS and GIS. The study undertaken
here can help the government of Uttarakhand to locate the
regions which are highly unsuitable for construction of
infrastructure or residential areas, restrict the construction
permission at those places and thus minimize the risk of a
calamity happening from a disaster.
REFERENCES
[1]. Asthana A. K. L., Asthana Harshita, Geomorphic
Control of Cloud Bursts and Flash Floods in Himalaya with
Special Reference to Kedarnath Area of Uttarakhand, India
(2014)
[2]. Kumar Govind V. V, Jain Kamal, Gairola Ajay, A
Study and Simulation of Cloudburst event over Uttarkashi
Region using River Tool and Geomatic Techniques (2013)](https://image.slidesharecdn.com/detectionofhazardproneareasintheupperhimalayanregioningisenvironment-150131082718-conversion-gate02/75/Detection-of-hazard-prone-areas-in-the-upper-himalayan-region-in-gis-environment-8-2048.jpg)
![IJRET: International Journal of Research in Engineering and Technology eISSN: 2319-1163 | pISSN: 2321-7308
_______________________________________________________________________________________
Volume: 03 Special Issue: 16 | ICPECDM-2014 | Dec-2014, Available @ http://www.ijret.org 149
[3]. Burby, R. J., Cooperating with Nature: Confronting
Natural Hazards with Land use planning for Sustainable
Communities. Washington DC: Joseph Henry/National
Academy Press (1998)
[4]. Great Britain Department of Communities and Local
Government, Planning Policy Statement 25: Development
and Flood Risk. London: Crown Copyright, PPS25 (2006)
[5]. Kumar Govind V. V, Jain Kamal, Gairola Ajay,
Analysis of Cloudburst in ungauged watersheds using HEC-
RAS model in GIS Environment.
[6]. ICIMOD, 2010, International Centre for Integrated
Mountain Development.
[7]. Seyed Reza Hosseinzadeh, International Journal of
Environmental Science and Development, Vol 2, No 3, June,
2011](https://image.slidesharecdn.com/detectionofhazardproneareasintheupperhimalayanregioningisenvironment-150131082718-conversion-gate02/75/Detection-of-hazard-prone-areas-in-the-upper-himalayan-region-in-gis-environment-9-2048.jpg)

This document summarizes a study that used GIS and remote sensing tools to identify hazard-prone areas in the Alakananda River basin located in Uttarakhand, India. The study analyzed digital elevation data, soil maps, and extracted river networks to determine areas vulnerable to flooding from cloudbursts and heavy rainfall. Slope maps showed that over 50% of the region has moderate to steep slopes unsuitable for development. Soil maps indicated the presence of thin, coarse soils that are easily eroded. Overlaying village locations on river networks revealed that many villages are situated directly in stream paths, exposing them to flood risks. The integrated analysis identified highly vulnerable regions for future disaster mitigation planning.