Download to read offline
![International Research Journal of Engineering and Technology (IRJET) e-ISSN: 2395-0056
Volume: 05 Issue: 03 | Mar-2018 www.irjet.net p-ISSN: 2395-0072
© 2018, IRJET | Impact Factor value: 6.171 | ISO 9001:2008 Certified Journal | Page 3591
Preparation of flood model and hazard estimation on Yamuna River
(using GIS and remote sensing)
Sneha1, Shivangi Mittal2, Vikrant Nagar3, Sumit Moral4, Bhupendra Teli5
1,2,3,4 B.Tech students,Dept. of Information Technology Engineering, IMS Engineering College,Ghaziabad,India
5Assistant Professor, Dept. of Information Technology Engineering, IMS Engineering College, Ghaziabad,India
---------------------------------------------------------------------***---------------------------------------------------------------------
Abstract - Floods are water induced disasters that lead to
temporary inundation of dry land cause serious damages in
the affected location such as loss of lives , properties and
destruction of infrastructures. Knowing the factthatthefloods
are part of human being life and that this natural phenomena
can't be fully controlled, it's important to focus on this issue
and improve knowledge about the prevention from damages.
In order to achieve this objective it is crucial that morespecific
and scientific model must be developed for a better
understanding of the flooding phenomena and their related
geographical, hydrological and geomorphologic causes. . The
impact of floods on people globally has led to the mitigationof
the residents’ to reduce the associated risk of floods to a
manageable point or perhaps eradicate its bad impact .The
management of flood risk begins with identification of flood
prone areas. This study used the scientific technique of GIS to
identify flood risk areas within Delhi.
Key Words: GIS (Geographical InformationSystem),Remote
Sensing, Flood management.
1. INTRODUCTION
Flooding is a process that has always played an important
role in shaping the landscape. Floods that occur also
generally have beneficial impacts for theecosystemsandsoil
fertility, and help to recharge undergroundstoresofwater.It
is important to note that climate change occurring and flood
hazard mapping typically provide a snapshot of flood risk at
a given point in time. Due to climate change in relative sea
level flood hazard maps will require periodic updates in
order to reflect the changing risk at flooding. Flood hazard
map can be used by developersto determinefloodinsurance
premium in area where flood insurance exists. GIS are
frequently used to produce flood hazard map and they
provide an effective way of gathering information from
different map and digital elevation model. Potential of GIS
technology is that it integrate all data with transparencyand
also provide one platform for surveying, mapping, storing,
analysing and present all types of spatial or geographical
data and Non-Spatial data or related information.As GIS is
fast, transparent and accurate so it can act as a decision
support tool. GIS data can be utilized for evaluation of flood
impact and also can be used for planning and management
before execution of policies. GIS is useful in flood hazard
zone mapping as it manage things geographically and also
represent knowledge in visual format so during emergency
mitigation of people can be possible. Real time geographic
data can improve the allocation of resources for response.
Flood is a major problem to the human race where
settlements have grown up along the river. The main
advantage of using GIS for flood mappingandmanagementis
that it generates a visualization of floodingthatcouldbevery
useful in flood mitigation planning process.
1.2 LITERATURE SURVEY:
Floods are the most critical among all the natural calamities
in the world causing vast damages to life and property. In
this paper the researcher has done a literature study on
hydraulic modeling on flood plain mapping and concluded
that with the help of this software he flood inundation and
flood mapping of the low relief area effected by flood can be
easily trace out. The model is considered asuseful toolwhen
combined with the GIS tools, determine the water depth,
velocity mapscan be prepared and the flood inundated area
can be easily calculated in the GIS software [1].
The papers represented by Vahdettin demir and Ozgur Kisi
describes the flood hazard mapping by using GIS and
hydraulic model for the Mert River, Samsun, Turkey.
The aim of this study is to obtain flood hazard maps of the
Mert river basin using GIS and HEC-RAS (Hydraulic
Engineering Center’s- River Analysis System) for floods of
different return period’s .The methodology for developing
flood hazard map can be explained by following three
phases- (i) preparing digital elevation model using ArcGIS
(ii) simulation of flood flows of different return periods
using HEC-RAS hydraulic model. (iii) Preparing flood risk
mapsby integrating phases(i) and (ii). Theconclusionisthat
some areas are highly affected from flood for low return
periods and this study also indicates an insufficient urban
planning in this area. Therefore floods can be prevented in
this region by adding levy and regulation of riverbottom [2].
Another study was conducted in which flood extent was
extracted from satellite image available for one in 50 year
flood event occurred on June 2008 in this river. Then that
was compared with the flood extent derived from the flood
extent obtained for the 50-year rainfall using HEC-HMS
(Hydraulic Engineering Center’s – Hydrologic Management
System) and HEC-RAS. Base on the flood extent, this project
is to develop, demonstrate and validate an information
system for flood forecasting, planning and management
using remote sensing data with the help of Flood Hazard
Maps for different return periods. The study reveals that
about 11.5 km2 (square kilometer) and 5.41 km2 are at high
risk with respect to population andbuildingsrespectivelyfor
a 100yr return period flood event. Statisticsforthemoderate](https://image.slidesharecdn.com/irjet-v5i3843-190205053451/75/IRJET-Preparation-of-Flood-Model-and-Hazard-Estimation-on-Yamuna-River-using-GIS-and-Remote-Sensing-1-2048.jpg)
![International Research Journal of Engineering and Technology (IRJET) e-ISSN: 2395-0056
Volume: 05 Issue: 03 | Mar-2018 www.irjet.net p-ISSN: 2395-0072
© 2018, IRJET | Impact Factor value: 6.171 | ISO 9001:2008 Certified Journal | Page 3592
and low risks were found to be as follows; 65.5km2 and 46
km2, and 33km2 and 58.5 km2, respectively [3].
Another study with objectives i) to produce floodplain map
based on the historical flood (2010) for Yamuna River. ii)
Identify areas where uncertainty in flood or land elevations
causes uncertainty in extent of flood inundation and
generate floodplain mapsusing hydraulicmodeling, GISand
RS environment. iii) These can be easily analyzed withother
digital data, such as locations of roads and buildings and
calculate water depth, velocity and Inundation area was
conducted. The study undertaken depictsthe floodmapping
of the area of interest for highest flood level 2010 which
thrive inside of the extent of inundation in the area. Historic
flood maps could help to property owners obtain flood
insurance, municipal planning, emergency action plans [4].
2. HISTORICAL OVERVIEW ON FLOOD IN YAMUNA
RIVER:
The water of Yamuna from Yamunotri to Wazirabad that is
about 377 kilometers is absolutely pure. The discharge of
waste water through 15 drainsbetween Wazirabad barrage
and Okhla barrage leaves the river severely polluted after
Wazirabad. Nearly every year there is flooding in River
Yamuna, the intensity of which may below, medium or high.
The water level of Yamuna in summers is found to be nearly
201.0m. During this type of flood, the water generally
remains within its regime and no danger is created to life
and property. A close watch iskept all the time on the future
discharges of Yamuna River by the departmentalofficersand
the information is collected from Tejawala headwork’s, the
controlling point in upstream. The floods which reach the
water level between 203.0m and 206.44m are consideredas
medium floods In this type of flood, the water spreadsout of
the regime and touches the embankments constructed on
both sides. The floods hitting river Yamuna in years 1967,
1971, 1975, 1976, 1978, 1988, 1995 and 1998 have beenthe
major ones reaching up to a water level of 206.0 meter or
more.
Out of the above the flood of 1978 has been the highest
recorded in the available history of River Yamunawhichwas
recorded as 207.49 m(meter) (680.75 feet) on 5/6
September, 1978. Apart from the damages estimated at
nearly Rs. 10 crores, eighteen lives were lost and thousands
of people were rendered homeless. Shahdra on the left bank
of the river was also affected by the floods however it was
saved by raising the heights in certain areas using earth
filled bags
3. COMPONENTS OF GIS:
Hardware:
Hardware is the computer on which a GIS operates. Today,
GIS software runs on a wide range of hardware types, from
centralized computer servers to desktop computers used in
stand-alone or networked configurations.
Software:
Software used in this project are open source software .Key
software components are:
Qgis:
QGIS (previously known as Quantum GIS) is a cross-
platform free and open-source desktop geographic
information system (GIS) application that supportsviewing,
editing, and analysis of geospatial data.
Global Mapper:
Global Mapper is more than just a utility; it offers a
surprisingly extensive collection of analysis and data
processing tools in a truly affordable package. Providing
support for virtually every known spatial file format as well
as direct access to common spatial databases, this
remarkable application can read, write, and analyze all of
your current data.
Google Earth:
Google earth is software which depicts the 3D
representation of earth in digital form. Google Earth is used
in order to work as map can show all of the terrestrial
elevations like trees, mountains and buildings or can show
the depth of the water.
4. STUDY AREA:
Delhi, the capital of India is located on the both sides of
banks of river Yamuna. The Yamuna River and the terminal
part of the Aravalli hill ranges is the two main geographical
feature of Delhi. The Aravalli hill rangesare coveredwiththe
forest and are called the ridges. Delhi is surrounded by the
Thar Desert in the southwest which has always checked the
intruders. The lofty Himalaya lays in the north and in the
south the Aravalli ranges and in the east lays Ganga plain.
Delhi is situated in the northern India between the latitudes
of 28’24.17 to 28’53.00” north and the longitudes of
76’50.24” to 77’20.37”east. It shares the border of Uttar
Pradesh in the east and Haryana in the north, west and
south. It occupies the central geographical location as it is
1,542 kms far from Mumbai, 1536 kms from Calcutta, 1700
kmsfrom Bhubaneswar. The total area of the stateofDelhiis
1483sq.kms of which about 38 percent is rural and urban
area includes 924.68sq.kms .Its maximum length is 51.90
kms and the greatest width is 48.48 kms.
Yamuna catchment up to Delhi is divided in two parts, the
upper catchment from source in Himalayas to Kalanaur in
Haryana which comprisesof hillsof West Uttar Pradesh and
parts of Himachal Pradesh and the lower catchment from
Kalanaur to old Delhi Rail Bridge which consists of West
Uttar Pradesh and Haryana. River Yamuna entersDelhifrom
the northeast near Palla at an altitude of 210.3 meters and
after a traverse of about 40 km., it leaves Delhi at an altitude
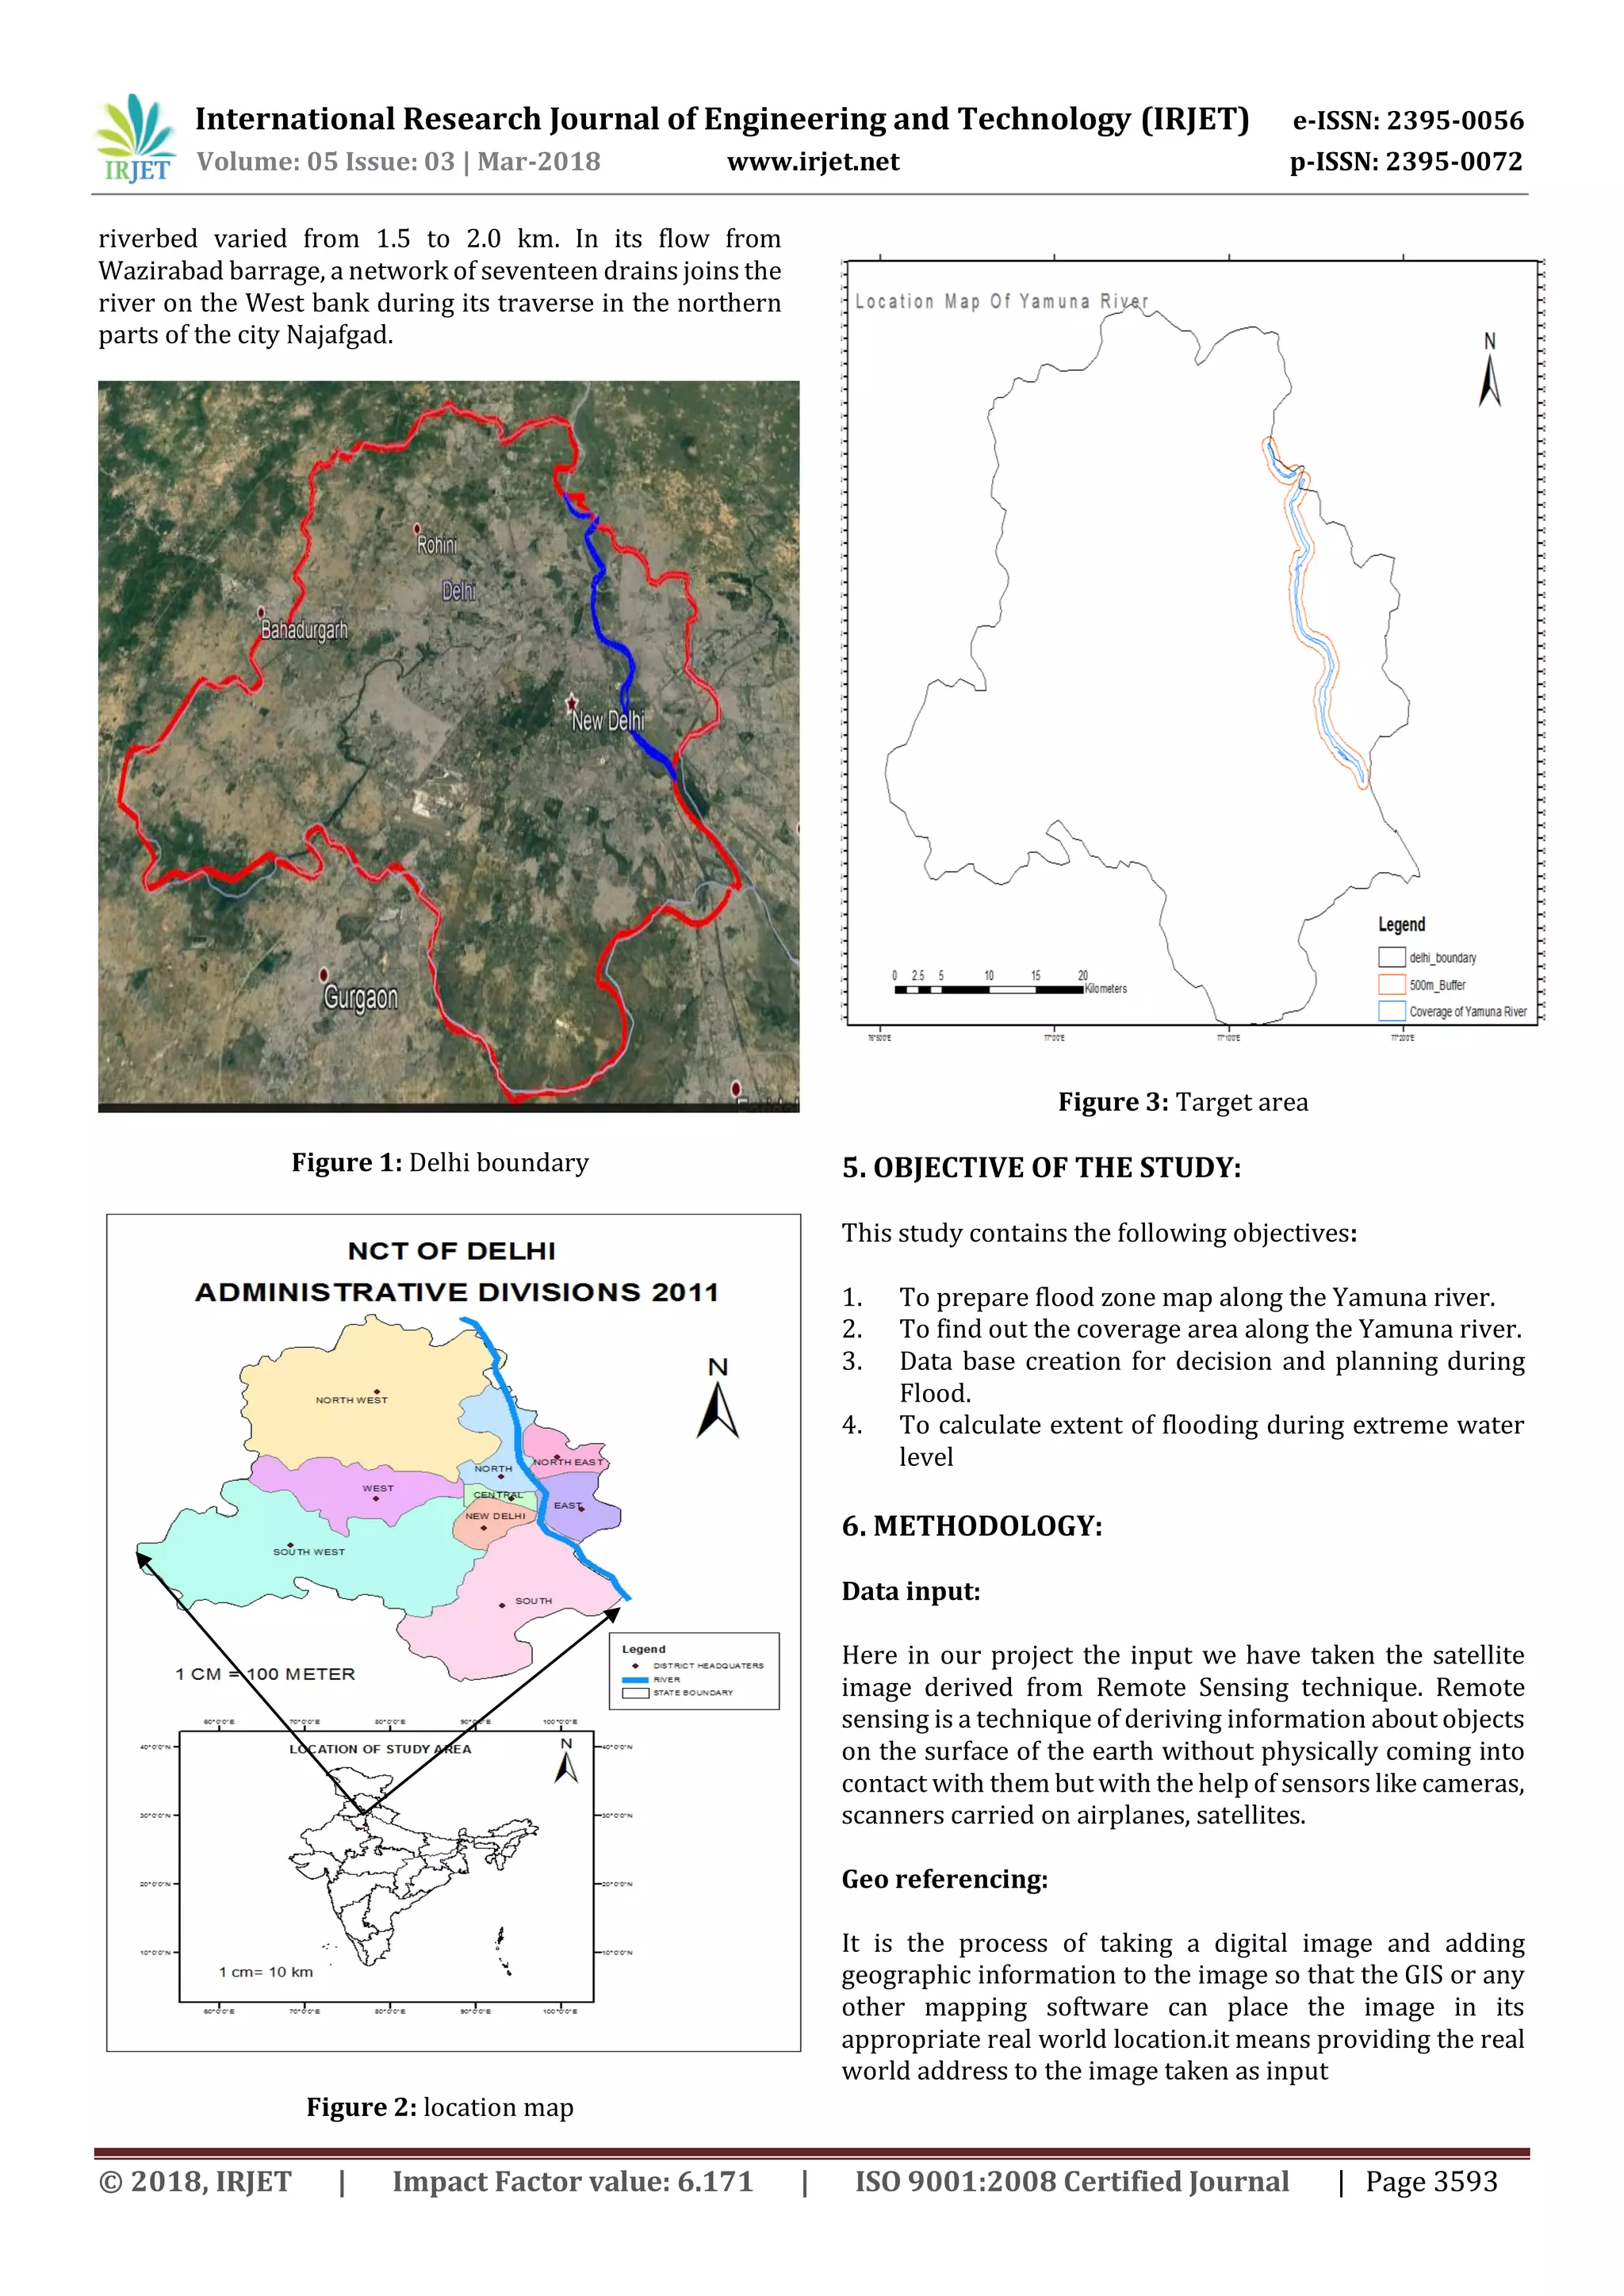
of 198.12 m near Jaitpur in the South. The width of the](https://image.slidesharecdn.com/irjet-v5i3843-190205053451/75/IRJET-Preparation-of-Flood-Model-and-Hazard-Estimation-on-Yamuna-River-using-GIS-and-Remote-Sensing-2-2048.jpg)

1. The document describes a study that used GIS and remote sensing techniques to create flood models and estimate flood hazards along the Yamuna River in Delhi, India. 2. The study analyzed satellite imagery to identify flood-prone areas, calculate the extent of flooded areas during extreme events, and assess flood risks to infrastructure, agriculture lands, and urban areas. 3. The results indicated approximately 19.5 square kilometers of land within 500 meters of the Yamuna River boundary is affected by floods, including over 2.8 square kilometers of urban settlements and 2.1 square kilometers of forest area. Thematic maps were generated to visualize the flood risk to different geographical features.


