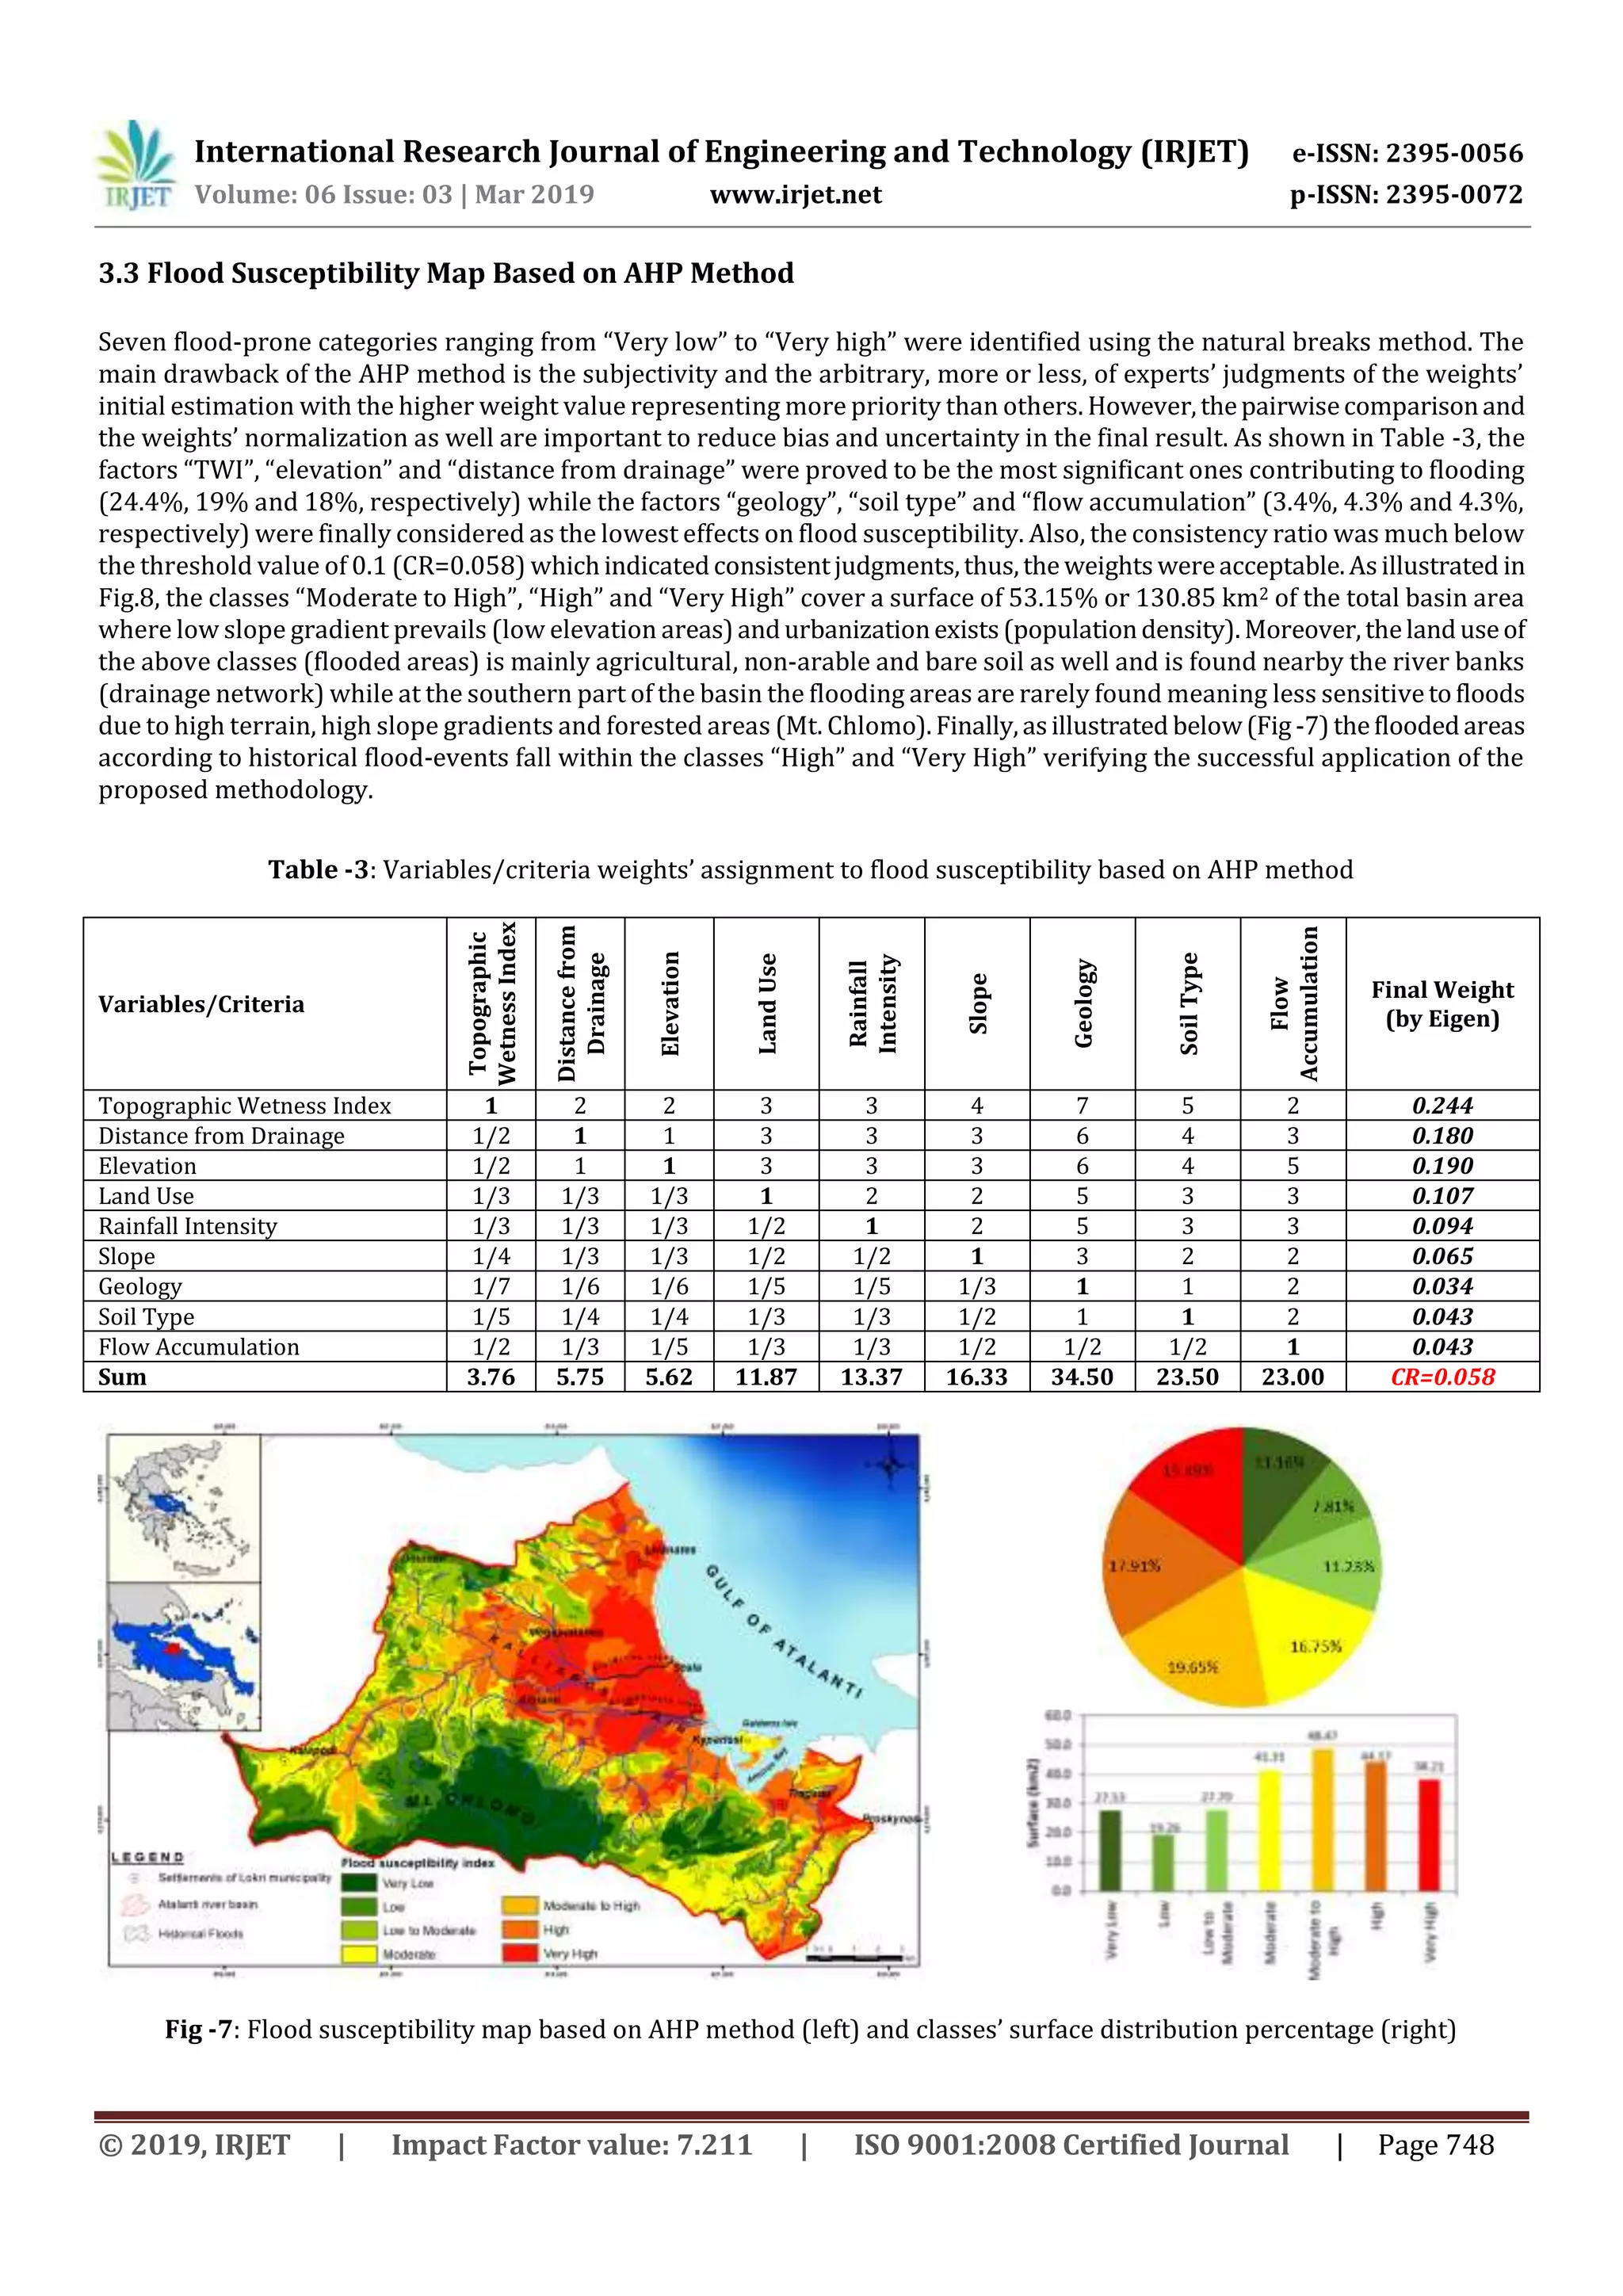
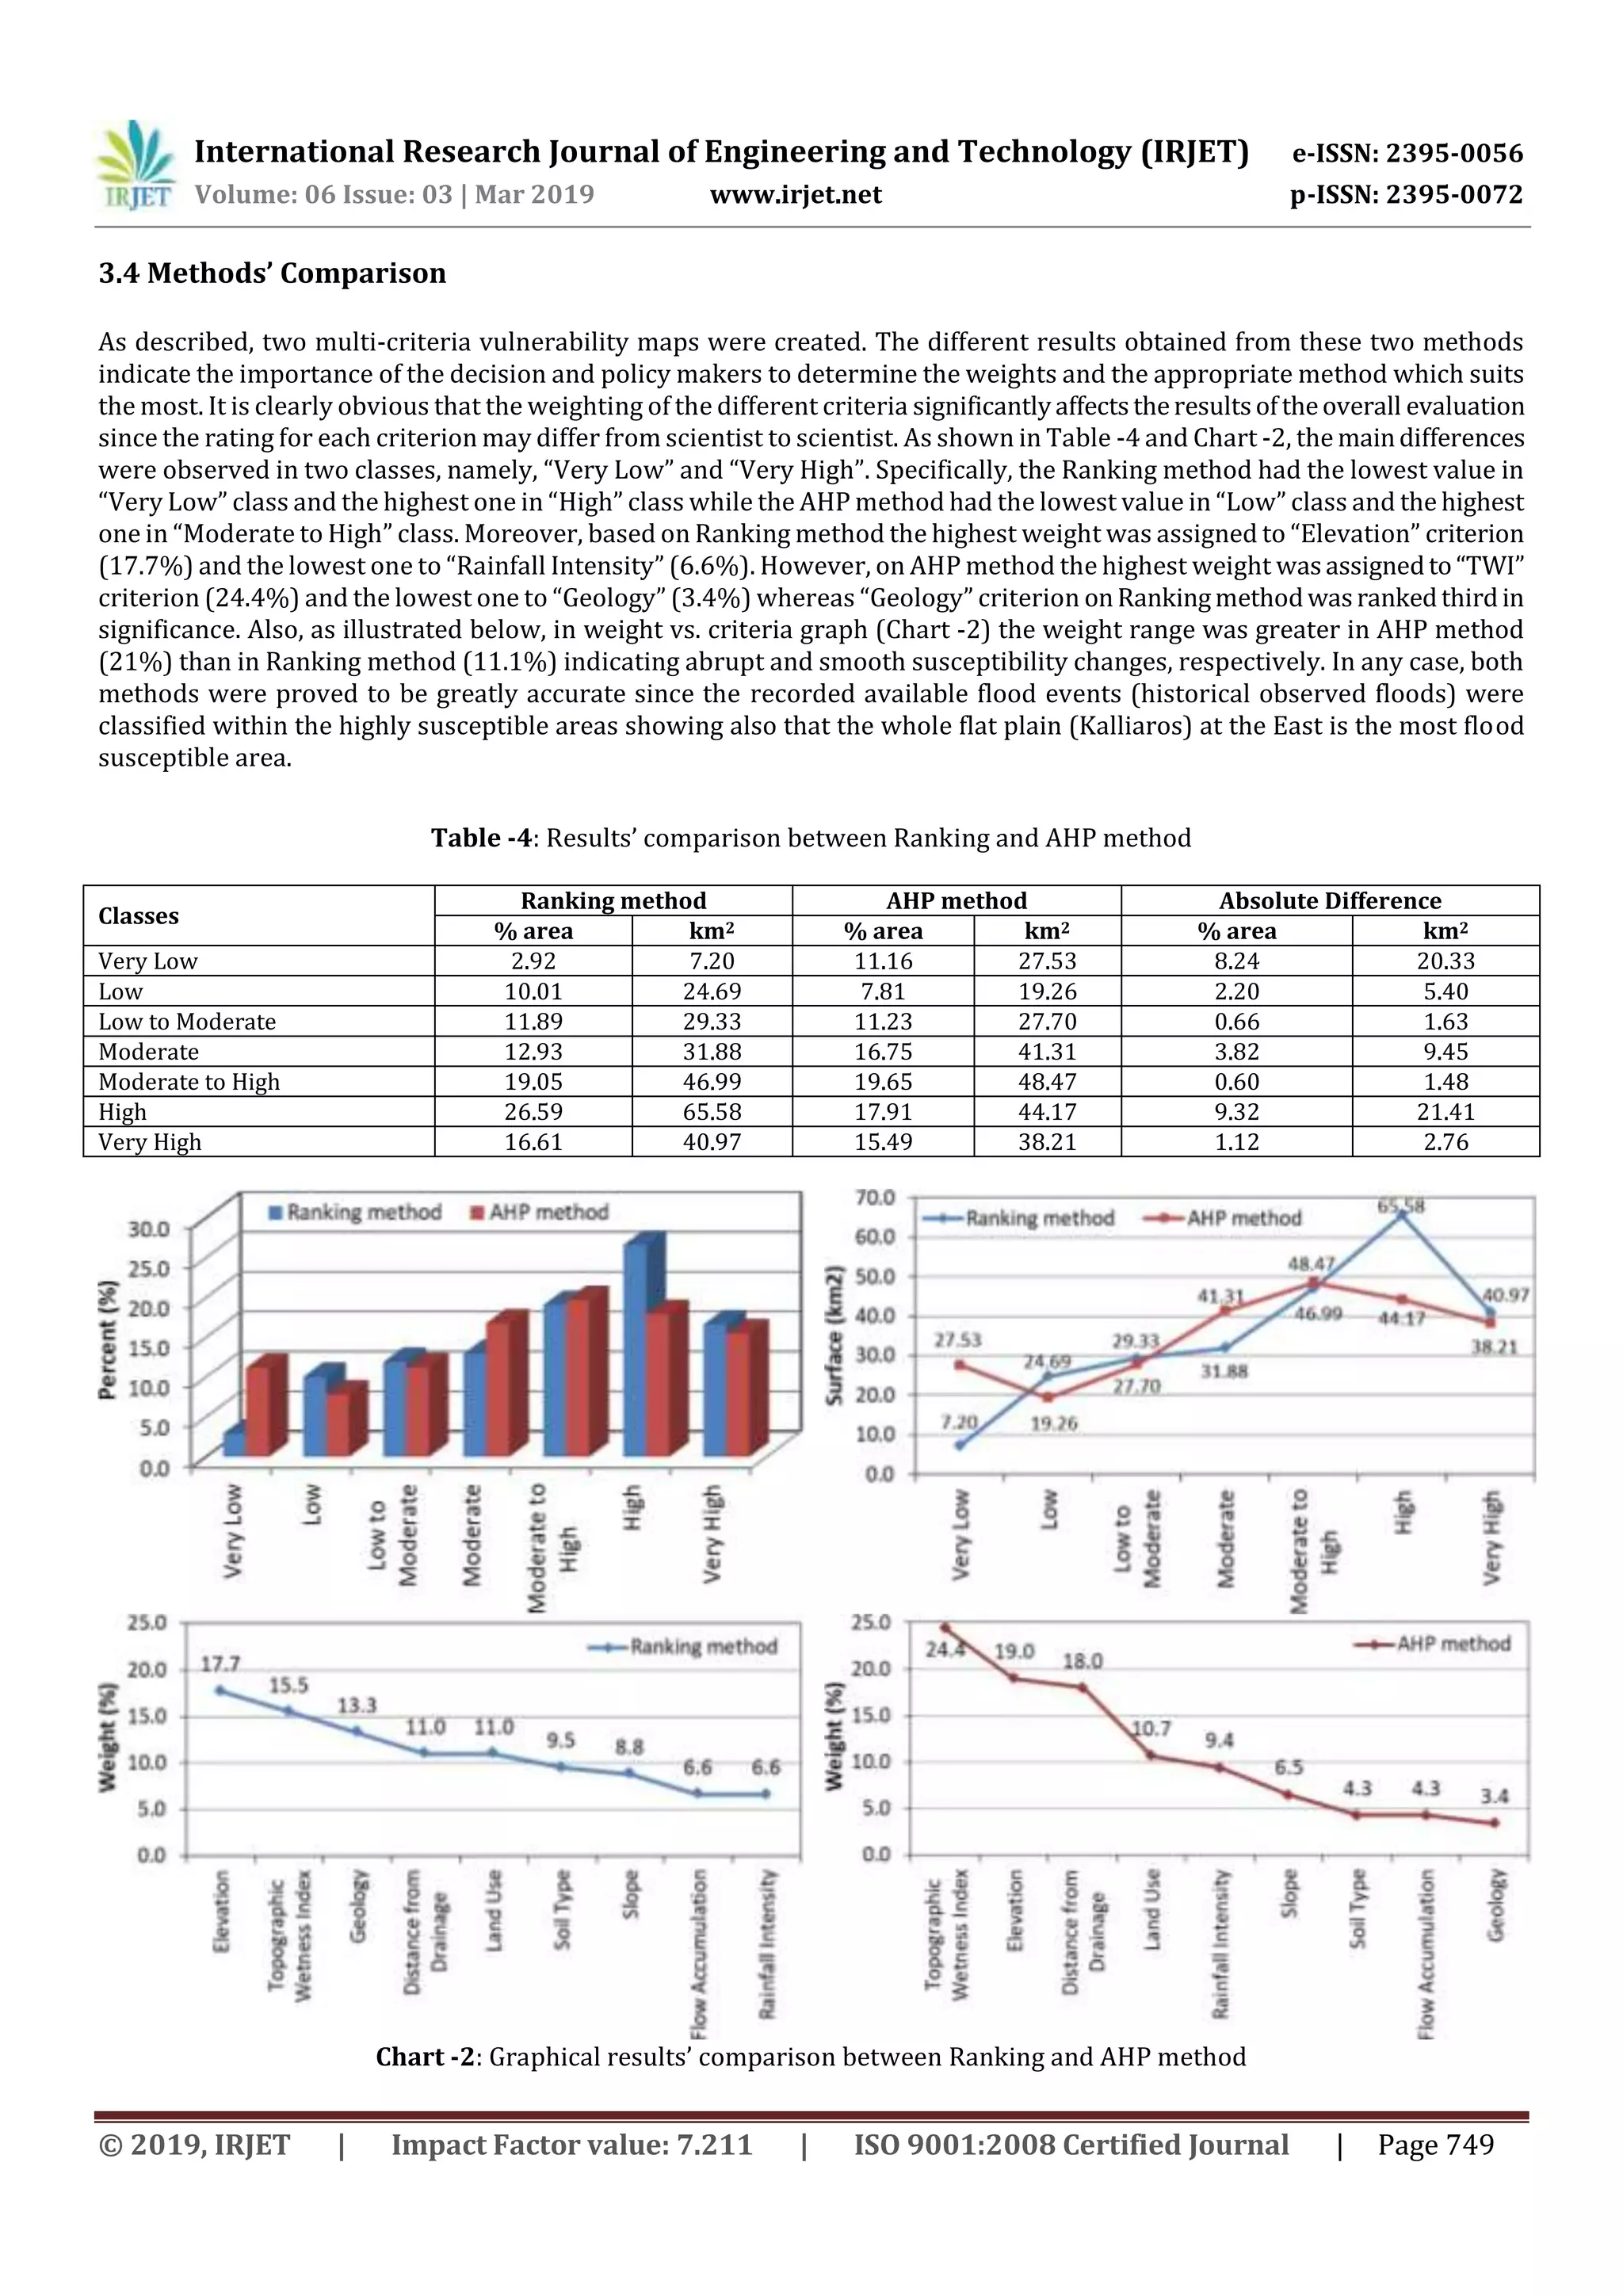
IRJET- Flood Susceptibility Assessment through GIS-Based Multi-Criteria Approach and Analytical Hierarchy Process (AHP) in a River Basin in Central Greece
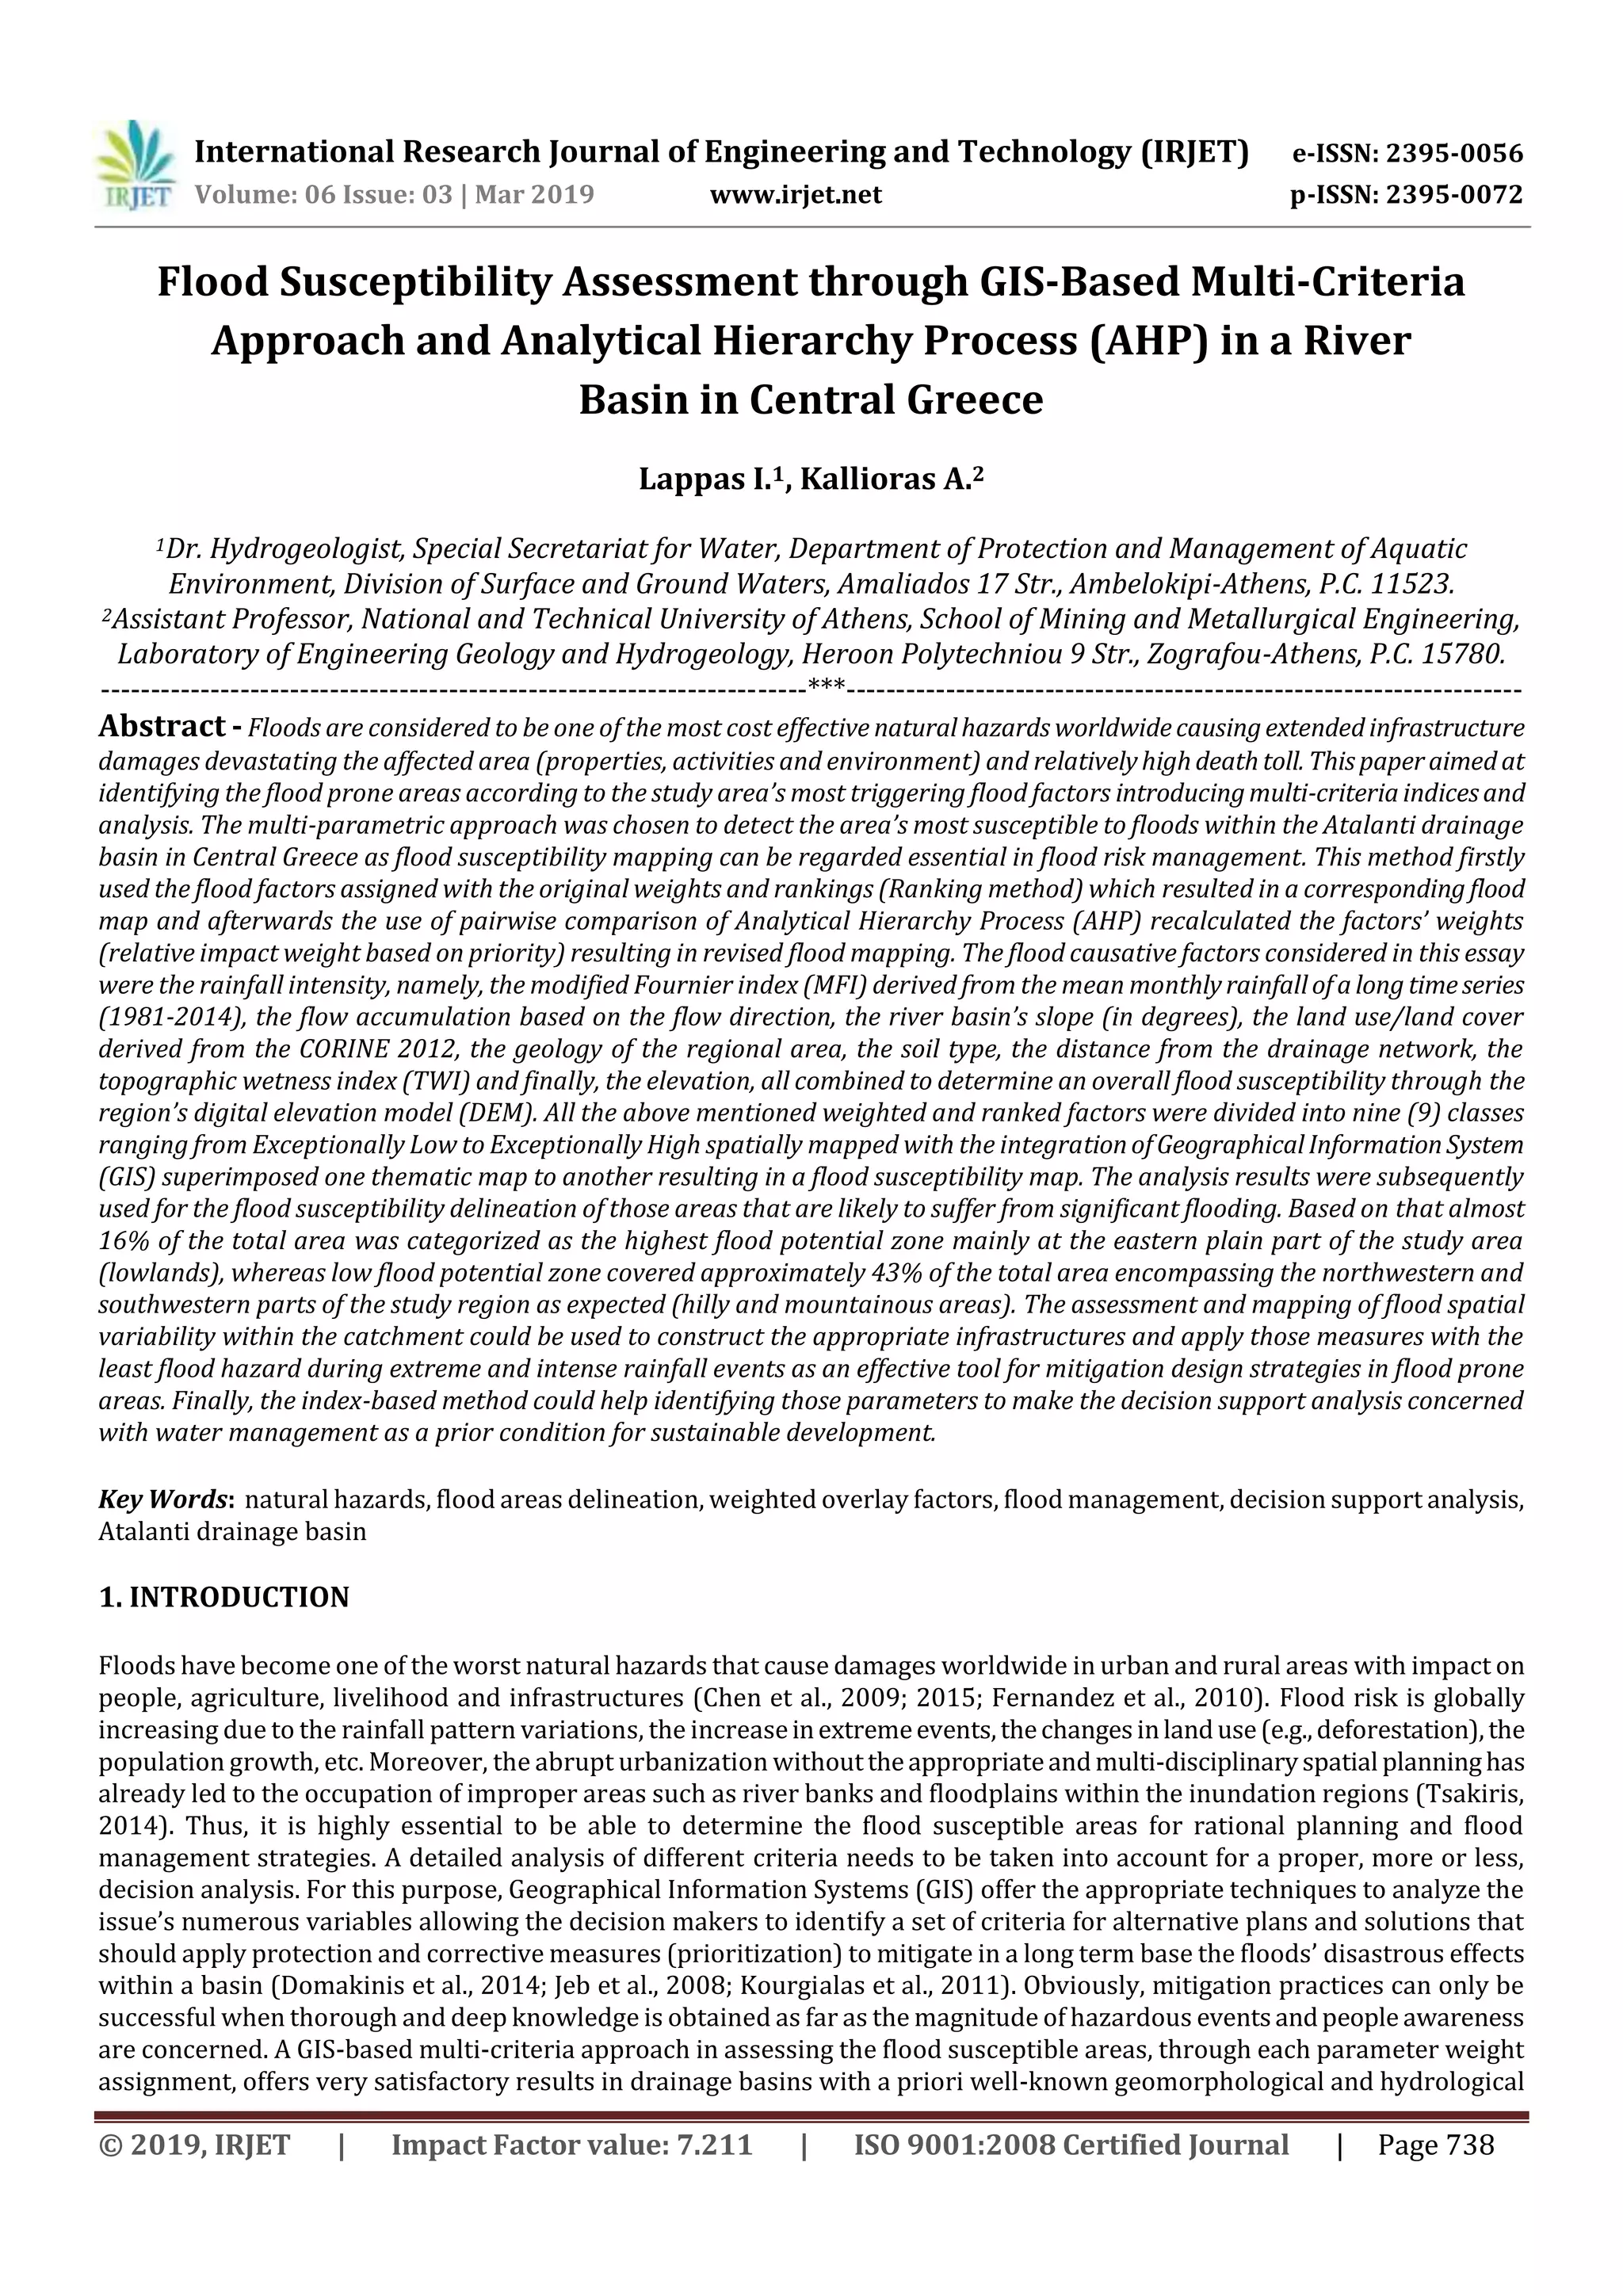
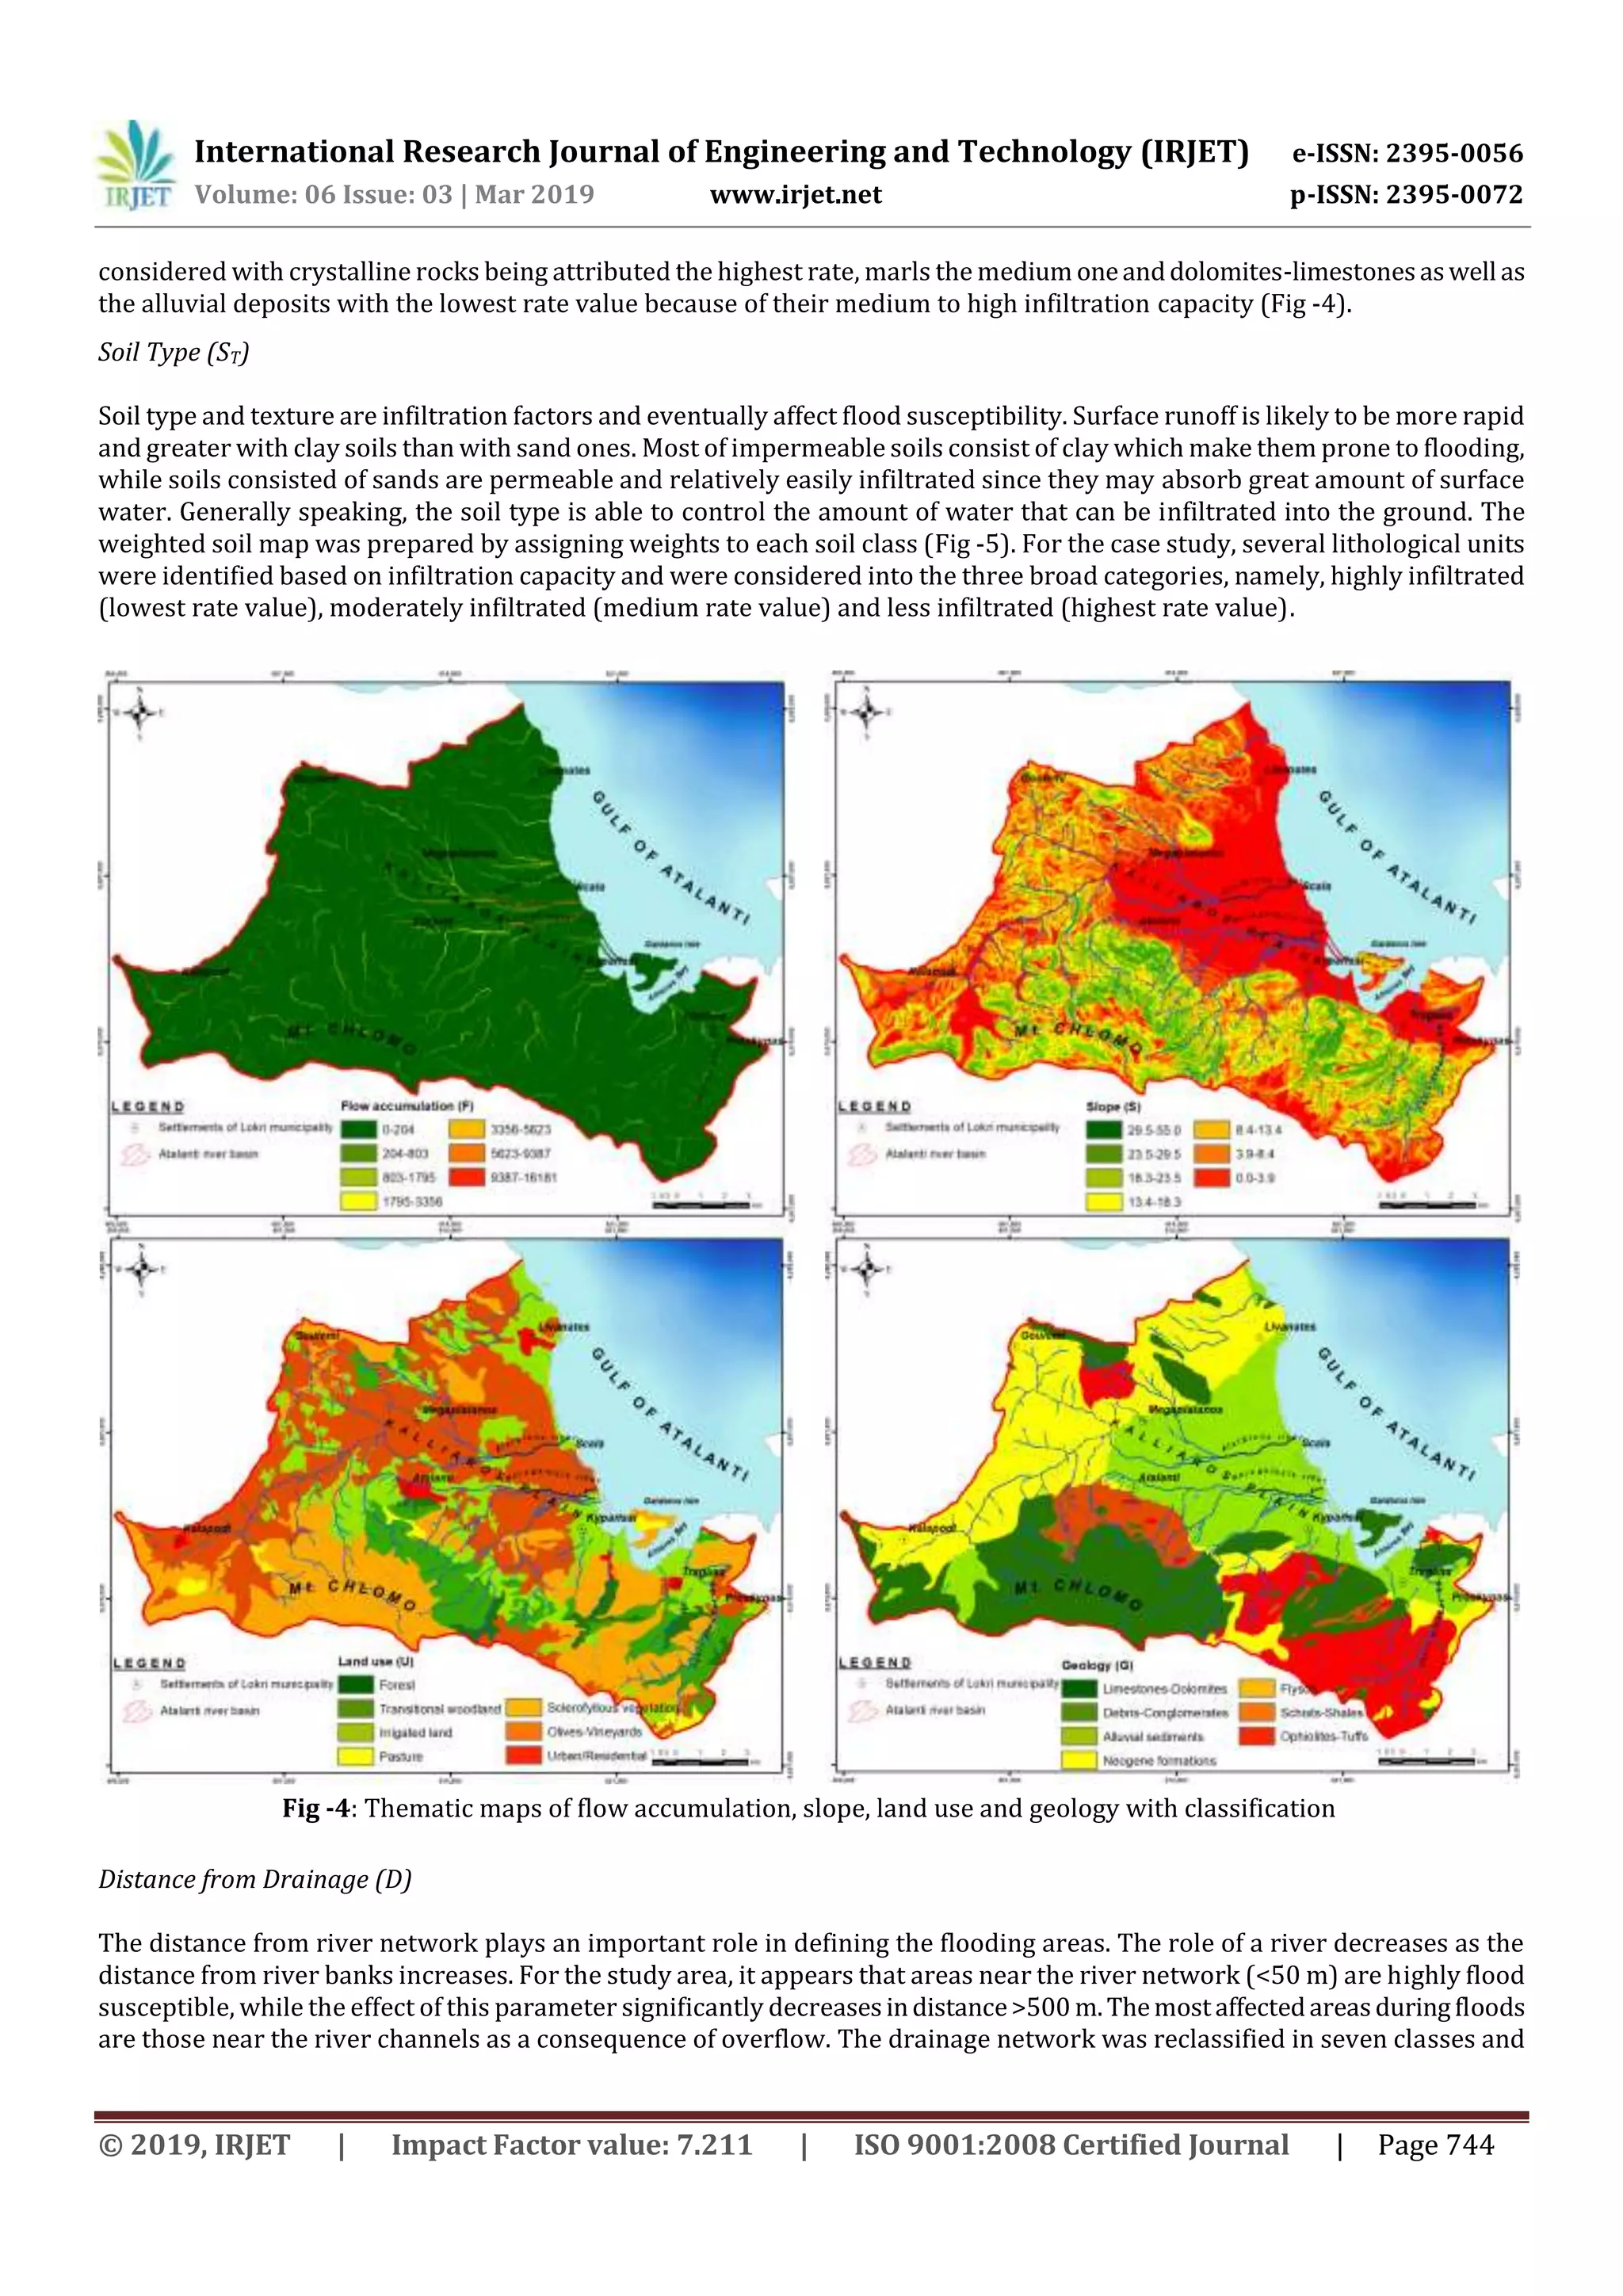
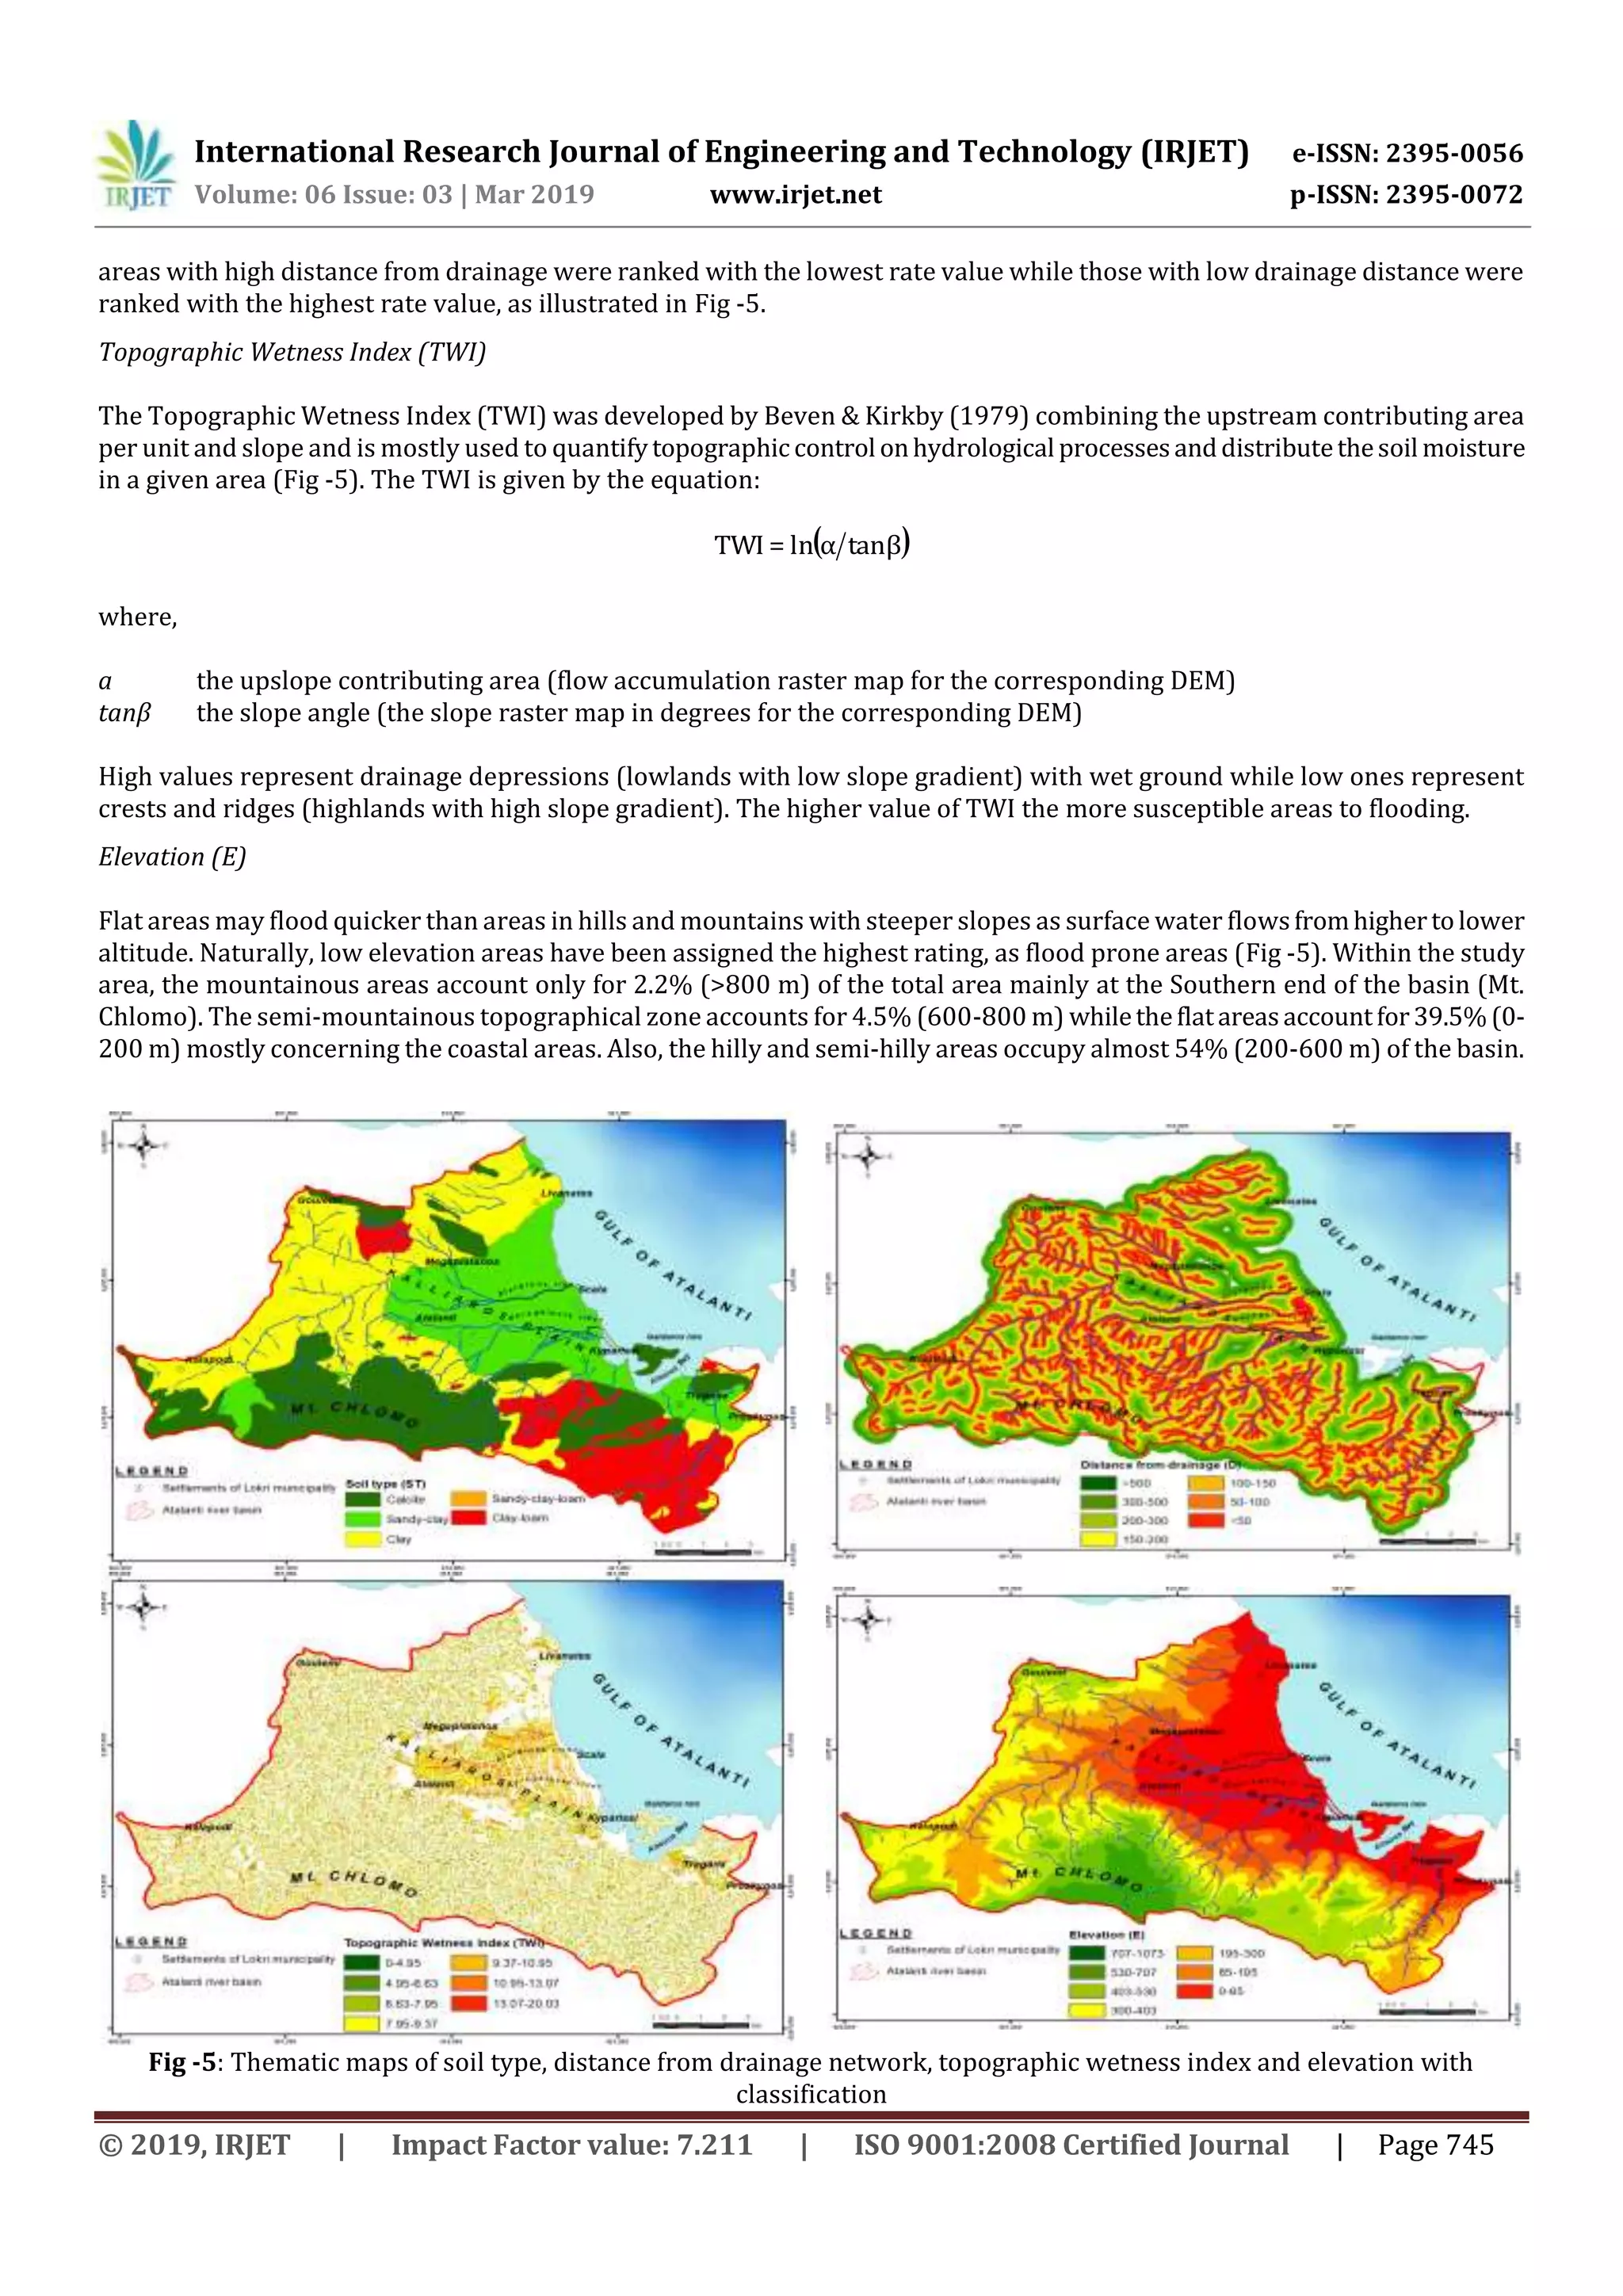
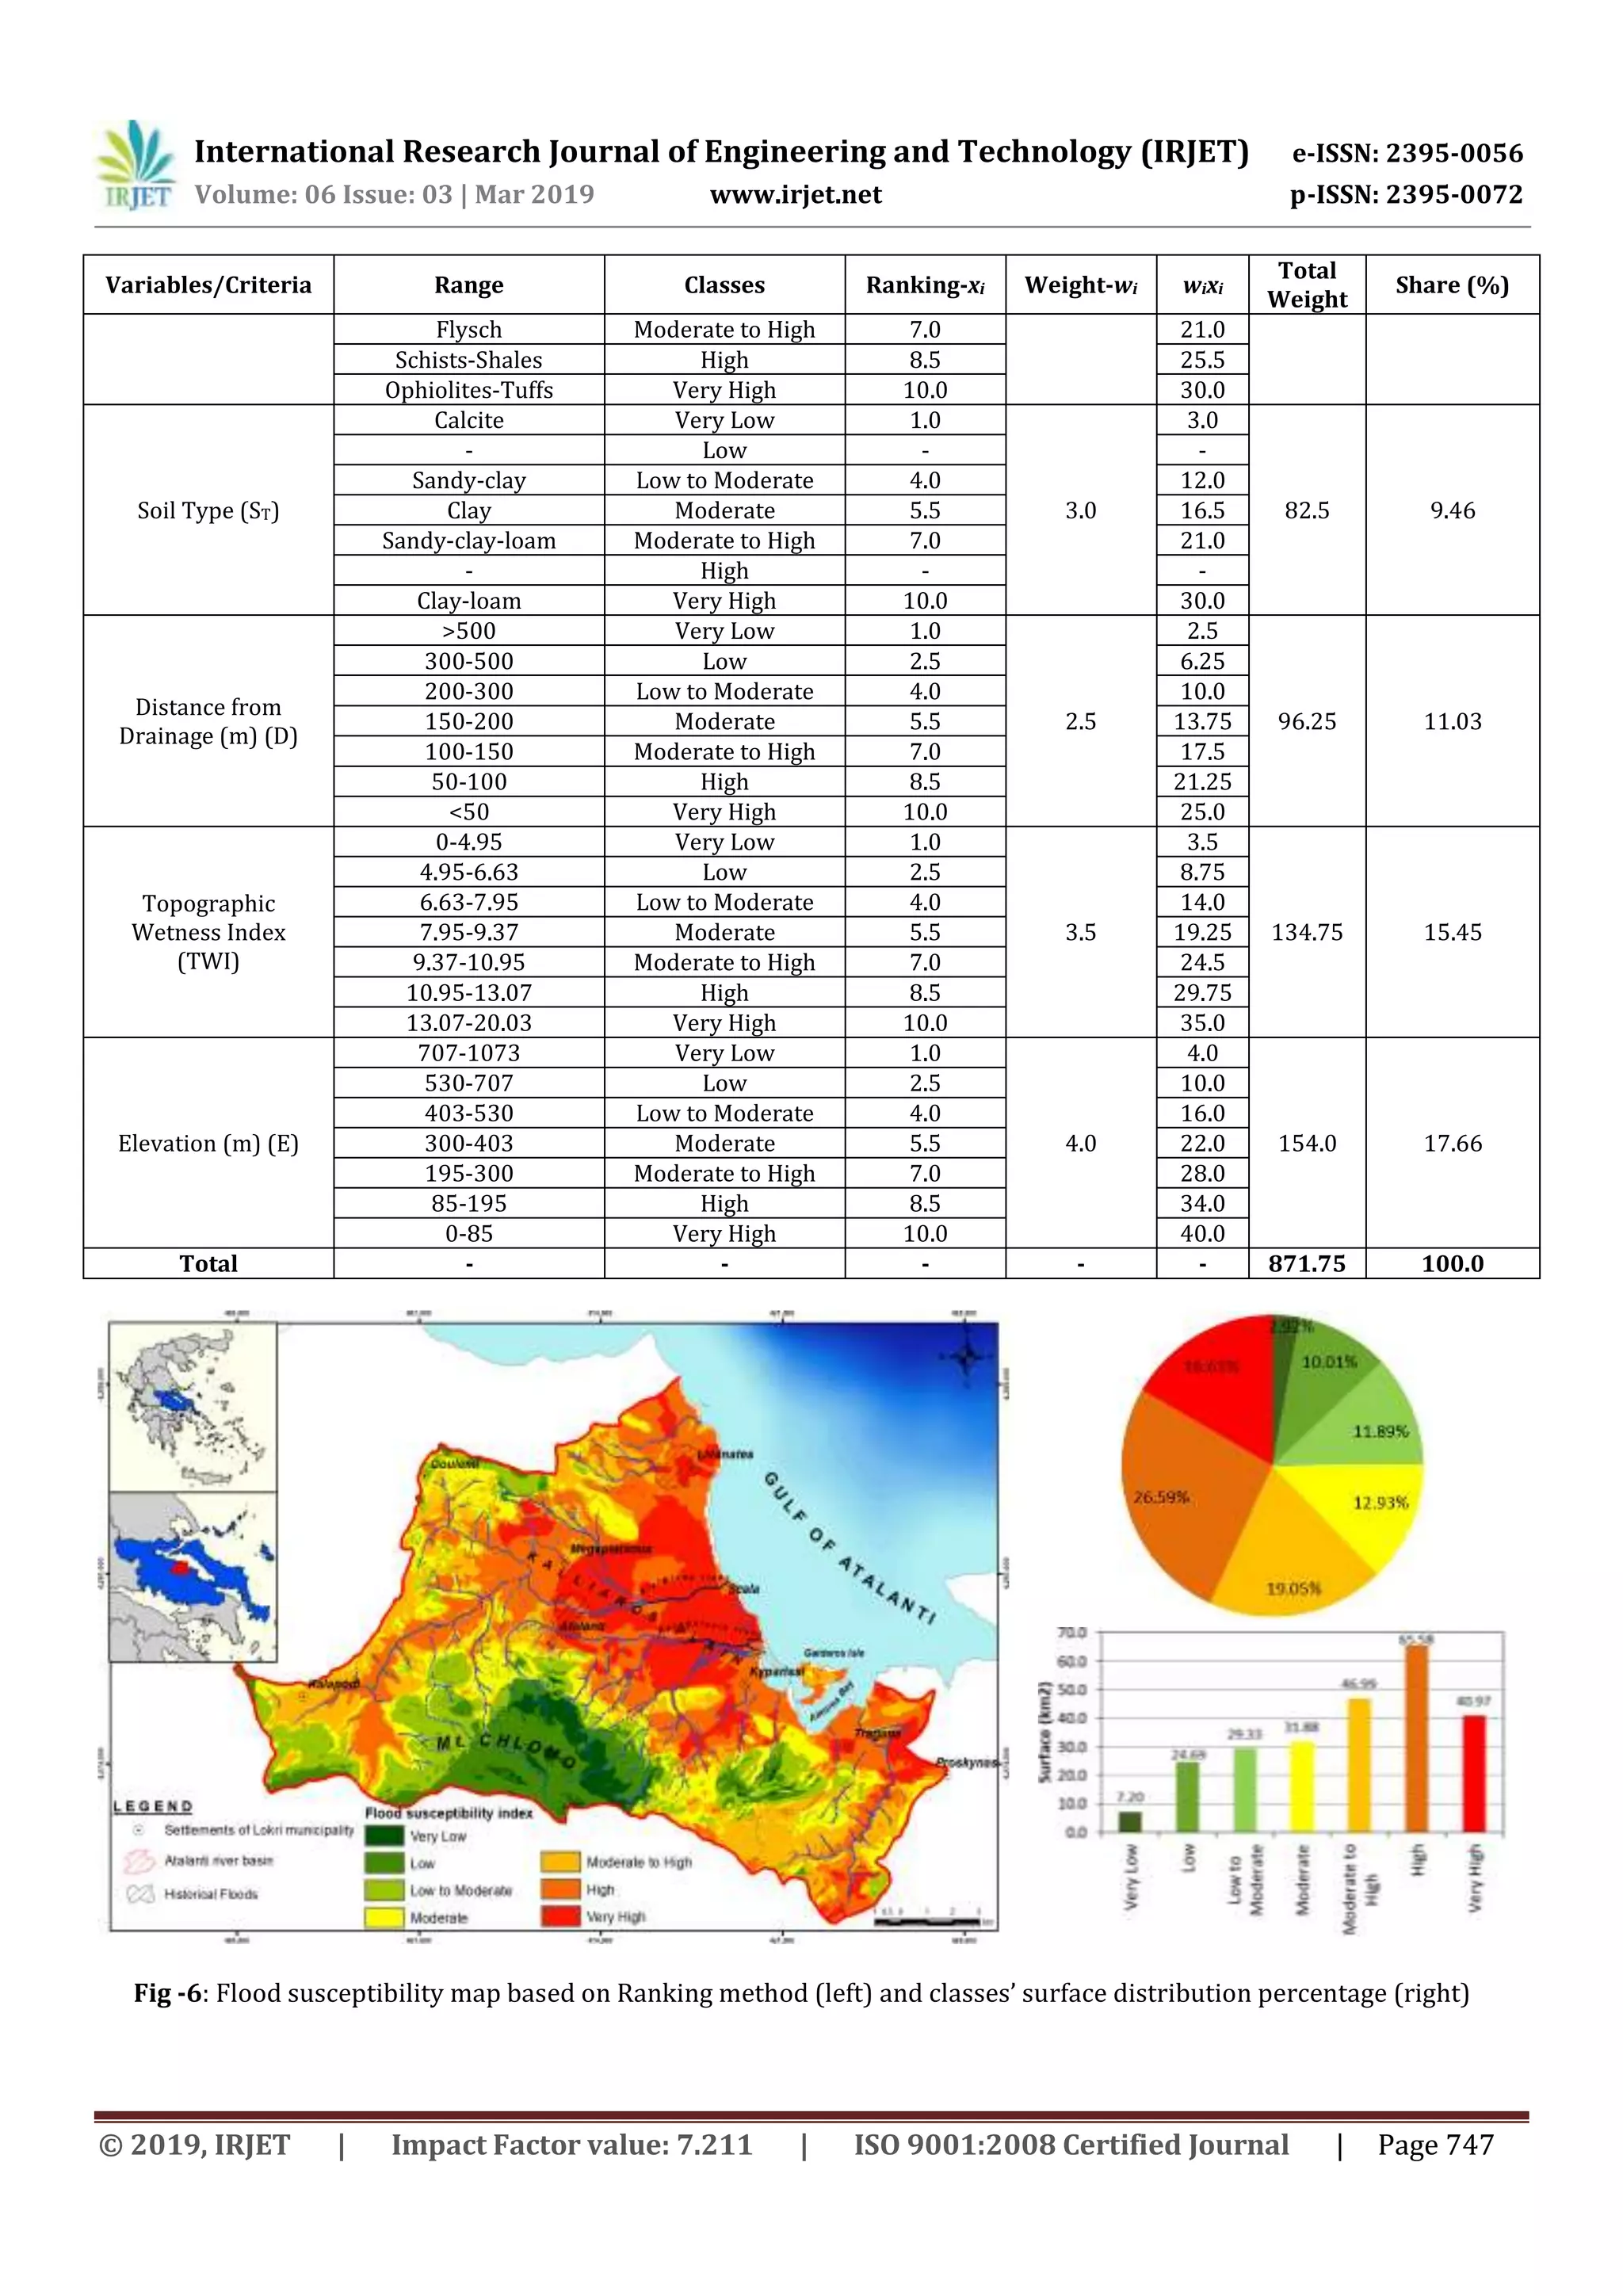
This document summarizes a study that assessed flood susceptibility in the Atalanti river basin in Central Greece using a GIS-based multi-criteria approach. The study considered various flood factors like rainfall intensity, flow accumulation, slope, land use, geology, soil type, distance from drainage network, topographic wetness index, and elevation. These factors were assigned weights using both ranking and analytical hierarchy process to produce flood susceptibility maps dividing the area into seven classes of susceptibility. The results showed that about 16% of the total area had the highest flood potential, mainly in the low-lying eastern plains, while about 43% had low flood potential in the northwestern and southwestern hilly areas as expected. The flood susceptibility mapping can
To prevent losing water resources and wetlands, and conserve existing wetlands
ecosystem for ecosystem and biodiversity services, good, wetlands habitats forstart
any sustainable development programs, it is necessary to detect, monitor and
inventory water resources and their surround uplands. Recently, AL-Razaza Lake
suffer from a critical situation because of the decreasing in the water level and
increase a salinity. We have propose a method to monitor and model the spatial and
multi-temporal changes of AL-Razaza Lake in the period 1992–2018. This study
includes pre-processing, processing and post-processing stages. In Addition, a
supervised classification was used to classify the satellite images. Validation result
reveals that the overall accuracies and kappa coefficients of the supervised
classifications were 88, 90.79, 95.94 and 87.67 respectively, and 82%, 86%, 93% and
79% respectively. The results showed that the percentage change was significant
during this period, such that the decreased surface area was from 1313.87 km2 in
1992 to 224.85 km2 in 201.The noticeable results show the rapidly decreasing in the
Lake area by 82.8% with area about 1089.02 km2 over the last three decades. All the
dehydration extended area of the Lake was replaced by soil.
Flooding is one of the most devastating natural
disasters in Nigeria. The impact of flooding on human activities
cannot be overemphasized. It can threaten human lives, their
property, environment and the economy. Different techniques
exist to manage and analyze the impact of flooding. Some of these
techniques have not been effective in management of flood
disaster. Remote sensing technique presents itself as an effective
and efficient means of managing flood disaster. In this study,
SPOT-10 image was used to perform land cover/ land use
classification of the study area. Advanced Space borne Thermal
Emission and Reflection Radiometer (ASTER) image of 2010 was
used to generate the Digital Elevation Model (DEM). The image
focal statistics were generated using the Spatial Analyst/
Neighborhood/Focal Statistics Tool in ArcMap. The contour map
was produced using the Spatial Analyst/ Surface/ Contour Tools.
The DEM generated from the focal statistics was reclassified into
different risk levels based on variation of elevation values. The
depression in the DEM was filled and used to create the flow
direction map. The flow accumulation map was produced using
the flow direction data as input image. The stream network and
watershed were equally generated and the stream vectorized. The
reclassified DEM, stream network and vectorized land cover
classes were integrated and used to analyze the impact of flood on
the classes. The result shows that 27.86% of the area studied will
be affected at very high risk flood level, 35.63% at high risk,
17.90% at moderate risk, 10.72% at low risk, and 7.89% at no
risk flood level. Built up area class will be mostly affected at very
high risk flood level while farmland will be affected at high risk
flood level. Oshoro, Imhekpeme, and Weppa communities will be
affected at very high risk flood inundation while Ivighe, Uneme,
Igoide and Iviari communities will be at risk at high risk flood
inundation level. It is recommended among others that buildings
that fall within the “Very High Risk” area should be identified
and occupants possibly relocated to other areas such as the “No
Risk” area.
Catchment classification: multivariate statistical analyses for physiographic...IJERA Editor
The objective of this study was to determine physiographic similarity, as indicator of hydrologic similarity
between catchments located in the Upper Niger Basin, and to derive the dominant factors controlling each group
singularity. We utilized a dataset of 9 catchments described by 16 physical and climatic properties distributed
across a wide region with strong environmental gradients. Catchments attributes were first standardized before
they underwent an integrated exploratory data analysis composed by Principal Component Analysis (PCA)
followed by Hierarchical Clustering. Results showed a clear distribution into 2 major clusters: a group of
easterly flat catchments and another of westerly hilly catchments. This nomenclature came from the
interpretation of the main factors, topography and longitude, that seem to control the most important variability
between both clusters. In addition, the hilly catchments were designated to be dominated by forest and
ACRISOL soil type, two additional drivers of similarity. The outcome of this study can help understanding
catchment functioning and provide a support for regionalization of hydrological information.
Runoff is one of the most significant hydrological variables used in most of the water resources applications. Physiographically the area is characterized by undulating topography with plains and valleys. The Soil Conservation Service Curve Numbers also known as hydrologic soil group method were used in this study. This method is adaptable and suitable approach for quick runoff estimation and is approximately easy to use with minimum data and it gives good result. From the study yearly rainfall and runoff were estimated easily. The study area covers an area of 466.02 km2, having maximum length of 36.5 km. The maximum and minimum elevation of the basin is 569 m and 341 m above MSL, respectively.
Streamflow simulation using radar-based precipitation applied to the Illinois...Alireza Safari
This paper describes the application of a spatially distributed hydrological model WetSpa (Water and Energy Transfer between Soil, Plants and Atmosphere) using radar-based rainfall data provide by the United States Hydrology Laboratory of NOAA's National Weather Service for a distributed model intercomparison project. The model is applied to the
river basin above Tahlequah hydrometry station with 30-m spatial resolution and one hour time--step for a total simulation period of 6 years. Rainfall inputs are derived from radar. The distributed model parameters are based on an extensive database of watershed characteristics available for the region, including digital maps of DEM, soil type, and land use. The model is calibrated and validated on part of the river flow records. The simulated hydrograph shows a good correspondence with observation (Nash efficiency coeffiecient >80%, indicating that the model is able to simulate the relevant hydrologic processes in the basin accurately.
APPLICATIONS OF REMOTE SENSING AND GIS TECHNOLOGIES IN FLOOD RISK MANAGEMENTrsmahabir
Flooding is the most common of all major disasters that regularly affect populations and results in extensive damage to property, infrastructure, natural resources, and even to loss of life. To ensure better outcomes, planning and execution of flood management projects must utilize knowledge on a wide range of factors, most of which are of a spatial nature. Advances in geospatial technologies, specifically remote sensing and Geographic Information Systems (GIS), have enabled the acquisition and analysis of data about the Earth's surface for flood mitigation projects in a faster, more efficient and more accurate manner.
Remote sensing and GIS have emerged as powerful tools to deal with various aspects of flood management in prevention, preparedness and relief management of flood disaster. GIS facilitates integration of spatial and non-spatial data such as rainfall and stream flows, river cross sections and profiles, and river basin characteristics, as well as other information such as historical flood maps, infrastructures, land use, and social and economic data. Such data sets are critical for the in-depth analysis and management of floods.
Remote sensing technologies have great potential in overcoming the information void in the Caribbean region. The observation, mapping, and representation of Earth’s surface have provided effective and timely information for monitoring floods and their effect. The potential of new air- and space-borne imaging technologies for improving hazard evaluation and risk reduction is continually being explored. They are relatively inexpensive and have the ability to provide information on several parameters that are crucial to flood mapping and monitoring.
The Development of a Catchment Management Modelling System for the Googong Re...GavanThomas
A scenario assessment model to assist the end-user in determining priorities for a series of agreed management prescriptions that can be enacted through controls on existing landuse
Data Preparation for Assessing Impact of Climate Change on Groundwater RechargeAM Publications
Climate change is a change in the statistical properties of the climate system when considered over long
periods of time. It significantly affects the various components of hydrological cycle like temperature, precipitation,
evapotranspiration and infiltration. All these components together affect the rate of groundwater recharge. So
understanding the effects of climate change on groundwater recharge is the need of time for the management of
groundwater resources. This paper presents the data preparation initiatives and a suitable methodology that can be
used to characterize the effect of climate change on groundwater recharge. The method is based on the hydrologic
model Visual HELP which can be used to estimate potential groundwater recharge at the regional scale. The success
of Modeling depends on the accuracy of data and the mode of collecting the data. Therefore, identifying the data
needs of a particular modeling study, collection/monitoring of required data and preparation of data set form an
integral part of any groundwater modeling exercise. The main objective of this paper is to describe the exact data
required and its preparation to simulate the groundwater recharge using HELP Model Software for Yavatmal as a
study area situated in Maharashtra state, India. The impact of climate change as a pilot study is modeled by using
computer software HELP (Hydrologic Evaluation of Landfill Performance). The initiatives for data preparation
presented herein may be useful to the researchers in this field.
Sea level rise and storm surge tools and datasets supporting Municipal Resili...GrowSmart Maine
Why plan for growth and change, when it seems so much easier to simply react?
When there is a distinct and shared vision for your community - when residents, businesses and local government anticipate a sustainable town with cohesive and thriving neighborhoods - you have the power to conserve your beautiful natural spaces, enhance your existing downtown or Main Street, enable rural areas to be productive and prosperous, and save money through efficient use of existing infrastructure.
This is the dollars and sense of smart growth.
Success is clearly visible in Maine, from the creation of a community-built senior housing complex and health center in Fort Fairfield to conservation easements creating Forever Farms to Rockland's revitalized downtown. Communities have options. We have the power to manage our own responses to growth and change.
After all, “Planning is a process of choosing among those many options. If we do not choose to plan, then we choose to have others plan for us.” - Richard I. Winwood
And in the end, this means that our children and their children will choose to make Maine home and our economy will provide the opportunities to do so.
The Summit offers you a wonderful opportunity to be a part of the transformative change in Maine that we’ve seen these gatherings produce. We encourage you to consider the value of being actively involved in growing Maine’s economy and protecting the reasons we choose to live here.
Since the recent development of UAVs(Unmanned Aerial Vehicles) and digital sensors technology has enabled the acquisition of high-resolution image data, it is considered that the image data of riverside can be analysed. Therefore, this study analyses the applicability of remote sensing techniques through image analysis in river systems and habitats. The target stream in this study was the Cheongmi stream and the applicability of the river environmental evaluation technique was analysed through image analysis. The satellite images used for the analysis of river topography and environments were compared with the aerial images taken by a micro UAV), and the river environmental evaluation was carried out with the field research at the same time. The data acquisition range and application limit by river environmental evaluation technique proposed previously were evaluated, and as a result, it was found that it was possible to draw various evaluation parameters using a drone that could take an image at a low altitude in comparison to satellite images.
Quantitative evaluation and analysis of morphometric parameters derived from ...AM Publications
GIS has become a key source to understand the hydrological conditions of watersheds for the last few decades. Arc Hydro tool of ArcGIS has been proven its role in the automated extraction of drainage network and morphometric analysis from DEMs. The delineation of drainage network can be done either manually from topographic sheets or derived from Digital Elevation Model (DEM) data by means of computational methods. In the present work, ASTER DEM has been incurred to extract drainage network with the aid of Arc hydro tool. The Vaishali River basin of Madhya Pradesh has been taken as the study area. This study has been done primarily based on a geo-spatial software ARC GIS in which ARC HYDRO a tool has been used extensively. The quantitative evaluation and analysis of about twenty morphometric parameters has been done based on the linear, areal and relief aspects. The analysis has revealed that the Vaishali River basin is a fifth order basin showing dendritic drainage pattern with drainage density of 0.40 per km and stream frequency of 0.08 per km2. Low drainage density indicates the basin has not been much affected by structural disturbances while drainage frequency and very coarse drainage texture specifies low relief and porous, permeable rocks beneath the ground surface. The form factor, circularity ratio and elongated ratio suggest the basin shape as elongated. The area has low to moderate relief and slopes displays moderate relief ratios. It is concluded that this technique is not only reduces time but also provides valuable results which are very helpful for watershed management studies.
Forecasting Model of Flood Inundated Areas along Sharda River in U.P.iosrjce
Paper has illuminated the satellite data of previous flood and hydrological data to estimate the
inundated areas near Sharda River. Modeling of flood inundated areas predicted 10 cm rises in water level in
affected areas by flood. IRS-P6/AWiFS and RADARSAT data were used. The RADARSAT satellite data have
shown the flood water, water in low lying areas and real time flood data. The geo referenced IRS-P6/AWiFS,
IRS-P6/LISS-III and PAN satellite data were useful for preparation of various thematic maps. Results revealed
that most heavily flood affected villages at three gauge stations on Sharda River during year 2009 were: 13
villages of Puranpur Block of Pilibhit District downstream to Banbasa gauge station at 220.35m water level; 22
villages of Nighasan Block of Lakhimpur-khiri District downstream to Paliyakala gauge station at 154.62m
water level and 26 villages of Behta Block of Sitapur District downstream to Sharda Nagar gauge station at
136.10m water level.
Land sutability for establishing rainswater harvesting systems for fighting w...José María
México, al igual que otros países, se ha visto impactado por la creciente ocurrencia de incendios forestales; así, entre otras acciones, se lleva a cabo el control aéreo de incendios mediante helicópteros, actividad que se ve limitada por la falta de agua. En este sentido, los sistemas de captación de agua de lluvia (SCALL) pueden solucionar este problema.En el presente estudio, se realizó un análisis de aptitud territorial en un SIG para establecer SCALL en el oriente del estado de México.Se eligieron cinco variables para determinar la ubicación de SCALL: velocidad de ráfaga, evaporación, distancia a caminos, escurrimiento superficial y densidad de incendios; las cuales se representaron geográficamente mediante el inverso de la distancia ponderada para las dos primeras; distancia euclidiana, Curvas Numéricas y módulo de Point Density, para las tres últimas, respectivamente.Se utilizó la metodología de clasificación para estimar los pesos de las variables y la combinación lineal ponderada para generar el mapa de aptitud.Se identificaron dos áreas con aptitudes máximas, al noreste de Ixtapaluca y al sur de Tlalmanalco. El mapa de aptitud mostró relaciones positivas en la zona norte con las variables densidad de incendios, escurrimiento y evaporación; mientras que en la zona sur, con las variables escurrimiento, evaporación y velocidad de ráfaga. La aptitud identificada definió las mejores áreas para establecer SCALL destinados al control aéreo de incendios forestales, lo que permitirá un control oportuno; así, a fin de que existan incentivos económicos para construirlos, la propuesta deberá integrarse al marco de la política forestal.
Floodplain Modelling Materials and MethodologyIDES Editor
A floodplain is the normally dry land area adjoining
river or stream that is inundated during flood events. The
most common reason for flooding could be overtopping of river
or stream due to heavy downfall. The floodplain carries flow
in excess of the river or stream capacity. Flood frequency and
flood water-surface elevations are the crucial components for
the evaluation of flood hazard. This paper presents the
methodology that incorporates advanced technologies for
hydrologic and hydraulic analyses that are needed to be carried
out to predict the flood water-surface elevations for any
ungaged watershed.
Streamflow simulation using radar-based precipitation applied to the Illinois...Alireza Safari
This paper describes the application of a spatially distributed hydrological model WetSpa (Water and Energy Transfer between Soil, Plants and Atmosphere) using radar-based rainfall data provide by the United States Hydrology Laboratory of NOAA's National Weather Service for a distributed model intercomparison project. The model is applied to the
river basin above Tahlequah hydrometry station with 30-m spatial resolution and one hour time--step for a total simulation period of 6 years. Rainfall inputs are derived from radar. The distributed model parameters are based on an extensive database of watershed characteristics available for the region, including digital maps of DEM, soil type, and land use. The model is calibrated and validated on part of the river flow records. The simulated hydrograph shows a good correspondence with observation (Nash efficiency coeffiecient >80%, indicating that the model is able to simulate the relevant hydrologic processes in the basin accurately.
APPLICATIONS OF REMOTE SENSING AND GIS TECHNOLOGIES IN FLOOD RISK MANAGEMENTrsmahabir
Flooding is the most common of all major disasters that regularly affect populations and results in extensive damage to property, infrastructure, natural resources, and even to loss of life. To ensure better outcomes, planning and execution of flood management projects must utilize knowledge on a wide range of factors, most of which are of a spatial nature. Advances in geospatial technologies, specifically remote sensing and Geographic Information Systems (GIS), have enabled the acquisition and analysis of data about the Earth's surface for flood mitigation projects in a faster, more efficient and more accurate manner.
Remote sensing and GIS have emerged as powerful tools to deal with various aspects of flood management in prevention, preparedness and relief management of flood disaster. GIS facilitates integration of spatial and non-spatial data such as rainfall and stream flows, river cross sections and profiles, and river basin characteristics, as well as other information such as historical flood maps, infrastructures, land use, and social and economic data. Such data sets are critical for the in-depth analysis and management of floods.
Remote sensing technologies have great potential in overcoming the information void in the Caribbean region. The observation, mapping, and representation of Earth’s surface have provided effective and timely information for monitoring floods and their effect. The potential of new air- and space-borne imaging technologies for improving hazard evaluation and risk reduction is continually being explored. They are relatively inexpensive and have the ability to provide information on several parameters that are crucial to flood mapping and monitoring.
The Development of a Catchment Management Modelling System for the Googong Re...GavanThomas
A scenario assessment model to assist the end-user in determining priorities for a series of agreed management prescriptions that can be enacted through controls on existing landuse
Data Preparation for Assessing Impact of Climate Change on Groundwater RechargeAM Publications
Climate change is a change in the statistical properties of the climate system when considered over long
periods of time. It significantly affects the various components of hydrological cycle like temperature, precipitation,
evapotranspiration and infiltration. All these components together affect the rate of groundwater recharge. So
understanding the effects of climate change on groundwater recharge is the need of time for the management of
groundwater resources. This paper presents the data preparation initiatives and a suitable methodology that can be
used to characterize the effect of climate change on groundwater recharge. The method is based on the hydrologic
model Visual HELP which can be used to estimate potential groundwater recharge at the regional scale. The success
of Modeling depends on the accuracy of data and the mode of collecting the data. Therefore, identifying the data
needs of a particular modeling study, collection/monitoring of required data and preparation of data set form an
integral part of any groundwater modeling exercise. The main objective of this paper is to describe the exact data
required and its preparation to simulate the groundwater recharge using HELP Model Software for Yavatmal as a
study area situated in Maharashtra state, India. The impact of climate change as a pilot study is modeled by using
computer software HELP (Hydrologic Evaluation of Landfill Performance). The initiatives for data preparation
presented herein may be useful to the researchers in this field.
Sea level rise and storm surge tools and datasets supporting Municipal Resili...GrowSmart Maine
Why plan for growth and change, when it seems so much easier to simply react?
When there is a distinct and shared vision for your community - when residents, businesses and local government anticipate a sustainable town with cohesive and thriving neighborhoods - you have the power to conserve your beautiful natural spaces, enhance your existing downtown or Main Street, enable rural areas to be productive and prosperous, and save money through efficient use of existing infrastructure.
This is the dollars and sense of smart growth.
Success is clearly visible in Maine, from the creation of a community-built senior housing complex and health center in Fort Fairfield to conservation easements creating Forever Farms to Rockland's revitalized downtown. Communities have options. We have the power to manage our own responses to growth and change.
After all, “Planning is a process of choosing among those many options. If we do not choose to plan, then we choose to have others plan for us.” - Richard I. Winwood
And in the end, this means that our children and their children will choose to make Maine home and our economy will provide the opportunities to do so.
The Summit offers you a wonderful opportunity to be a part of the transformative change in Maine that we’ve seen these gatherings produce. We encourage you to consider the value of being actively involved in growing Maine’s economy and protecting the reasons we choose to live here.
Since the recent development of UAVs(Unmanned Aerial Vehicles) and digital sensors technology has enabled the acquisition of high-resolution image data, it is considered that the image data of riverside can be analysed. Therefore, this study analyses the applicability of remote sensing techniques through image analysis in river systems and habitats. The target stream in this study was the Cheongmi stream and the applicability of the river environmental evaluation technique was analysed through image analysis. The satellite images used for the analysis of river topography and environments were compared with the aerial images taken by a micro UAV), and the river environmental evaluation was carried out with the field research at the same time. The data acquisition range and application limit by river environmental evaluation technique proposed previously were evaluated, and as a result, it was found that it was possible to draw various evaluation parameters using a drone that could take an image at a low altitude in comparison to satellite images.
Quantitative evaluation and analysis of morphometric parameters derived from ...AM Publications
GIS has become a key source to understand the hydrological conditions of watersheds for the last few decades. Arc Hydro tool of ArcGIS has been proven its role in the automated extraction of drainage network and morphometric analysis from DEMs. The delineation of drainage network can be done either manually from topographic sheets or derived from Digital Elevation Model (DEM) data by means of computational methods. In the present work, ASTER DEM has been incurred to extract drainage network with the aid of Arc hydro tool. The Vaishali River basin of Madhya Pradesh has been taken as the study area. This study has been done primarily based on a geo-spatial software ARC GIS in which ARC HYDRO a tool has been used extensively. The quantitative evaluation and analysis of about twenty morphometric parameters has been done based on the linear, areal and relief aspects. The analysis has revealed that the Vaishali River basin is a fifth order basin showing dendritic drainage pattern with drainage density of 0.40 per km and stream frequency of 0.08 per km2. Low drainage density indicates the basin has not been much affected by structural disturbances while drainage frequency and very coarse drainage texture specifies low relief and porous, permeable rocks beneath the ground surface. The form factor, circularity ratio and elongated ratio suggest the basin shape as elongated. The area has low to moderate relief and slopes displays moderate relief ratios. It is concluded that this technique is not only reduces time but also provides valuable results which are very helpful for watershed management studies.
Forecasting Model of Flood Inundated Areas along Sharda River in U.P.iosrjce
Paper has illuminated the satellite data of previous flood and hydrological data to estimate the
inundated areas near Sharda River. Modeling of flood inundated areas predicted 10 cm rises in water level in
affected areas by flood. IRS-P6/AWiFS and RADARSAT data were used. The RADARSAT satellite data have
shown the flood water, water in low lying areas and real time flood data. The geo referenced IRS-P6/AWiFS,
IRS-P6/LISS-III and PAN satellite data were useful for preparation of various thematic maps. Results revealed
that most heavily flood affected villages at three gauge stations on Sharda River during year 2009 were: 13
villages of Puranpur Block of Pilibhit District downstream to Banbasa gauge station at 220.35m water level; 22
villages of Nighasan Block of Lakhimpur-khiri District downstream to Paliyakala gauge station at 154.62m
water level and 26 villages of Behta Block of Sitapur District downstream to Sharda Nagar gauge station at
136.10m water level.
Land sutability for establishing rainswater harvesting systems for fighting w...José María
México, al igual que otros países, se ha visto impactado por la creciente ocurrencia de incendios forestales; así, entre otras acciones, se lleva a cabo el control aéreo de incendios mediante helicópteros, actividad que se ve limitada por la falta de agua. En este sentido, los sistemas de captación de agua de lluvia (SCALL) pueden solucionar este problema.En el presente estudio, se realizó un análisis de aptitud territorial en un SIG para establecer SCALL en el oriente del estado de México.Se eligieron cinco variables para determinar la ubicación de SCALL: velocidad de ráfaga, evaporación, distancia a caminos, escurrimiento superficial y densidad de incendios; las cuales se representaron geográficamente mediante el inverso de la distancia ponderada para las dos primeras; distancia euclidiana, Curvas Numéricas y módulo de Point Density, para las tres últimas, respectivamente.Se utilizó la metodología de clasificación para estimar los pesos de las variables y la combinación lineal ponderada para generar el mapa de aptitud.Se identificaron dos áreas con aptitudes máximas, al noreste de Ixtapaluca y al sur de Tlalmanalco. El mapa de aptitud mostró relaciones positivas en la zona norte con las variables densidad de incendios, escurrimiento y evaporación; mientras que en la zona sur, con las variables escurrimiento, evaporación y velocidad de ráfaga. La aptitud identificada definió las mejores áreas para establecer SCALL destinados al control aéreo de incendios forestales, lo que permitirá un control oportuno; así, a fin de que existan incentivos económicos para construirlos, la propuesta deberá integrarse al marco de la política forestal.
Similar to IRJET- Flood Susceptibility Assessment through GIS-Based Multi-Criteria Approach and Analytical Hierarchy Process (AHP) in a River Basin in Central Greece
Floodplain Modelling Materials and MethodologyIDES Editor
A floodplain is the normally dry land area adjoining
river or stream that is inundated during flood events. The
most common reason for flooding could be overtopping of river
or stream due to heavy downfall. The floodplain carries flow
in excess of the river or stream capacity. Flood frequency and
flood water-surface elevations are the crucial components for
the evaluation of flood hazard. This paper presents the
methodology that incorporates advanced technologies for
hydrologic and hydraulic analyses that are needed to be carried
out to predict the flood water-surface elevations for any
ungaged watershed.
Flood is one of the natural disaster known to be part of the earth biophysical processes, which its occurrence can be devastating; due to mostly anthropogenic activities and climatological factors. The aim of the research is to identify and map the extent at which the impact of flood due to intense rainfall and rise in water in the study area using geospatial techniques and the specific objectives are to carry out terrain analysis of the study area and to generate flood indicator maps of the study area. The study analyzed rain fall data;, the drainage system and Shuttle Radar Topographic Mission (SRTM 30m) of the area. ArcGIS 10.8 was to modelled and to generate the contributing factors map of the study area. The drainage system was generated through on-screen digitization of topographic map of scale 1:50,000 of Ondo South-West. The mean annual rainfall of Lagos State was generated in the ArcGIS environment from the rainfall data through spatial analysis tool. The SRTM was used in terrain analysis of the study area. The results generated showed the lowest mean annual rain fall of the area 1,700mm and the highest mean annual rain fall was 2,440mm. Digital elevation model (DEM), slope, flow direction were generated from the SRTM. Drainage density of the area was generated using the drainage system. The slope map of the entire area which are classified into five slope classes of very high (14%-48.5%) to high (7.6%-13.9%) to moderately high (4.2%-7.6%) to low (1.5%-4.2%) and very low (0. % - 1.2%).
DEM-based Methods for Flood Risk Mapping at Large ScaleSalvatore Manfreda
Oral presentation given during the meeting "Valutazione e Gestione del Rischio Alluvioni – Governance del territorio e contributo del mondo scientifico" of the project "Mettiamoci in Riga"
A Model of (P-GIS) for Hydraulic Protection Dams in Northern Moroccoijait
ACT To strengthen the quality of information, inclusion and implementation of continuous link between different categories of actors by mobilizing P-GIS as tools for participation and methodological aid to decision-making, and help to better understanding of environmental issues and challenges related to climate change, allowing regional authorities to better analyze and process. So what we've seen, that the conventional GIS does not include certain information such as social exclusion, displacement, narrative conflicts of use of land and water, cultural stories, local politics. Hence the need to find an effective method to circumvent these problems.
A MODEL OF (P-GIS) FOR HYDRAULIC PROTECTION DAMS IN NORTHERN MOROCCOijait
To strengthen the quality of information, inclusion and implementation of continuous link between different categories of actors by mobilizing P-GIS as tools for participation and methodological aid to decision-making, and help to better understanding of environmental issues and challenges related
to climate change, allowing regional authorities to better analyze and process. So what we've seen, that the conventional GIS does not include certain information such as social exclusion, displacement, narrative conflicts of use of land and water, cultural stories, local politics. Hence the need to find an effective method to circumvent these problems.
So this study is based on a software solution that is supported on the geographic information system (GIS) coupled with the participatory model to give the (P-GIS). By manipulating various GIS software el descriptive data collected directly from the study area of the dam Ibn Battouta. A Data Type Model was generated to model the flow of data and related information. The delineation of protection zones will then contribute to the superposition, by adding each of the identified factors. The result of this study has created a multi-source spatial data management. This produces what is appalled the demonstration model GIS-remote sensing.'' It is based on certain factors that use parameters observed in the field and the information collected from censuses.
Hydrological Risk Assessment at Praia, Cape VerdeIJEAB
Hydrology modeling became a relevant topic for the Cidade da Praia, Cabo Verde, Africa, due to negative impact risk to local population and its assets. The modeling via Geographical Information Systems (GIS) can help the decision-making process of space occupation and characterization for this type of risk. Under the municipalities of Praia, the phenomenon of flash flood is common, causing soil erosion and landslide. This constitutes a risk for the local habitat, particularly in districts with a lack of strong human infrastructures. To simulate, analyze and generate risk maps using GIS to help this county governance authorities for decision-making, thus, becomes the main aim of this article.
A GIS for Flood Risk Management in Flander.docxhome
A GIS for Flood Risk Management in Flander
This chapter presents a concise overview of LATIS' methodology and its implementation for flood risk management in. Flanders.
Similar to IRJET- Flood Susceptibility Assessment through GIS-Based Multi-Criteria Approach and Analytical Hierarchy Process (AHP) in a River Basin in Central Greece (20)
Explore the innovative world of trenchless pipe repair with our comprehensive guide, "The Benefits and Techniques of Trenchless Pipe Repair." This document delves into the modern methods of repairing underground pipes without the need for extensive excavation, highlighting the numerous advantages and the latest techniques used in the industry.
Learn about the cost savings, reduced environmental impact, and minimal disruption associated with trenchless technology. Discover detailed explanations of popular techniques such as pipe bursting, cured-in-place pipe (CIPP) lining, and directional drilling. Understand how these methods can be applied to various types of infrastructure, from residential plumbing to large-scale municipal systems.
Ideal for homeowners, contractors, engineers, and anyone interested in modern plumbing solutions, this guide provides valuable insights into why trenchless pipe repair is becoming the preferred choice for pipe rehabilitation. Stay informed about the latest advancements and best practices in the field.
Sachpazis:Terzaghi Bearing Capacity Estimation in simple terms with Calculati...Dr.Costas Sachpazis
Terzaghi's soil bearing capacity theory, developed by Karl Terzaghi, is a fundamental principle in geotechnical engineering used to determine the bearing capacity of shallow foundations. This theory provides a method to calculate the ultimate bearing capacity of soil, which is the maximum load per unit area that the soil can support without undergoing shear failure. The Calculation HTML Code included.
Event Management System Vb Net Project Report.pdfKamal Acharya
In present era, the scopes of information technology growing with a very fast .We do not see any are untouched from this industry. The scope of information technology has become wider includes: Business and industry. Household Business, Communication, Education, Entertainment, Science, Medicine, Engineering, Distance Learning, Weather Forecasting. Carrier Searching and so on.
My project named “Event Management System” is software that store and maintained all events coordinated in college. It also helpful to print related reports. My project will help to record the events coordinated by faculties with their Name, Event subject, date & details in an efficient & effective ways.
In my system we have to make a system by which a user can record all events coordinated by a particular faculty. In our proposed system some more featured are added which differs it from the existing system such as security.
Courier management system project report.pdfKamal Acharya
It is now-a-days very important for the people to send or receive articles like imported furniture, electronic items, gifts, business goods and the like. People depend vastly on different transport systems which mostly use the manual way of receiving and delivering the articles. There is no way to track the articles till they are received and there is no way to let the customer know what happened in transit, once he booked some articles. In such a situation, we need a system which completely computerizes the cargo activities including time to time tracking of the articles sent. This need is fulfilled by Courier Management System software which is online software for the cargo management people that enables them to receive the goods from a source and send them to a required destination and track their status from time to time.
CFD Simulation of By-pass Flow in a HRSG module by R&R Consult.pptxR&R Consult
CFD analysis is incredibly effective at solving mysteries and improving the performance of complex systems!
Here's a great example: At a large natural gas-fired power plant, where they use waste heat to generate steam and energy, they were puzzled that their boiler wasn't producing as much steam as expected.
R&R and Tetra Engineering Group Inc. were asked to solve the issue with reduced steam production.
An inspection had shown that a significant amount of hot flue gas was bypassing the boiler tubes, where the heat was supposed to be transferred.
R&R Consult conducted a CFD analysis, which revealed that 6.3% of the flue gas was bypassing the boiler tubes without transferring heat. The analysis also showed that the flue gas was instead being directed along the sides of the boiler and between the modules that were supposed to capture the heat. This was the cause of the reduced performance.
Based on our results, Tetra Engineering installed covering plates to reduce the bypass flow. This improved the boiler's performance and increased electricity production.
It is always satisfying when we can help solve complex challenges like this. Do your systems also need a check-up or optimization? Give us a call!
Work done in cooperation with James Malloy and David Moelling from Tetra Engineering.
More examples of our work https://www.r-r-consult.dk/en/cases-en/
Forklift Classes Overview by Intella PartsIntella Parts
Discover the different forklift classes and their specific applications. Learn how to choose the right forklift for your needs to ensure safety, efficiency, and compliance in your operations.
For more technical information, visit our website https://intellaparts.com
Overview of the fundamental roles in Hydropower generation and the components involved in wider Electrical Engineering.
This paper presents the design and construction of hydroelectric dams from the hydrologist’s survey of the valley before construction, all aspects and involved disciplines, fluid dynamics, structural engineering, generation and mains frequency regulation to the very transmission of power through the network in the United Kingdom.
Author: Robbie Edward Sayers
Collaborators and co editors: Charlie Sims and Connor Healey.
(C) 2024 Robbie E. Sayers
Democratizing Fuzzing at Scale by Abhishek Aryaabh.arya
Presented at NUS: Fuzzing and Software Security Summer School 2024
This keynote talks about the democratization of fuzzing at scale, highlighting the collaboration between open source communities, academia, and industry to advance the field of fuzzing. It delves into the history of fuzzing, the development of scalable fuzzing platforms, and the empowerment of community-driven research. The talk will further discuss recent advancements leveraging AI/ML and offer insights into the future evolution of the fuzzing landscape.
Hybrid optimization of pumped hydro system and solar- Engr. Abdul-Azeez.pdffxintegritypublishin
Advancements in technology unveil a myriad of electrical and electronic breakthroughs geared towards efficiently harnessing limited resources to meet human energy demands. The optimization of hybrid solar PV panels and pumped hydro energy supply systems plays a pivotal role in utilizing natural resources effectively. This initiative not only benefits humanity but also fosters environmental sustainability. The study investigated the design optimization of these hybrid systems, focusing on understanding solar radiation patterns, identifying geographical influences on solar radiation, formulating a mathematical model for system optimization, and determining the optimal configuration of PV panels and pumped hydro storage. Through a comparative analysis approach and eight weeks of data collection, the study addressed key research questions related to solar radiation patterns and optimal system design. The findings highlighted regions with heightened solar radiation levels, showcasing substantial potential for power generation and emphasizing the system's efficiency. Optimizing system design significantly boosted power generation, promoted renewable energy utilization, and enhanced energy storage capacity. The study underscored the benefits of optimizing hybrid solar PV panels and pumped hydro energy supply systems for sustainable energy usage. Optimizing the design of solar PV panels and pumped hydro energy supply systems as examined across diverse climatic conditions in a developing country, not only enhances power generation but also improves the integration of renewable energy sources and boosts energy storage capacities, particularly beneficial for less economically prosperous regions. Additionally, the study provides valuable insights for advancing energy research in economically viable areas. Recommendations included conducting site-specific assessments, utilizing advanced modeling tools, implementing regular maintenance protocols, and enhancing communication among system components.
COLLEGE BUS MANAGEMENT SYSTEM PROJECT REPORT.pdfKamal Acharya
The College Bus Management system is completely developed by Visual Basic .NET Version. The application is connect with most secured database language MS SQL Server. The application is develop by using best combination of front-end and back-end languages. The application is totally design like flat user interface. This flat user interface is more attractive user interface in 2017. The application is gives more important to the system functionality. The application is to manage the student’s details, driver’s details, bus details, bus route details, bus fees details and more. The application has only one unit for admin. The admin can manage the entire application. The admin can login into the application by using username and password of the admin. The application is develop for big and small colleges. It is more user friendly for non-computer person. Even they can easily learn how to manage the application within hours. The application is more secure by the admin. The system will give an effective output for the VB.Net and SQL Server given as input to the system. The compiled java program given as input to the system, after scanning the program will generate different reports. The application generates the report for users. The admin can view and download the report of the data. The application deliver the excel format reports. Because, excel formatted reports is very easy to understand the income and expense of the college bus. This application is mainly develop for windows operating system users. In 2017, 73% of people enterprises are using windows operating system. So the application will easily install for all the windows operating system users. The application-developed size is very low. The application consumes very low space in disk. Therefore, the user can allocate very minimum local disk space for this application.
IRJET- Flood Susceptibility Assessment through GIS-Based Multi-Criteria Approach and Analytical Hierarchy Process (AHP) in a River Basin in Central Greece