SlideShare a Scribd company logo
1) Density is calculated from
temperature, salinity, and
pressure. Pressure matters
because temperature changes
with pressure. The full equation
to calculate density has many
terms, and is called the equation
of state for seawater. It can be
approximated as:
ΔDensity = α*ΔT+β*ΔS
α and β are coefficients of
thermal expansion and saline
contraction.
α is roughly 0.2 kg m-3 °C-1
β is roughly 1 kg m-3 psu-1
These values are where the
15°C and 3 psu come from. In
the ocean, α and β also depend
on salinity, temperature, and
pressure.
2) Temperature changes of 15°C are more common
than salinity changes 3 psu, so temperature tends to
have a bigger effect on density than salinity does. As a
general rule, cold water sinks and salt is just carried
along with it. More on the next slide.
3) Cold salty water will sink, and warm fresh water will float. But
cold fresh water may have the same density as warm salty water.
This is part of what makes the ocean interesting.
Ocean Layering: Density, Salinity, Temperature, and Circulation
Sylvia Cole, Scripps Institution of Oceanography, San Diego CA
Maureen Quessenberry, University City High School, San Diego CA
1) Density is mostly
determined by
temperature. The
densest water is found
near the poles, and the
lightest water is found
near the equator.
2) The coldest water
is found near the
poles and the
warmest water near
the equator.
3) The saltiest water
is found near the
center of the gyres,
but this is NOT
where the densest
water is found.
4) The main point is that temperature will primarily determine where
water sinks. There are exceptions to this, and one will be
mentioned later (the salty Mediterranean Sea).
The figures are average temperature, salinity, and density at the
surface from the World Ocean Atlas 2005. They are an average of
all observations in the last several decades. See
http://www.nodc.noaa.gov/OC5/WOA05/pr_woa05.html for more
information.
This water
is very
fresh, and
not very
dense.
2) The ocean is a big density
column with more layers, and
smoother changes between
layers. The lightest water is
on top, and the heaviest on
the bottom.
3) The density profile is
smooth because water at any
depth mixes a little with water
above and below. In most
places, most of the water is
very dense, with a thin layer
of light water near the
surface. The profile shown
here is from the South Pacific
Ocean (20°S, 170°W). It was
taken as part of a section
from near Antarctica to
Hawaii for the World Ocean
Circulation Experiment. See
‘02t.slides.globallayers’
(http://earthref.org/cgi-
bin/erda.cgi?n=1014) for
more information.
1) This is the approximate density profile for the density
column demonstrated at the beginning of class. Some of the
layers have a big change in density, and some of them only
change a little. It only takes a small change in density for
one liquid to float on top of another. The numeric values for
each liquid are given in ‘01t.activity.densitycolumn’
(http://earthref.org/cgi-bin/erda.cgi?n=1001).
1) The figure is a schematic of the global
conveyor belt circulation after the popular
one by W. S. Broecker*. The conveyor belt
circulation is also known as the meridional
overturning circulation, or the thermohaline
circulation.
2) Scientists are still working on many
details of this circulation. It is not even clear
what causes the circulation. It may be
partially driven by dense water sinking, or
by the energy available for water to rise.
Lifting cold water from the bottom to the
surface takes energy, and that has to come
from somewhere. It primarily comes from
energy put into the ocean by the tides and
winds.
*Broecker, W S, 1987. The biggest chill.
Natural History Magazine, Vol. 97, pp. 74-
82.
3) For a ninth grader, the important points are that there
is a circulation that is global and connects all of the
oceans, and the circulation involves the vertical
movement of water. This circulation is very different from
what happens at the surface. The global conveyor belt is
NOT driven by the wind, or organized into gyres.
Students should understand that these global currents
near the bottom of the ocean are caused by differences
in ocean density. Density causes water to sink in some
places, which means it will rise in other places and there
will be horizontal currents connecting where water sinks
and rises.
4) You may want to draw this on the board:
Causes vertical currents. Cold
water moves down and warm
water moves up.
Causes horizontal currents.
Cold water moves right and
warm water moves left.
1) The figure is adapted from Fig 9.20 of
Garrison*. This shows where water sinks
in the ocean, and roughly how deep it
sinks.
Red dots: All of the water that sits on the
bottom of the ocean sank near these
locations. As water sinks it entrains
nearby water and is modified as it travels
around the globe. Most of the ocean has
water that originated near Antarctica.
Green dots: These water masses sink to
the middle of the ocean and then spread
horizontally. The one by the
Mediterranean Sea sinks because it is
very salty. The Mediterranean Sea is
very salty because there is more
evaporation than precipitation there.
In some places, near Antarctica and
Russia, ice is involved in making water
denser. When sea ice freezes, it leaves
most of the salt behind. This helps to
increase the density of nearby and
already cold water.
What about the Arctic? Water does sink
there, but the bottom topography
(underwater hills and mountains)
prevents it from spreading around the
rest of the ocean. It is trapped in the
Arctic.
2) The main points are that 1) only dense water sinks, 2) dense
water is found in only a few places, usually where water is cold
near the polar regions, and 3) sinking happens rapidly compared
to rising. Sinking is not a continuous process. If you go to one of
these locations, you may or may not observe sinking water. It
happens in fits and spurts, and involves interactions with the
water, ice, and the atmosphere around it. In some places, water
will only sink for a short time in winter.
*Garrison, Oceanography: An Introduction to Marine Science. USA:
Thomson Learning, 2002.
1) There is no real diagram for
where water rises, water rises
everywhere very slowly.
The average speed of water
rising is roughly 1cm per day
(from Garrison, citation on
previous slide). This means
that it would take 1095 years
to rise 4000 m. This is an
average, it may take a few
hundred years, or a few
thousand years.
2) What causes water to rise? Water “rises” or becomes warmer and
less dense when the ocean is mixed in the vertical (see the diagram
to the right). Vertical mixing happens at smaller scales, parcels 10’s
of meters high are mixed together. The mixing occurs when waves
break. Just like there are surface waves that break on the surface
and mix air into the water and water into the air, there are waves
below the surface that mix slightly denser water with slightly lighter
water when they break. These are called internal waves and are
caused by winds blowing on the surface and tidal currents that run
into continental shelves, ridges, or other underwater obstructions.
Unmixed
Water is denser
Mixed
Water is lighter
Density
Depth
This is just a reminder of what the big picture is. The timescale for spreading
horizontally around this circuit is about the same as rising, about 1000 years.
Rising water in this diagram is a simplification, it happens everywhere in the ocean.
Sinking water really does occur in just a few places.
The figure mainly shows the circulations involved with water that sinks to the bottom.
Water that sinks to the middle of the ocean can have similar patterns, with flow
between the different ocean basins.
1) Just like surface
currents, deep currents
transport many things.
They can transport heat,
salt, nutrients, sediment,
gasses, pollution,
whatever is in the water.
One of the most important
things the ocean
transports is heat,
because this affects our
climate on land.
Our climate is also
affected by how fast the
ocean mixes in the
vertical. If the mixing were
increased or decreased,
our climate would change.
Weaker mixing means a
greater temperature
difference between the
surface and the bottom,
so the surface would
probably be warmer.
2) The third point has to do with nutrients, which is what biology needs
to grow. The rising part of this circulation is important for bringing
nutrients up from the bottom. If water did not rise, not as much life
could grow in the ocean. The global conveyor belt circulation is not
the only way for water to rise in the ocean, but it is still important.

More Related Content

Similar to Density of seawater , correlations related to the calculation

Chapt 6 water & ocean structure
Chapt 6 water & ocean structureChapt 6 water & ocean structure
Chapt 6 water & ocean structure
Serena Moon
 
Chemical and physical features of seawater and the
Chemical and physical features of seawater and theChemical and physical features of seawater and the
Chemical and physical features of seawater and the
Joseph Yzrael Agra
 
Lesson 2 hydrology
Lesson 2 hydrologyLesson 2 hydrology
Lesson 2 hydrology
Ned Baring
 
The Movement of Ocean Water
The Movement of Ocean WaterThe Movement of Ocean Water
The Movement of Ocean Water
mlong24
 
Ocean Currents 1
Ocean Currents 1Ocean Currents 1
Ocean Currents 1
GeoCoops
 

Similar to Density of seawater , correlations related to the calculation (20)

Physical Oceanography & Coastal Shoreline 2011
Physical Oceanography  & Coastal Shoreline 2011Physical Oceanography  & Coastal Shoreline 2011
Physical Oceanography & Coastal Shoreline 2011
 
8 oceanography ppt
8  oceanography ppt8  oceanography ppt
8 oceanography ppt
 
Chapt 6 water & ocean structure
Chapt 6 water & ocean structureChapt 6 water & ocean structure
Chapt 6 water & ocean structure
 
15. the astonishing genesis flood, part 2
15. the astonishing genesis flood, part 215. the astonishing genesis flood, part 2
15. the astonishing genesis flood, part 2
 
CROWTHER-SIMON-4188377
CROWTHER-SIMON-4188377CROWTHER-SIMON-4188377
CROWTHER-SIMON-4188377
 
Chemical and physical features of seawater and the
Chemical and physical features of seawater and theChemical and physical features of seawater and the
Chemical and physical features of seawater and the
 
Oceanic currents GEography
Oceanic currents GEographyOceanic currents GEography
Oceanic currents GEography
 
Marine bio pp#2,3 2017
Marine bio pp#2,3 2017Marine bio pp#2,3 2017
Marine bio pp#2,3 2017
 
Chapter three principle ecology
Chapter three principle ecologyChapter three principle ecology
Chapter three principle ecology
 
Oceanography2 1
Oceanography2 1Oceanography2 1
Oceanography2 1
 
Lesson 2 hydrology
Lesson 2 hydrologyLesson 2 hydrology
Lesson 2 hydrology
 
Weather basics
Weather basicsWeather basics
Weather basics
 
The Movement of Ocean Water
The Movement of Ocean WaterThe Movement of Ocean Water
The Movement of Ocean Water
 
Chapter nine
Chapter nineChapter nine
Chapter nine
 
Ocean Currents 1
Ocean Currents 1Ocean Currents 1
Ocean Currents 1
 
AS GEOGRAPHY - ATMOSPHERE AND WEATHER - OCEAN CURRENTS
AS GEOGRAPHY - ATMOSPHERE AND WEATHER - OCEAN CURRENTSAS GEOGRAPHY - ATMOSPHERE AND WEATHER - OCEAN CURRENTS
AS GEOGRAPHY - ATMOSPHERE AND WEATHER - OCEAN CURRENTS
 
Hand outs earth science
Hand outs earth scienceHand outs earth science
Hand outs earth science
 
Thermohaline Circulation & Climate Change
Thermohaline Circulation & Climate ChangeThermohaline Circulation & Climate Change
Thermohaline Circulation & Climate Change
 
Pertemuan 06 el nino climate change
Pertemuan 06 el nino climate changePertemuan 06 el nino climate change
Pertemuan 06 el nino climate change
 
Oceanography and coastal zone policy
Oceanography and coastal zone policyOceanography and coastal zone policy
Oceanography and coastal zone policy
 

Recently uploaded

一比一原版(UofT毕业证)多伦多大学毕业证成绩单
一比一原版(UofT毕业证)多伦多大学毕业证成绩单一比一原版(UofT毕业证)多伦多大学毕业证成绩单
一比一原版(UofT毕业证)多伦多大学毕业证成绩单
tuuww
 
一比一原版(UNK毕业证)内布拉斯加州立大学科尼分校毕业证成绩单
一比一原版(UNK毕业证)内布拉斯加州立大学科尼分校毕业证成绩单一比一原版(UNK毕业证)内布拉斯加州立大学科尼分校毕业证成绩单
一比一原版(UNK毕业证)内布拉斯加州立大学科尼分校毕业证成绩单
tuuww
 
Activity Planning: Objectives, Project Schedule, Network Planning Model. Time...
Activity Planning: Objectives, Project Schedule, Network Planning Model. Time...Activity Planning: Objectives, Project Schedule, Network Planning Model. Time...
Activity Planning: Objectives, Project Schedule, Network Planning Model. Time...
Lovely Professional University
 
Laundry management system project report.pdf
Laundry management system project report.pdfLaundry management system project report.pdf
Laundry management system project report.pdf
Kamal Acharya
 

Recently uploaded (20)

retail automation billing system ppt.pptx
retail automation billing system ppt.pptxretail automation billing system ppt.pptx
retail automation billing system ppt.pptx
 
Introduction to Machine Learning Unit-4 Notes for II-II Mechanical Engineering
Introduction to Machine Learning Unit-4 Notes for II-II Mechanical EngineeringIntroduction to Machine Learning Unit-4 Notes for II-II Mechanical Engineering
Introduction to Machine Learning Unit-4 Notes for II-II Mechanical Engineering
 
Quality defects in TMT Bars, Possible causes and Potential Solutions.
Quality defects in TMT Bars, Possible causes and Potential Solutions.Quality defects in TMT Bars, Possible causes and Potential Solutions.
Quality defects in TMT Bars, Possible causes and Potential Solutions.
 
一比一原版(UofT毕业证)多伦多大学毕业证成绩单
一比一原版(UofT毕业证)多伦多大学毕业证成绩单一比一原版(UofT毕业证)多伦多大学毕业证成绩单
一比一原版(UofT毕业证)多伦多大学毕业证成绩单
 
KIT-601 Lecture Notes-UNIT-4.pdf Frequent Itemsets and Clustering
KIT-601 Lecture Notes-UNIT-4.pdf Frequent Itemsets and ClusteringKIT-601 Lecture Notes-UNIT-4.pdf Frequent Itemsets and Clustering
KIT-601 Lecture Notes-UNIT-4.pdf Frequent Itemsets and Clustering
 
一比一原版(UNK毕业证)内布拉斯加州立大学科尼分校毕业证成绩单
一比一原版(UNK毕业证)内布拉斯加州立大学科尼分校毕业证成绩单一比一原版(UNK毕业证)内布拉斯加州立大学科尼分校毕业证成绩单
一比一原版(UNK毕业证)内布拉斯加州立大学科尼分校毕业证成绩单
 
Dairy management system project report..pdf
Dairy management system project report..pdfDairy management system project report..pdf
Dairy management system project report..pdf
 
Online book store management system project.pdf
Online book store management system project.pdfOnline book store management system project.pdf
Online book store management system project.pdf
 
Construction method of steel structure space frame .pptx
Construction method of steel structure space frame .pptxConstruction method of steel structure space frame .pptx
Construction method of steel structure space frame .pptx
 
RESORT MANAGEMENT AND RESERVATION SYSTEM PROJECT REPORT.pdf
RESORT MANAGEMENT AND RESERVATION SYSTEM PROJECT REPORT.pdfRESORT MANAGEMENT AND RESERVATION SYSTEM PROJECT REPORT.pdf
RESORT MANAGEMENT AND RESERVATION SYSTEM PROJECT REPORT.pdf
 
Software Engineering - Modelling Concepts + Class Modelling + Building the An...
Software Engineering - Modelling Concepts + Class Modelling + Building the An...Software Engineering - Modelling Concepts + Class Modelling + Building the An...
Software Engineering - Modelling Concepts + Class Modelling + Building the An...
 
BRAKING SYSTEM IN INDIAN RAILWAY AutoCAD DRAWING
BRAKING SYSTEM IN INDIAN RAILWAY AutoCAD DRAWINGBRAKING SYSTEM IN INDIAN RAILWAY AutoCAD DRAWING
BRAKING SYSTEM IN INDIAN RAILWAY AutoCAD DRAWING
 
Electrical shop management system project report.pdf
Electrical shop management system project report.pdfElectrical shop management system project report.pdf
Electrical shop management system project report.pdf
 
Activity Planning: Objectives, Project Schedule, Network Planning Model. Time...
Activity Planning: Objectives, Project Schedule, Network Planning Model. Time...Activity Planning: Objectives, Project Schedule, Network Planning Model. Time...
Activity Planning: Objectives, Project Schedule, Network Planning Model. Time...
 
Online resume builder management system project report.pdf
Online resume builder management system project report.pdfOnline resume builder management system project report.pdf
Online resume builder management system project report.pdf
 
Attraction and Repulsion type Moving Iron Instruments.pptx
Attraction and Repulsion type Moving Iron Instruments.pptxAttraction and Repulsion type Moving Iron Instruments.pptx
Attraction and Repulsion type Moving Iron Instruments.pptx
 
Peek implant persentation - Copy (1).pdf
Peek implant persentation - Copy (1).pdfPeek implant persentation - Copy (1).pdf
Peek implant persentation - Copy (1).pdf
 
Laundry management system project report.pdf
Laundry management system project report.pdfLaundry management system project report.pdf
Laundry management system project report.pdf
 
ENERGY STORAGE DEVICES INTRODUCTION UNIT-I
ENERGY STORAGE DEVICES  INTRODUCTION UNIT-IENERGY STORAGE DEVICES  INTRODUCTION UNIT-I
ENERGY STORAGE DEVICES INTRODUCTION UNIT-I
 
RM&IPR M5 notes.pdfResearch Methodolgy & Intellectual Property Rights Series 5
RM&IPR M5 notes.pdfResearch Methodolgy & Intellectual Property Rights Series 5RM&IPR M5 notes.pdfResearch Methodolgy & Intellectual Property Rights Series 5
RM&IPR M5 notes.pdfResearch Methodolgy & Intellectual Property Rights Series 5
 

Density of seawater , correlations related to the calculation

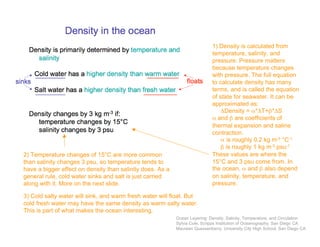
  • 1. 1) Density is calculated from temperature, salinity, and pressure. Pressure matters because temperature changes with pressure. The full equation to calculate density has many terms, and is called the equation of state for seawater. It can be approximated as: ΔDensity = α*ΔT+β*ΔS α and β are coefficients of thermal expansion and saline contraction. α is roughly 0.2 kg m-3 °C-1 β is roughly 1 kg m-3 psu-1 These values are where the 15°C and 3 psu come from. In the ocean, α and β also depend on salinity, temperature, and pressure. 2) Temperature changes of 15°C are more common than salinity changes 3 psu, so temperature tends to have a bigger effect on density than salinity does. As a general rule, cold water sinks and salt is just carried along with it. More on the next slide. 3) Cold salty water will sink, and warm fresh water will float. But cold fresh water may have the same density as warm salty water. This is part of what makes the ocean interesting. Ocean Layering: Density, Salinity, Temperature, and Circulation Sylvia Cole, Scripps Institution of Oceanography, San Diego CA Maureen Quessenberry, University City High School, San Diego CA
  • 2. 1) Density is mostly determined by temperature. The densest water is found near the poles, and the lightest water is found near the equator. 2) The coldest water is found near the poles and the warmest water near the equator. 3) The saltiest water is found near the center of the gyres, but this is NOT where the densest water is found. 4) The main point is that temperature will primarily determine where water sinks. There are exceptions to this, and one will be mentioned later (the salty Mediterranean Sea). The figures are average temperature, salinity, and density at the surface from the World Ocean Atlas 2005. They are an average of all observations in the last several decades. See http://www.nodc.noaa.gov/OC5/WOA05/pr_woa05.html for more information. This water is very fresh, and not very dense.
  • 3. 2) The ocean is a big density column with more layers, and smoother changes between layers. The lightest water is on top, and the heaviest on the bottom. 3) The density profile is smooth because water at any depth mixes a little with water above and below. In most places, most of the water is very dense, with a thin layer of light water near the surface. The profile shown here is from the South Pacific Ocean (20°S, 170°W). It was taken as part of a section from near Antarctica to Hawaii for the World Ocean Circulation Experiment. See ‘02t.slides.globallayers’ (http://earthref.org/cgi- bin/erda.cgi?n=1014) for more information. 1) This is the approximate density profile for the density column demonstrated at the beginning of class. Some of the layers have a big change in density, and some of them only change a little. It only takes a small change in density for one liquid to float on top of another. The numeric values for each liquid are given in ‘01t.activity.densitycolumn’ (http://earthref.org/cgi-bin/erda.cgi?n=1001).
  • 4. 1) The figure is a schematic of the global conveyor belt circulation after the popular one by W. S. Broecker*. The conveyor belt circulation is also known as the meridional overturning circulation, or the thermohaline circulation. 2) Scientists are still working on many details of this circulation. It is not even clear what causes the circulation. It may be partially driven by dense water sinking, or by the energy available for water to rise. Lifting cold water from the bottom to the surface takes energy, and that has to come from somewhere. It primarily comes from energy put into the ocean by the tides and winds. *Broecker, W S, 1987. The biggest chill. Natural History Magazine, Vol. 97, pp. 74- 82. 3) For a ninth grader, the important points are that there is a circulation that is global and connects all of the oceans, and the circulation involves the vertical movement of water. This circulation is very different from what happens at the surface. The global conveyor belt is NOT driven by the wind, or organized into gyres. Students should understand that these global currents near the bottom of the ocean are caused by differences in ocean density. Density causes water to sink in some places, which means it will rise in other places and there will be horizontal currents connecting where water sinks and rises. 4) You may want to draw this on the board: Causes vertical currents. Cold water moves down and warm water moves up. Causes horizontal currents. Cold water moves right and warm water moves left.
  • 5. 1) The figure is adapted from Fig 9.20 of Garrison*. This shows where water sinks in the ocean, and roughly how deep it sinks. Red dots: All of the water that sits on the bottom of the ocean sank near these locations. As water sinks it entrains nearby water and is modified as it travels around the globe. Most of the ocean has water that originated near Antarctica. Green dots: These water masses sink to the middle of the ocean and then spread horizontally. The one by the Mediterranean Sea sinks because it is very salty. The Mediterranean Sea is very salty because there is more evaporation than precipitation there. In some places, near Antarctica and Russia, ice is involved in making water denser. When sea ice freezes, it leaves most of the salt behind. This helps to increase the density of nearby and already cold water. What about the Arctic? Water does sink there, but the bottom topography (underwater hills and mountains) prevents it from spreading around the rest of the ocean. It is trapped in the Arctic. 2) The main points are that 1) only dense water sinks, 2) dense water is found in only a few places, usually where water is cold near the polar regions, and 3) sinking happens rapidly compared to rising. Sinking is not a continuous process. If you go to one of these locations, you may or may not observe sinking water. It happens in fits and spurts, and involves interactions with the water, ice, and the atmosphere around it. In some places, water will only sink for a short time in winter. *Garrison, Oceanography: An Introduction to Marine Science. USA: Thomson Learning, 2002.
  • 6. 1) There is no real diagram for where water rises, water rises everywhere very slowly. The average speed of water rising is roughly 1cm per day (from Garrison, citation on previous slide). This means that it would take 1095 years to rise 4000 m. This is an average, it may take a few hundred years, or a few thousand years. 2) What causes water to rise? Water “rises” or becomes warmer and less dense when the ocean is mixed in the vertical (see the diagram to the right). Vertical mixing happens at smaller scales, parcels 10’s of meters high are mixed together. The mixing occurs when waves break. Just like there are surface waves that break on the surface and mix air into the water and water into the air, there are waves below the surface that mix slightly denser water with slightly lighter water when they break. These are called internal waves and are caused by winds blowing on the surface and tidal currents that run into continental shelves, ridges, or other underwater obstructions. Unmixed Water is denser Mixed Water is lighter Density Depth
  • 7. This is just a reminder of what the big picture is. The timescale for spreading horizontally around this circuit is about the same as rising, about 1000 years. Rising water in this diagram is a simplification, it happens everywhere in the ocean. Sinking water really does occur in just a few places. The figure mainly shows the circulations involved with water that sinks to the bottom. Water that sinks to the middle of the ocean can have similar patterns, with flow between the different ocean basins.
  • 8. 1) Just like surface currents, deep currents transport many things. They can transport heat, salt, nutrients, sediment, gasses, pollution, whatever is in the water. One of the most important things the ocean transports is heat, because this affects our climate on land. Our climate is also affected by how fast the ocean mixes in the vertical. If the mixing were increased or decreased, our climate would change. Weaker mixing means a greater temperature difference between the surface and the bottom, so the surface would probably be warmer. 2) The third point has to do with nutrients, which is what biology needs to grow. The rising part of this circulation is important for bringing nutrients up from the bottom. If water did not rise, not as much life could grow in the ocean. The global conveyor belt circulation is not the only way for water to rise in the ocean, but it is still important.