Downloaded 23 times
![1D fast wavelet transforms
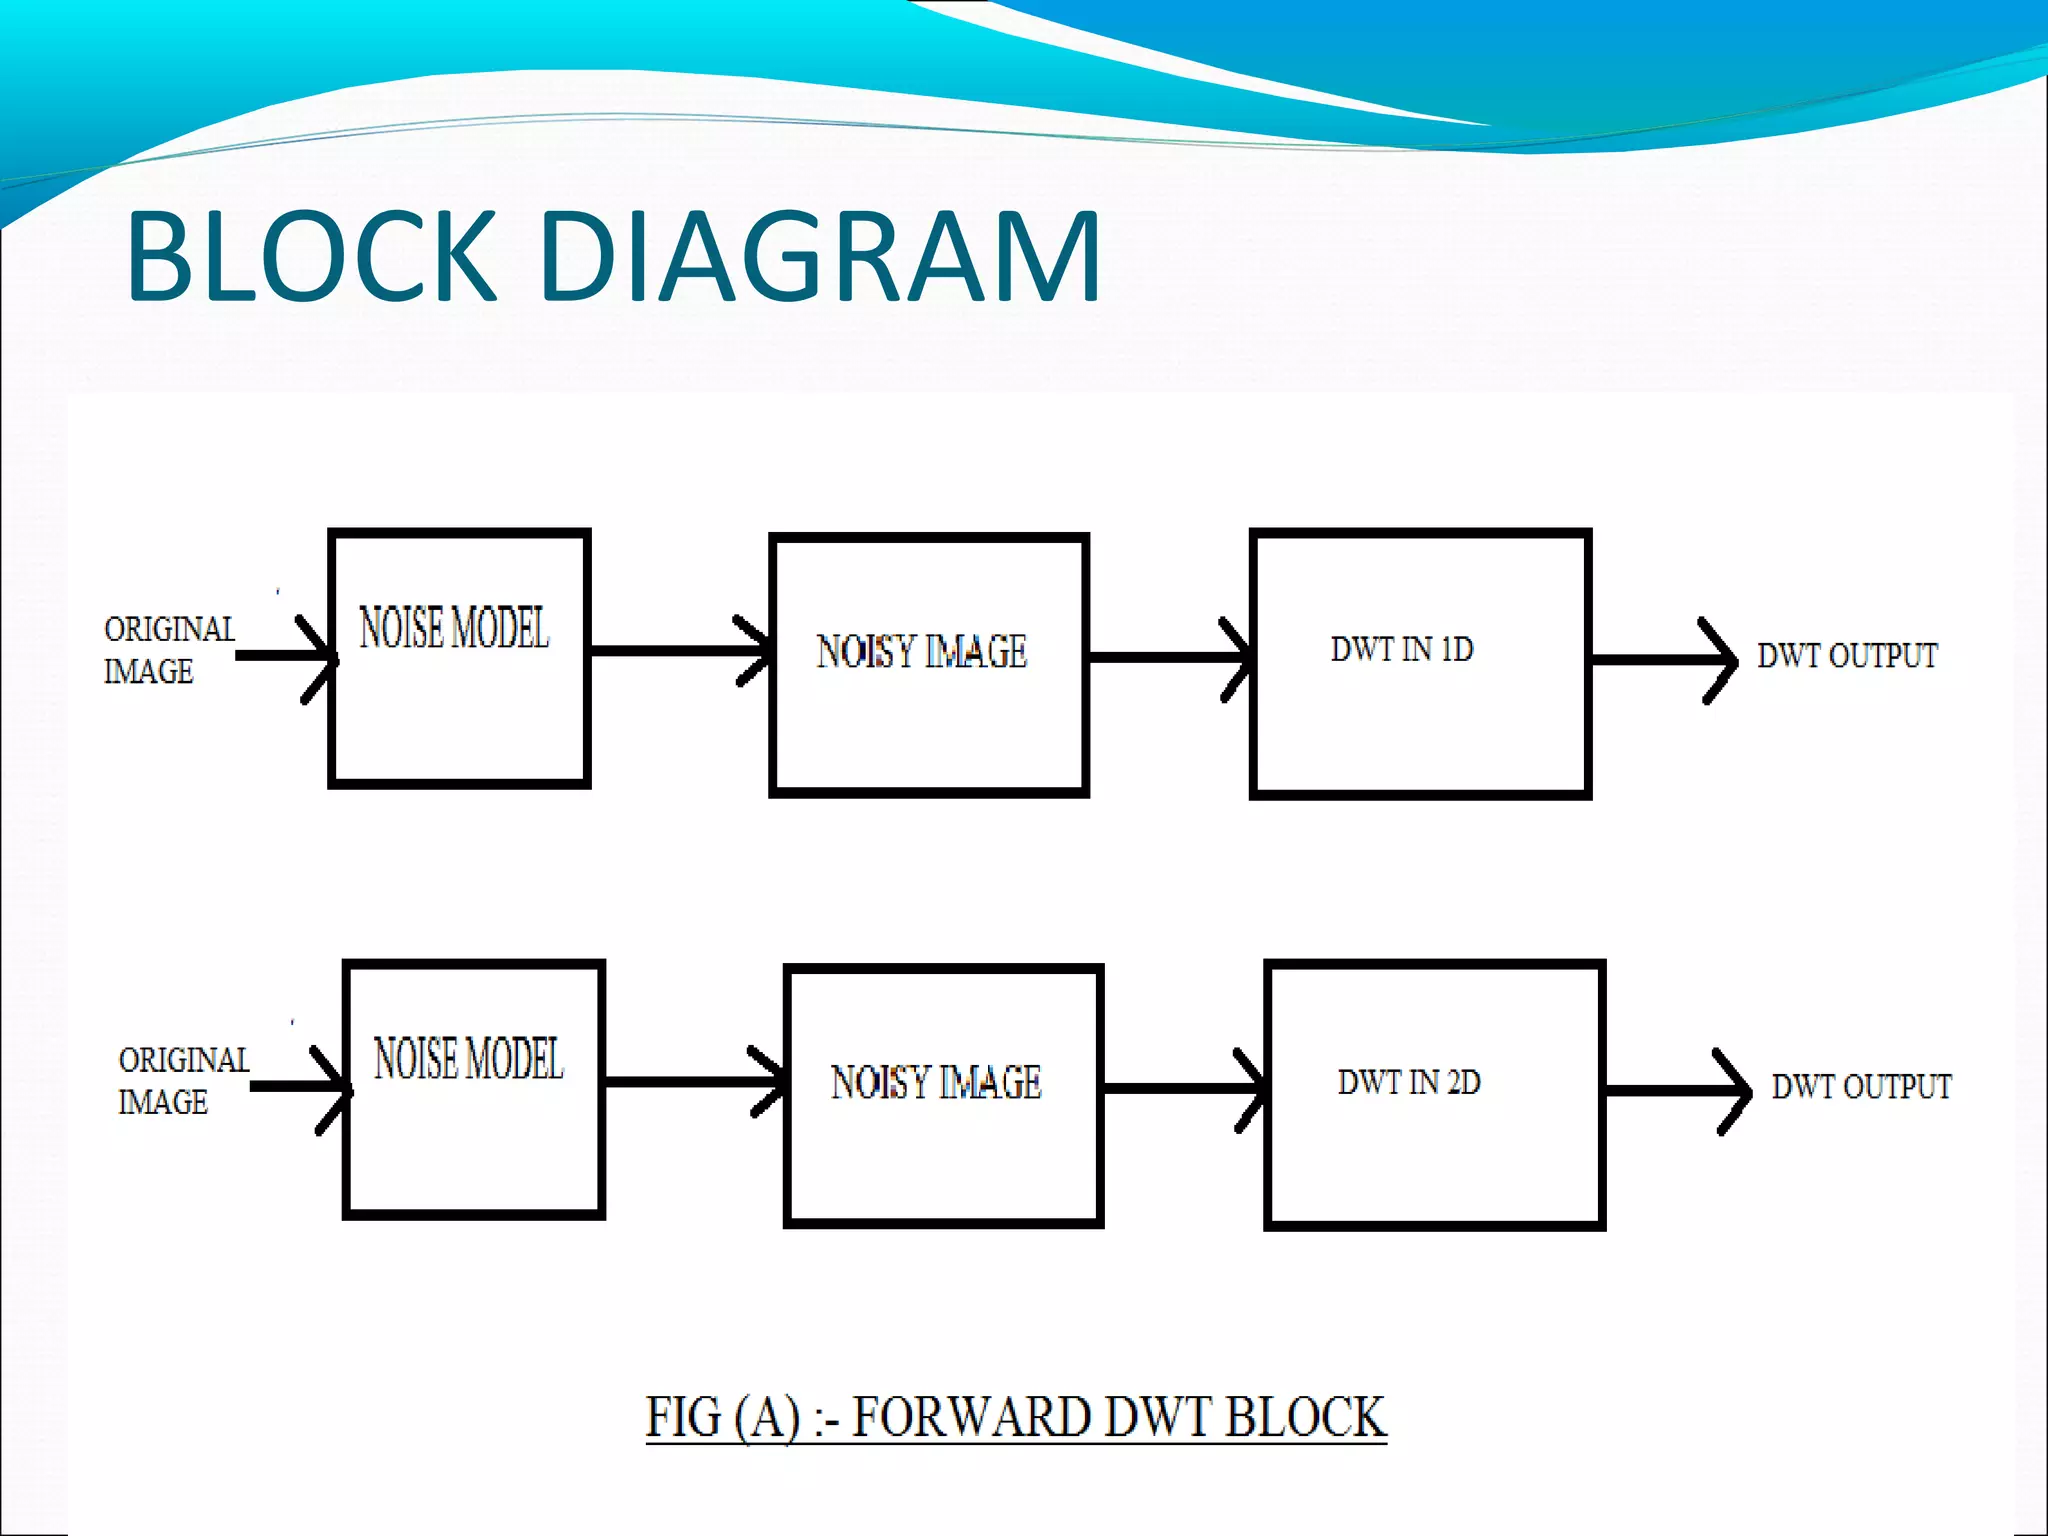
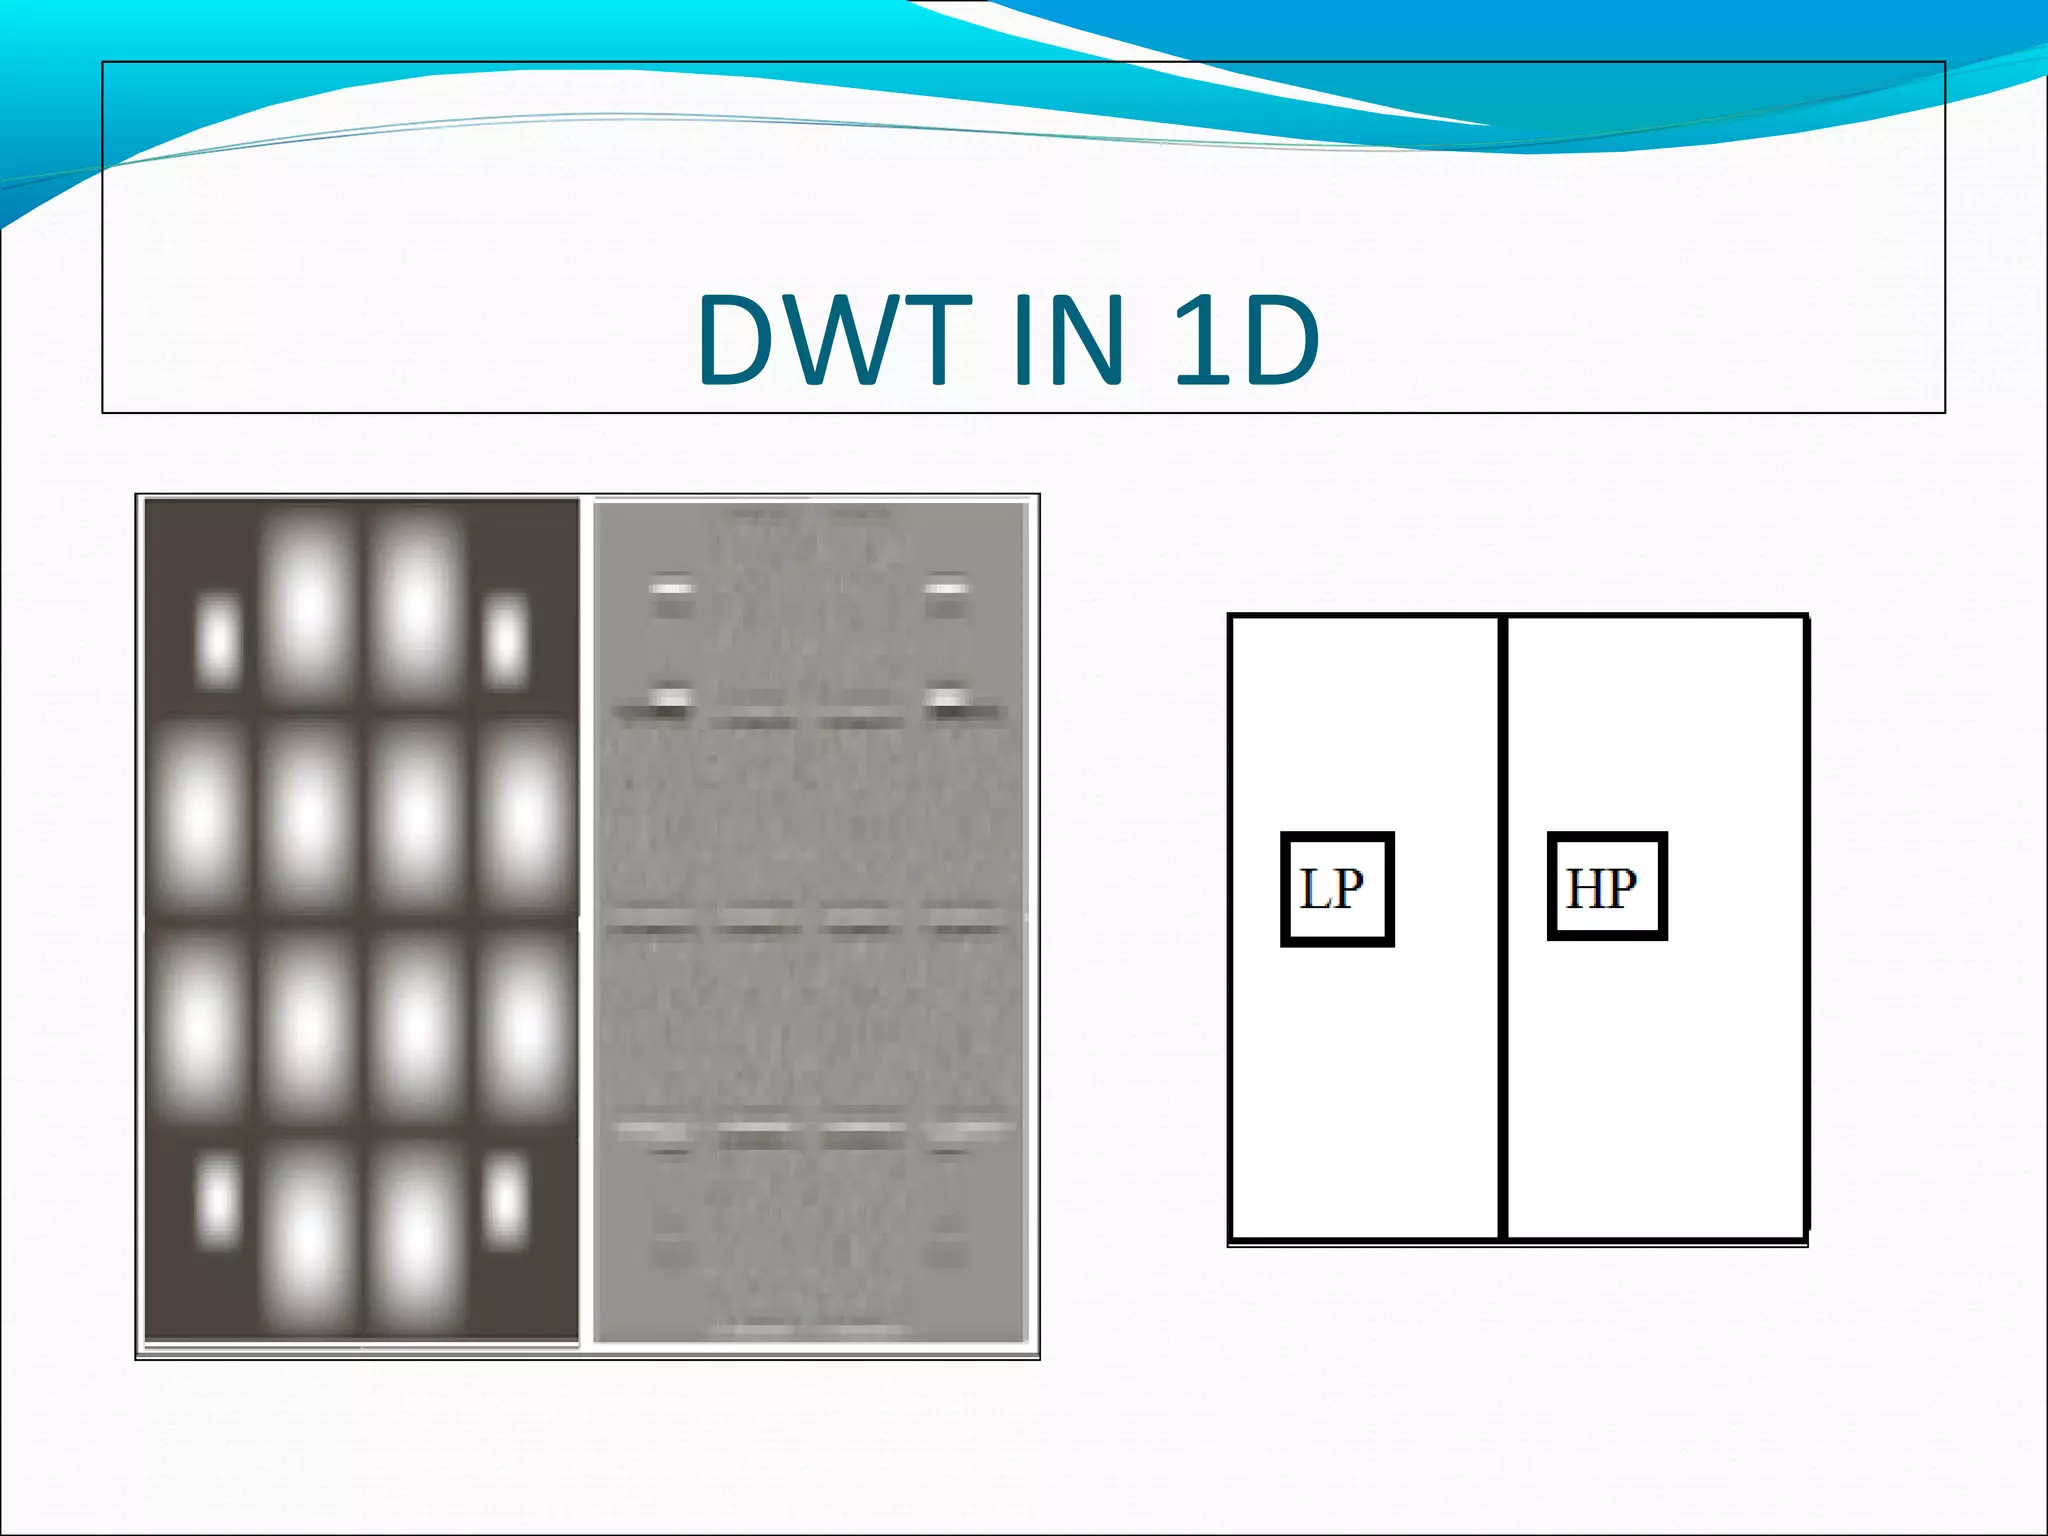
Due to the separable properties, we can apply 1D FWT.
DWT IN 1D
26
[1]](https://image.slidesharecdn.com/aqr-150213055258-conversion-gate02/75/Denoising-of-image-using-wavelet-26-2048.jpg)
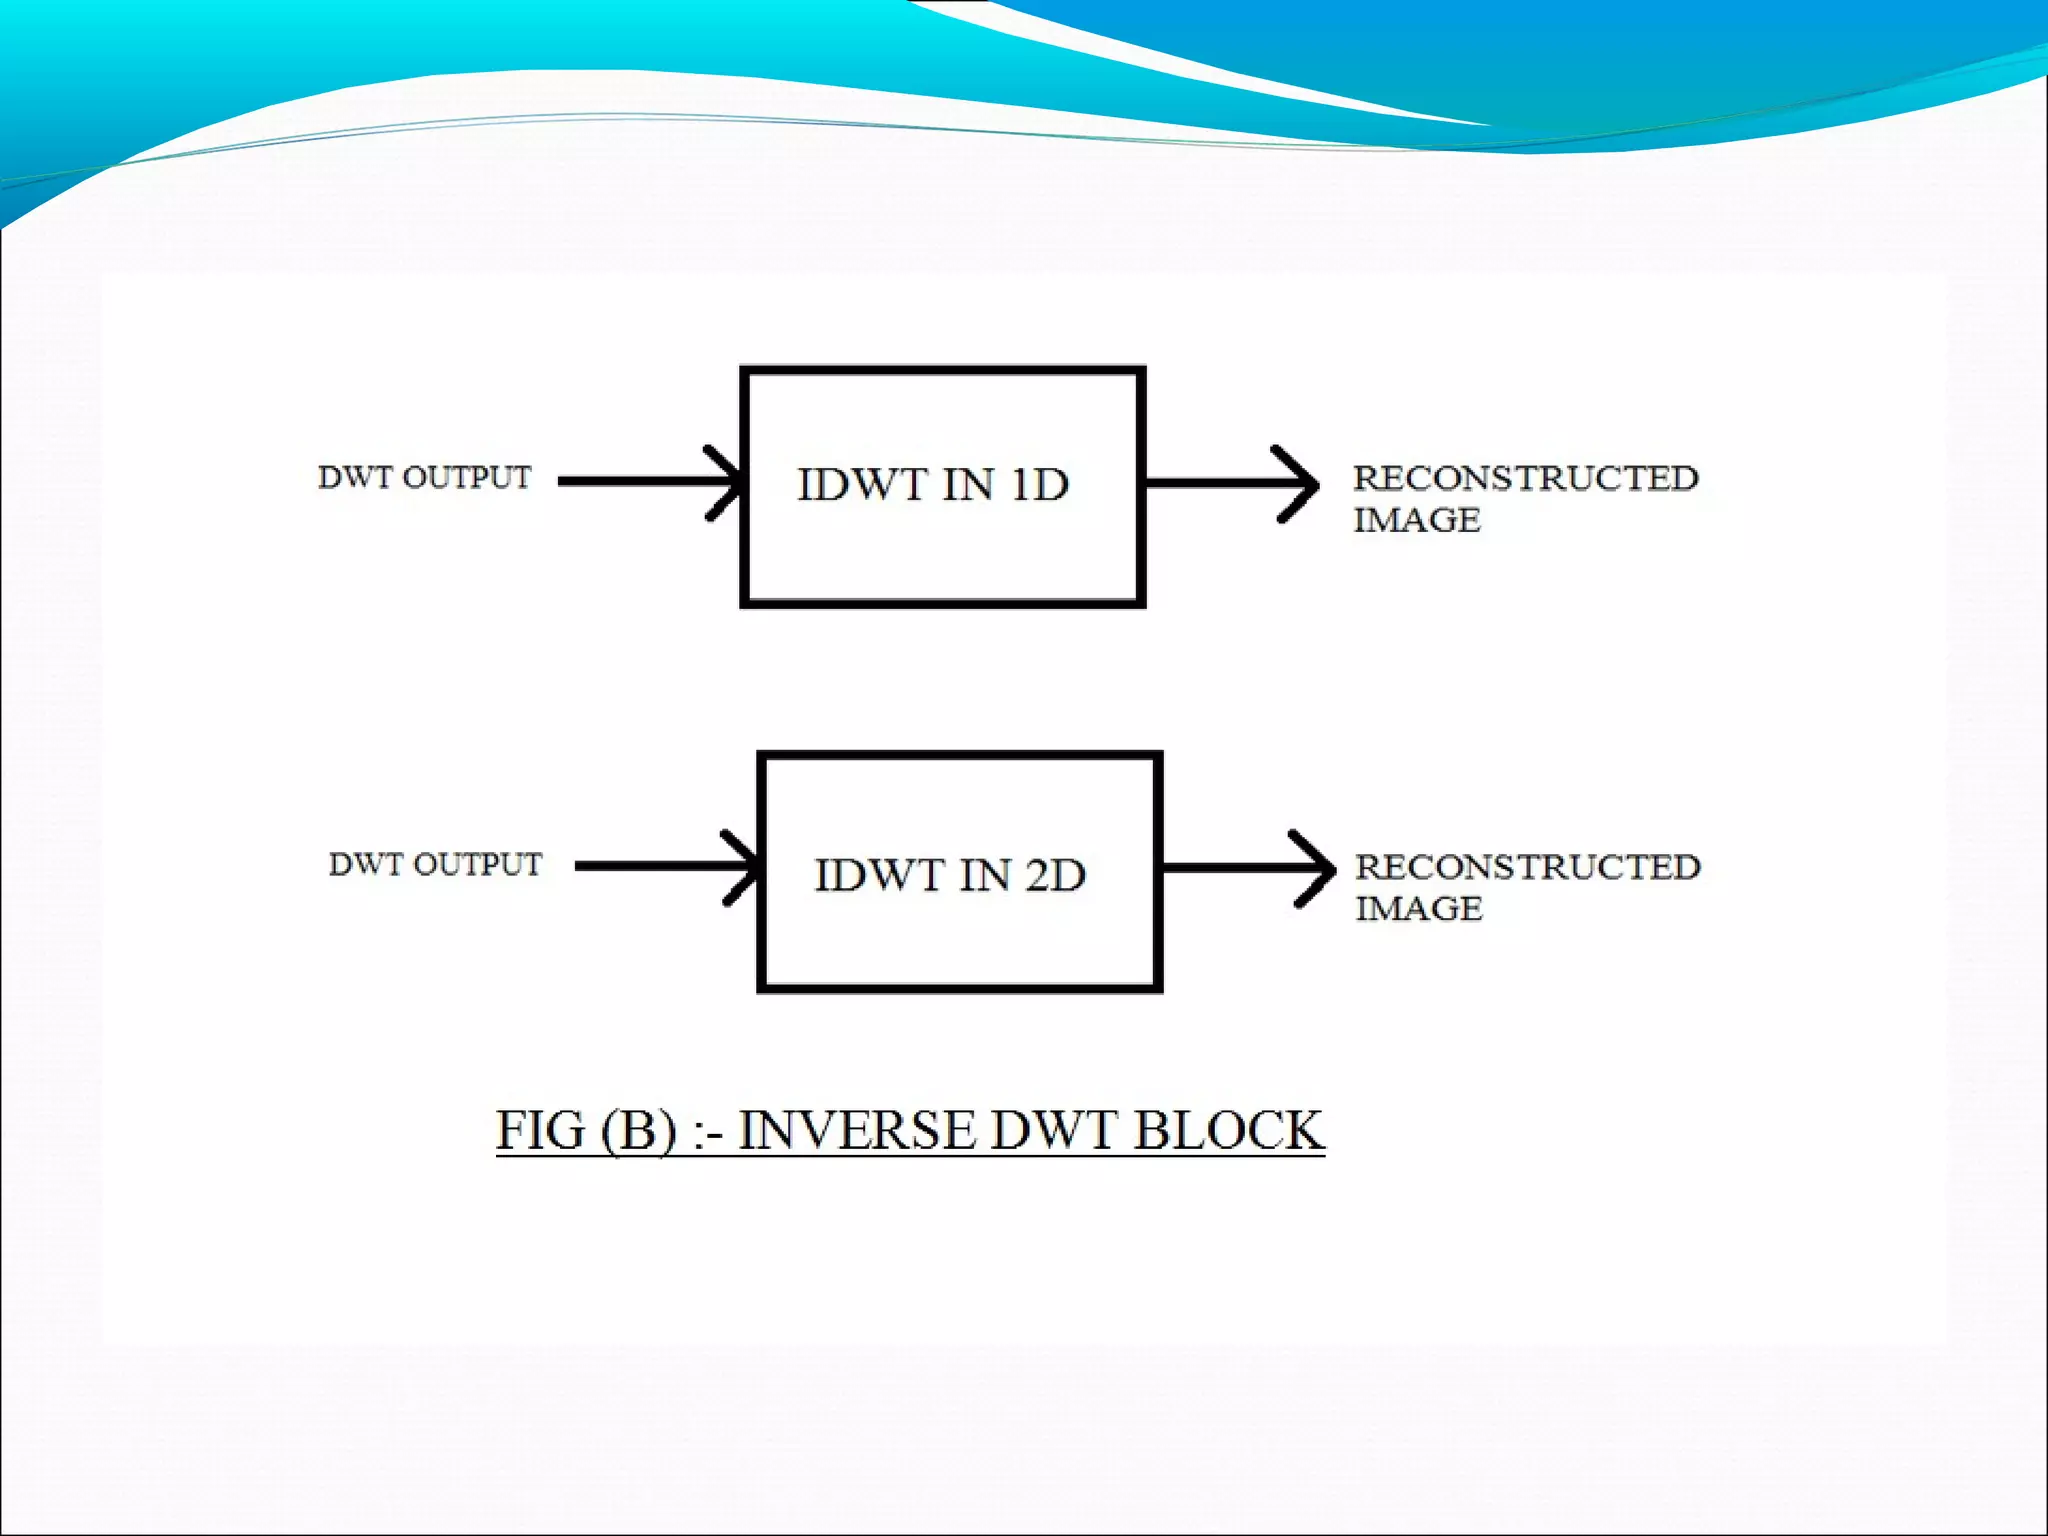
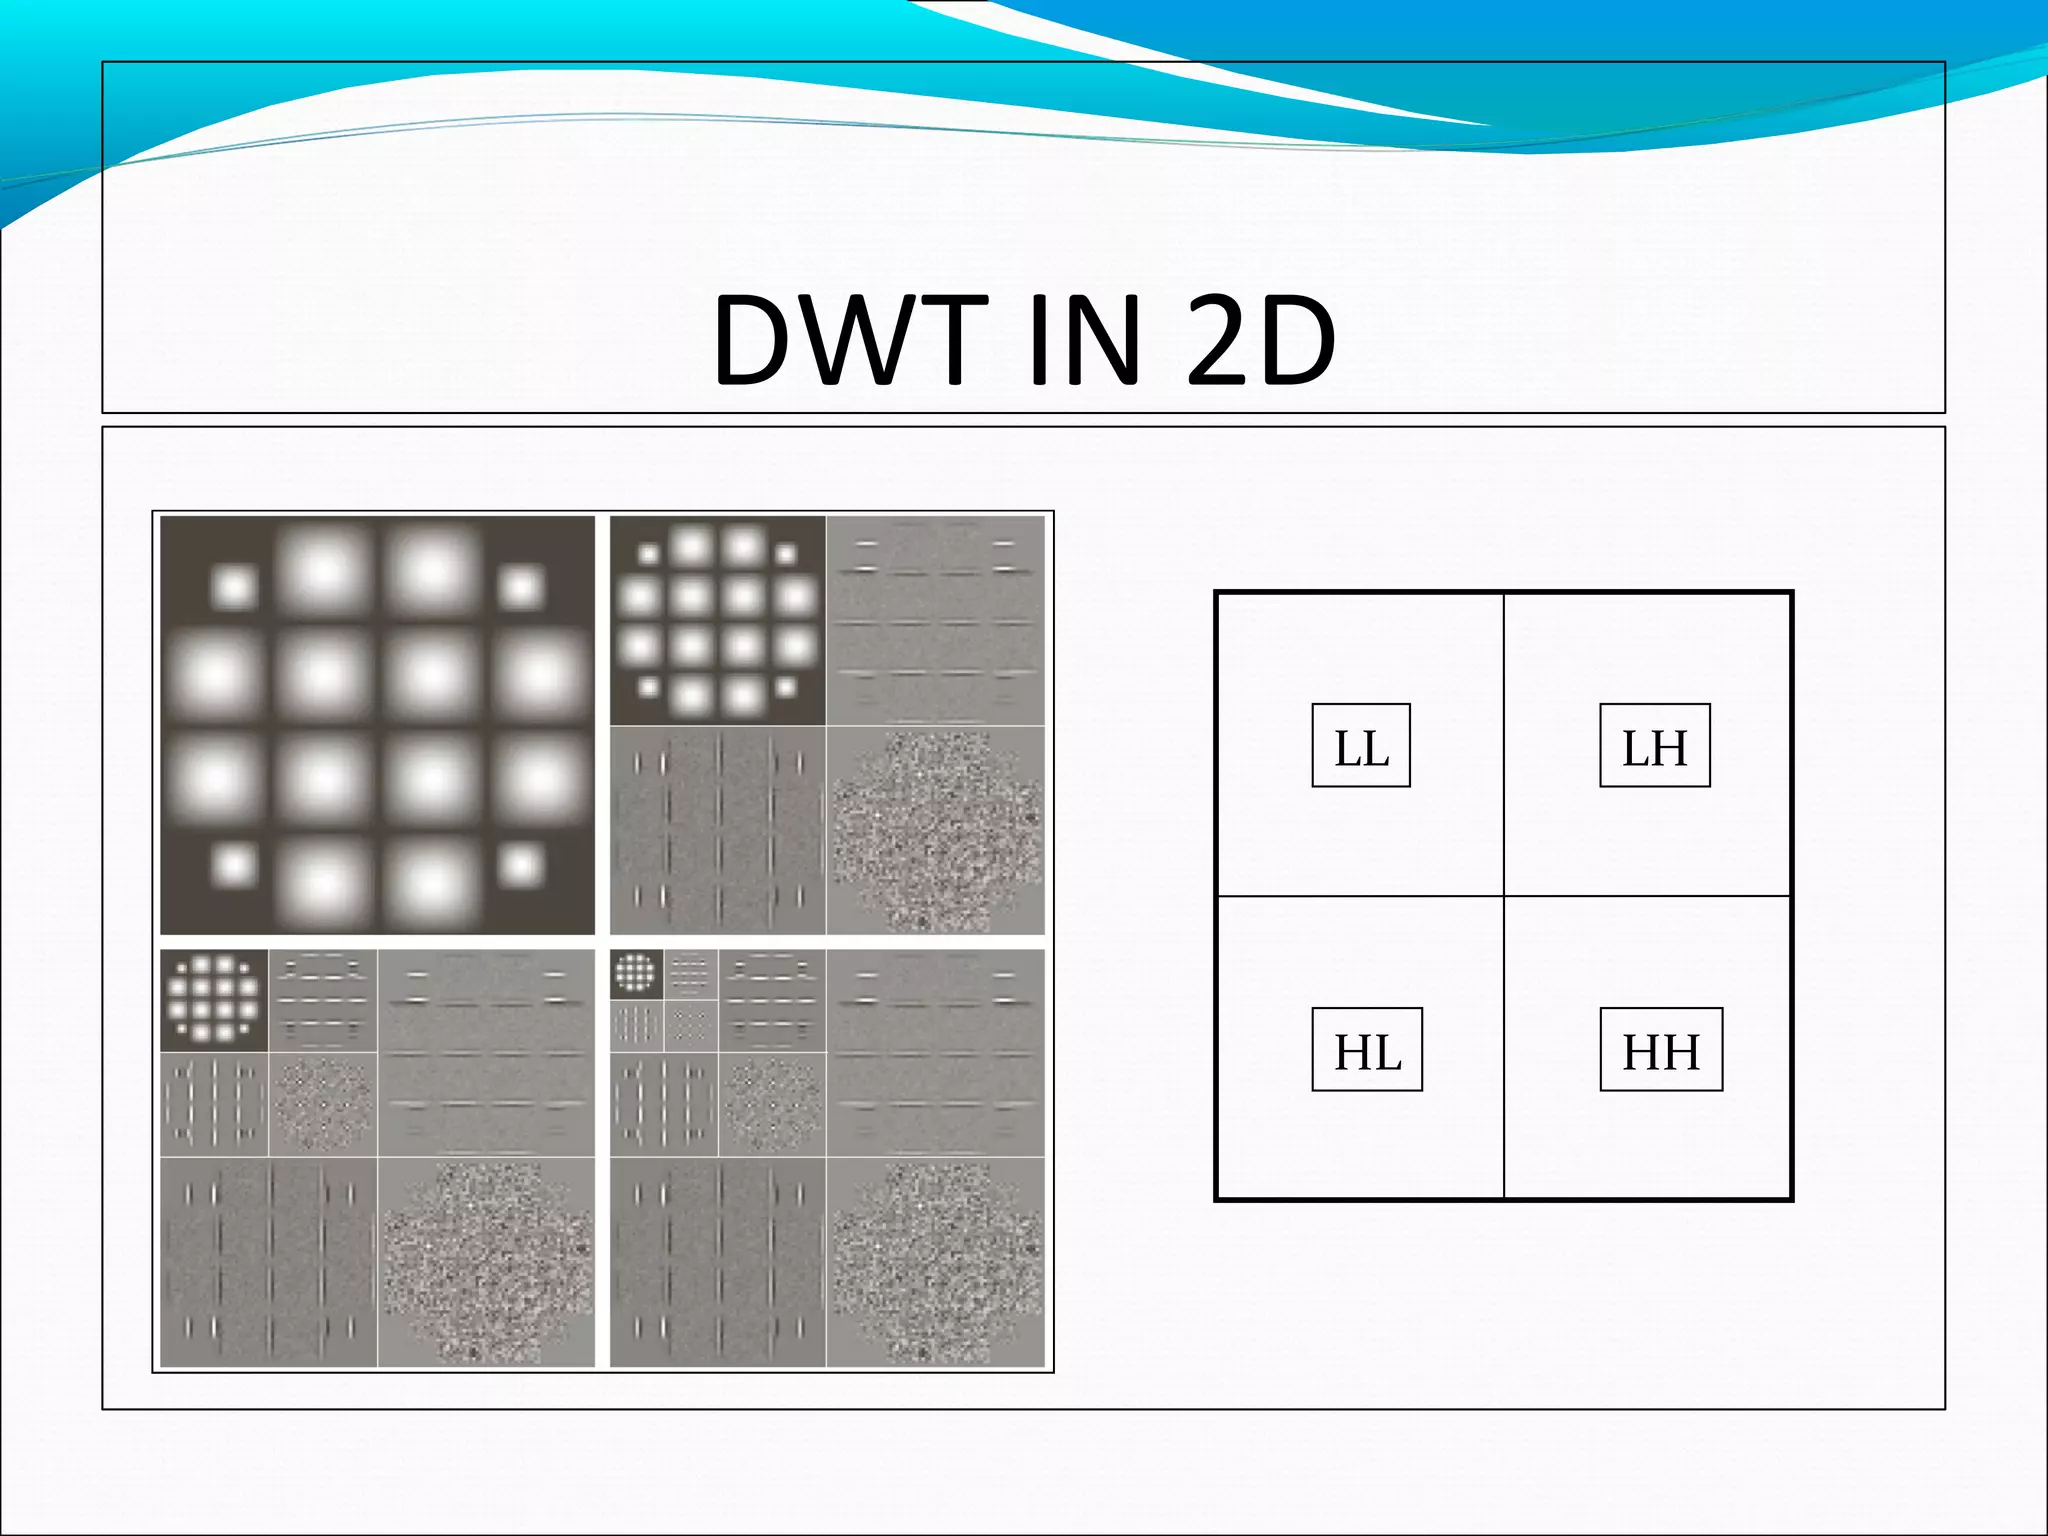
![2D fast wavelet transforms
Due to the separable properties, we can apply 1D FWT to
do 2D DWTs.
DWT IN 2D
27
[1]](https://image.slidesharecdn.com/aqr-150213055258-conversion-gate02/75/Denoising-of-image-using-wavelet-27-2048.jpg)


This document discusses using wavelet transforms for denoising images. It begins with an introduction to transforms and why wavelet transforms are useful compared to Fourier transforms. It then covers continuous and discrete wavelet transforms, different wavelet families, and multi-resolution analysis using filter banks. The document analyzes denoising performance using peak signal-to-noise ratio and applies wavelet transforms to applications like numerical analysis and signal processing. In conclusion, wavelet transforms provide multiresolution representation making them preferable to Fourier transforms for tasks like denoising.