Downloaded 166 times
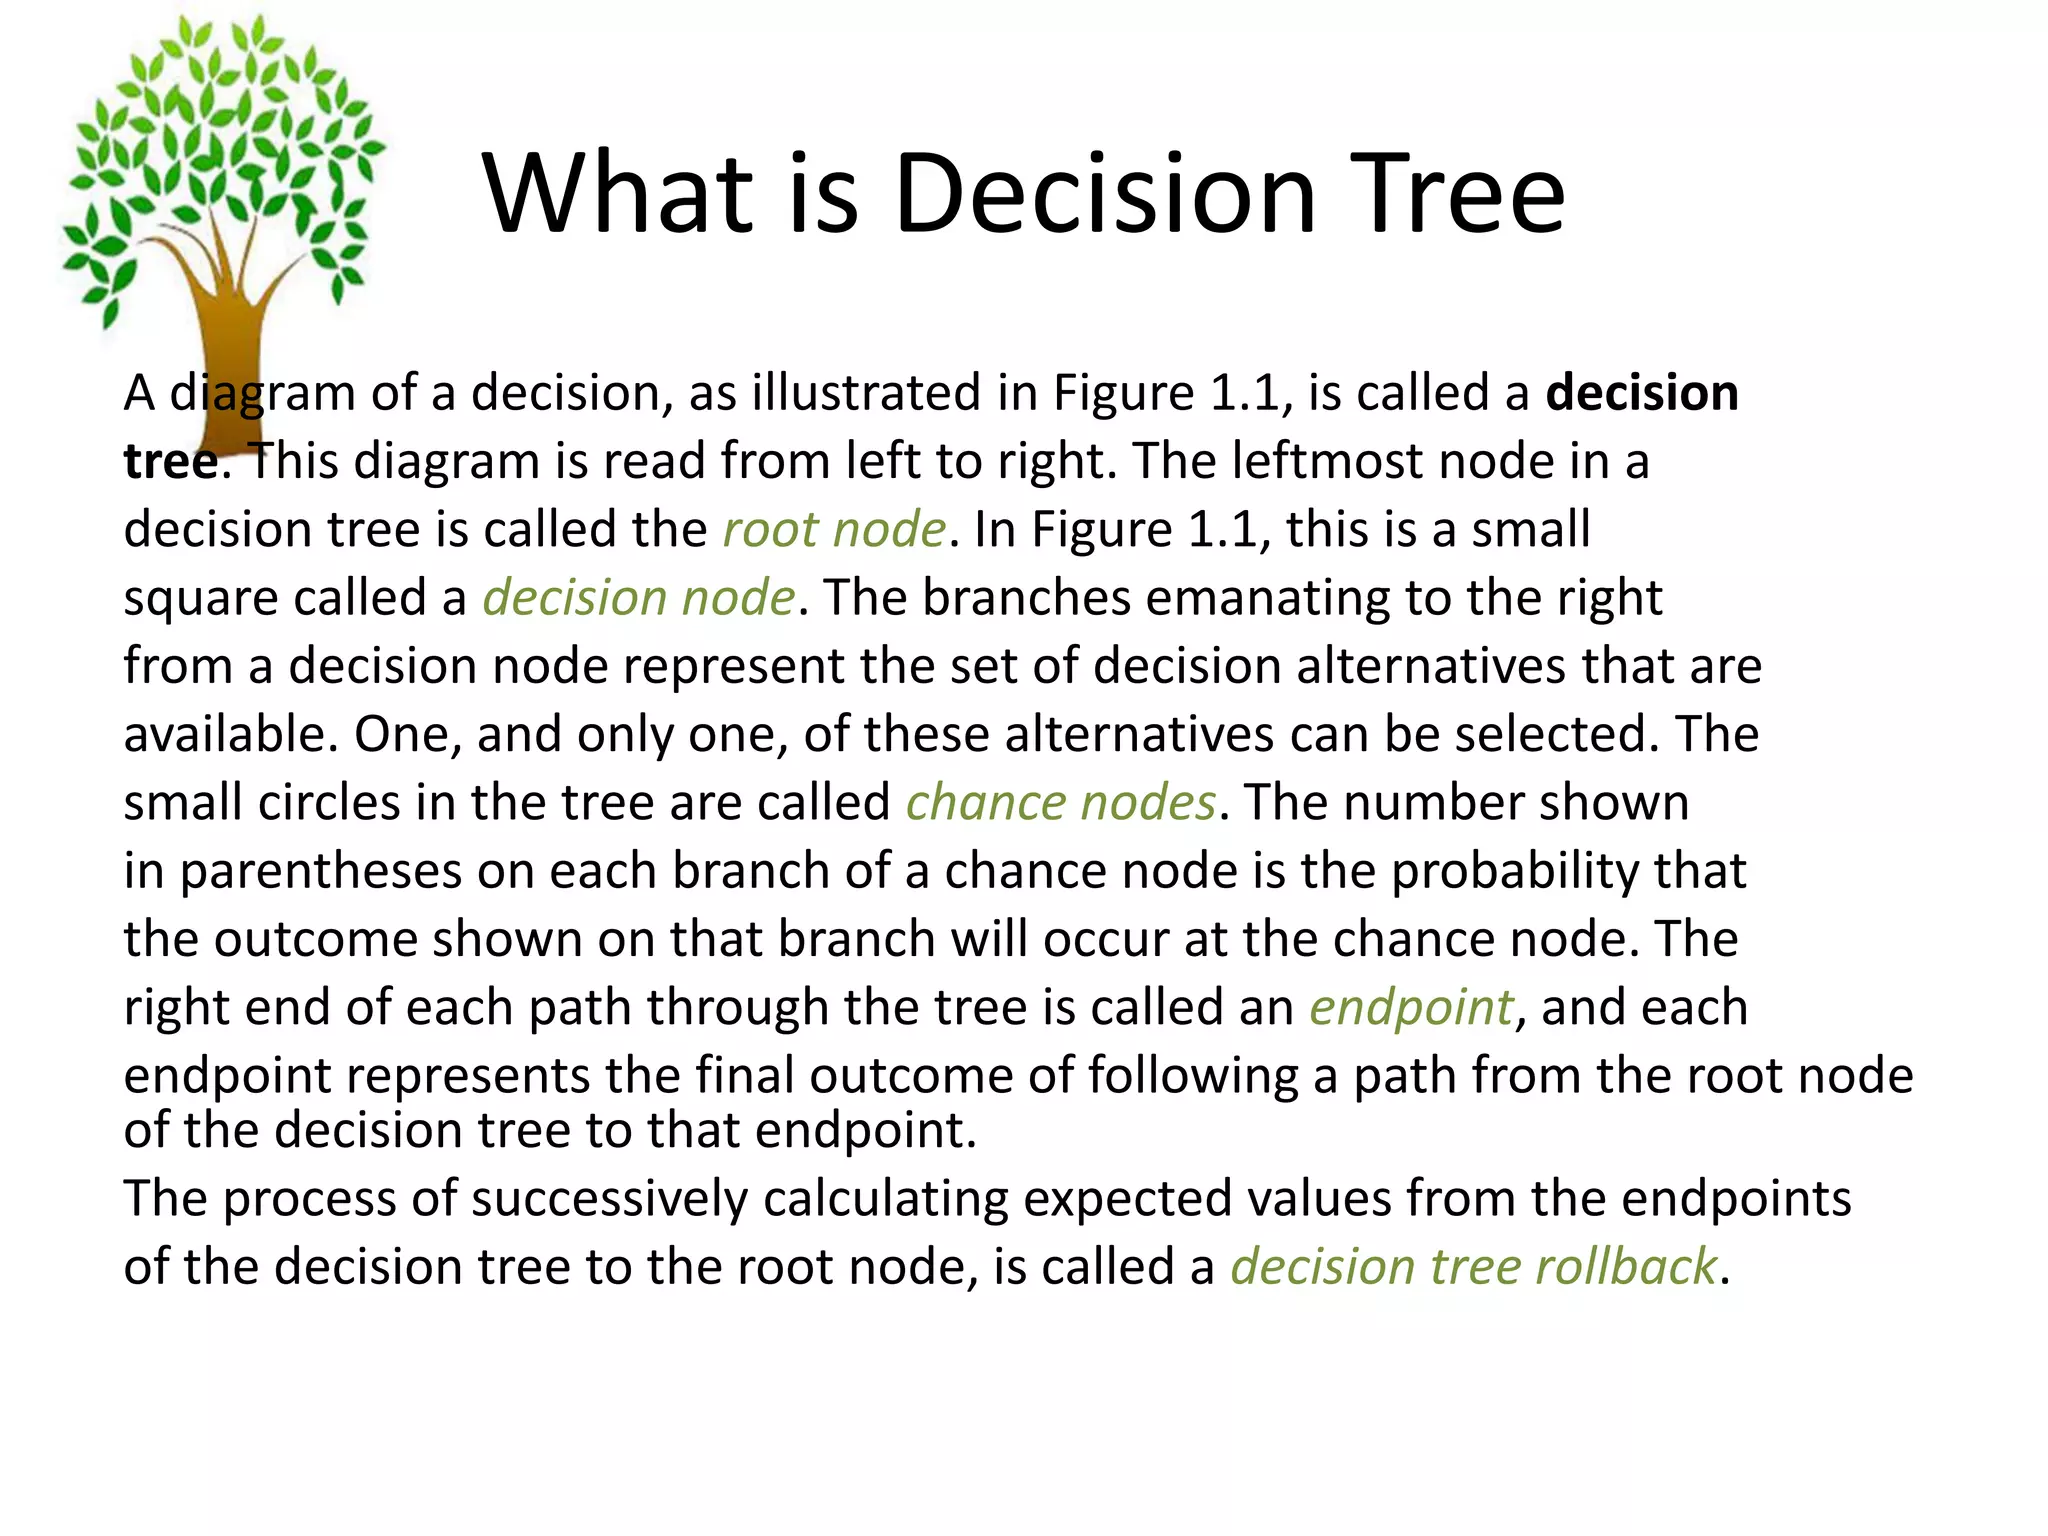
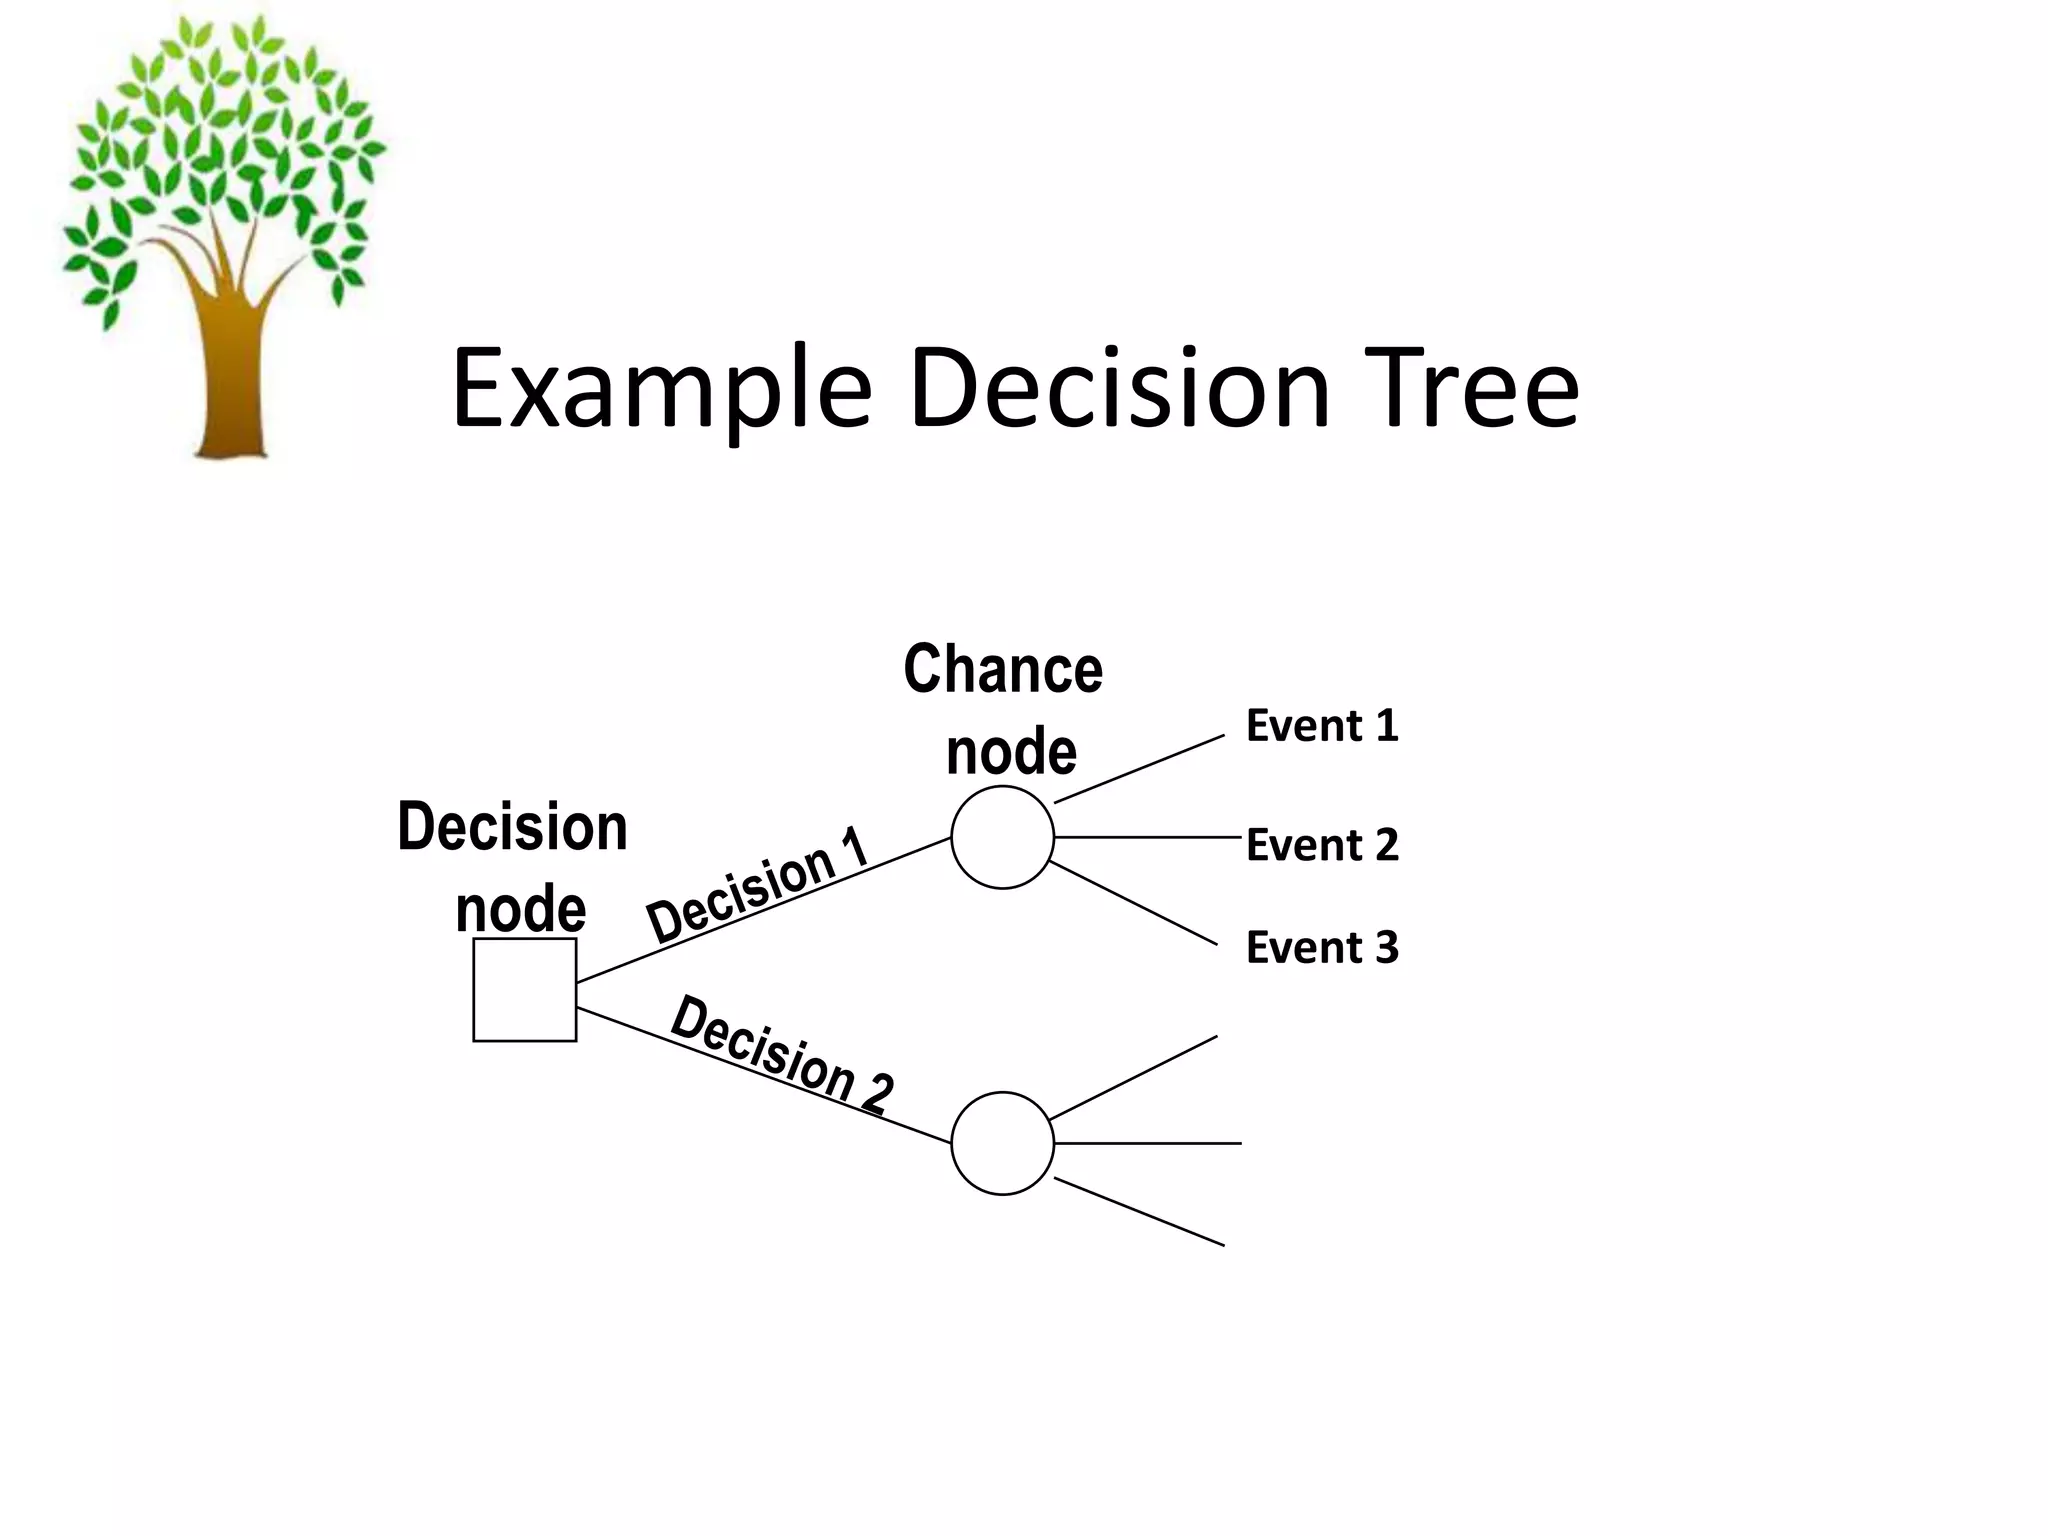

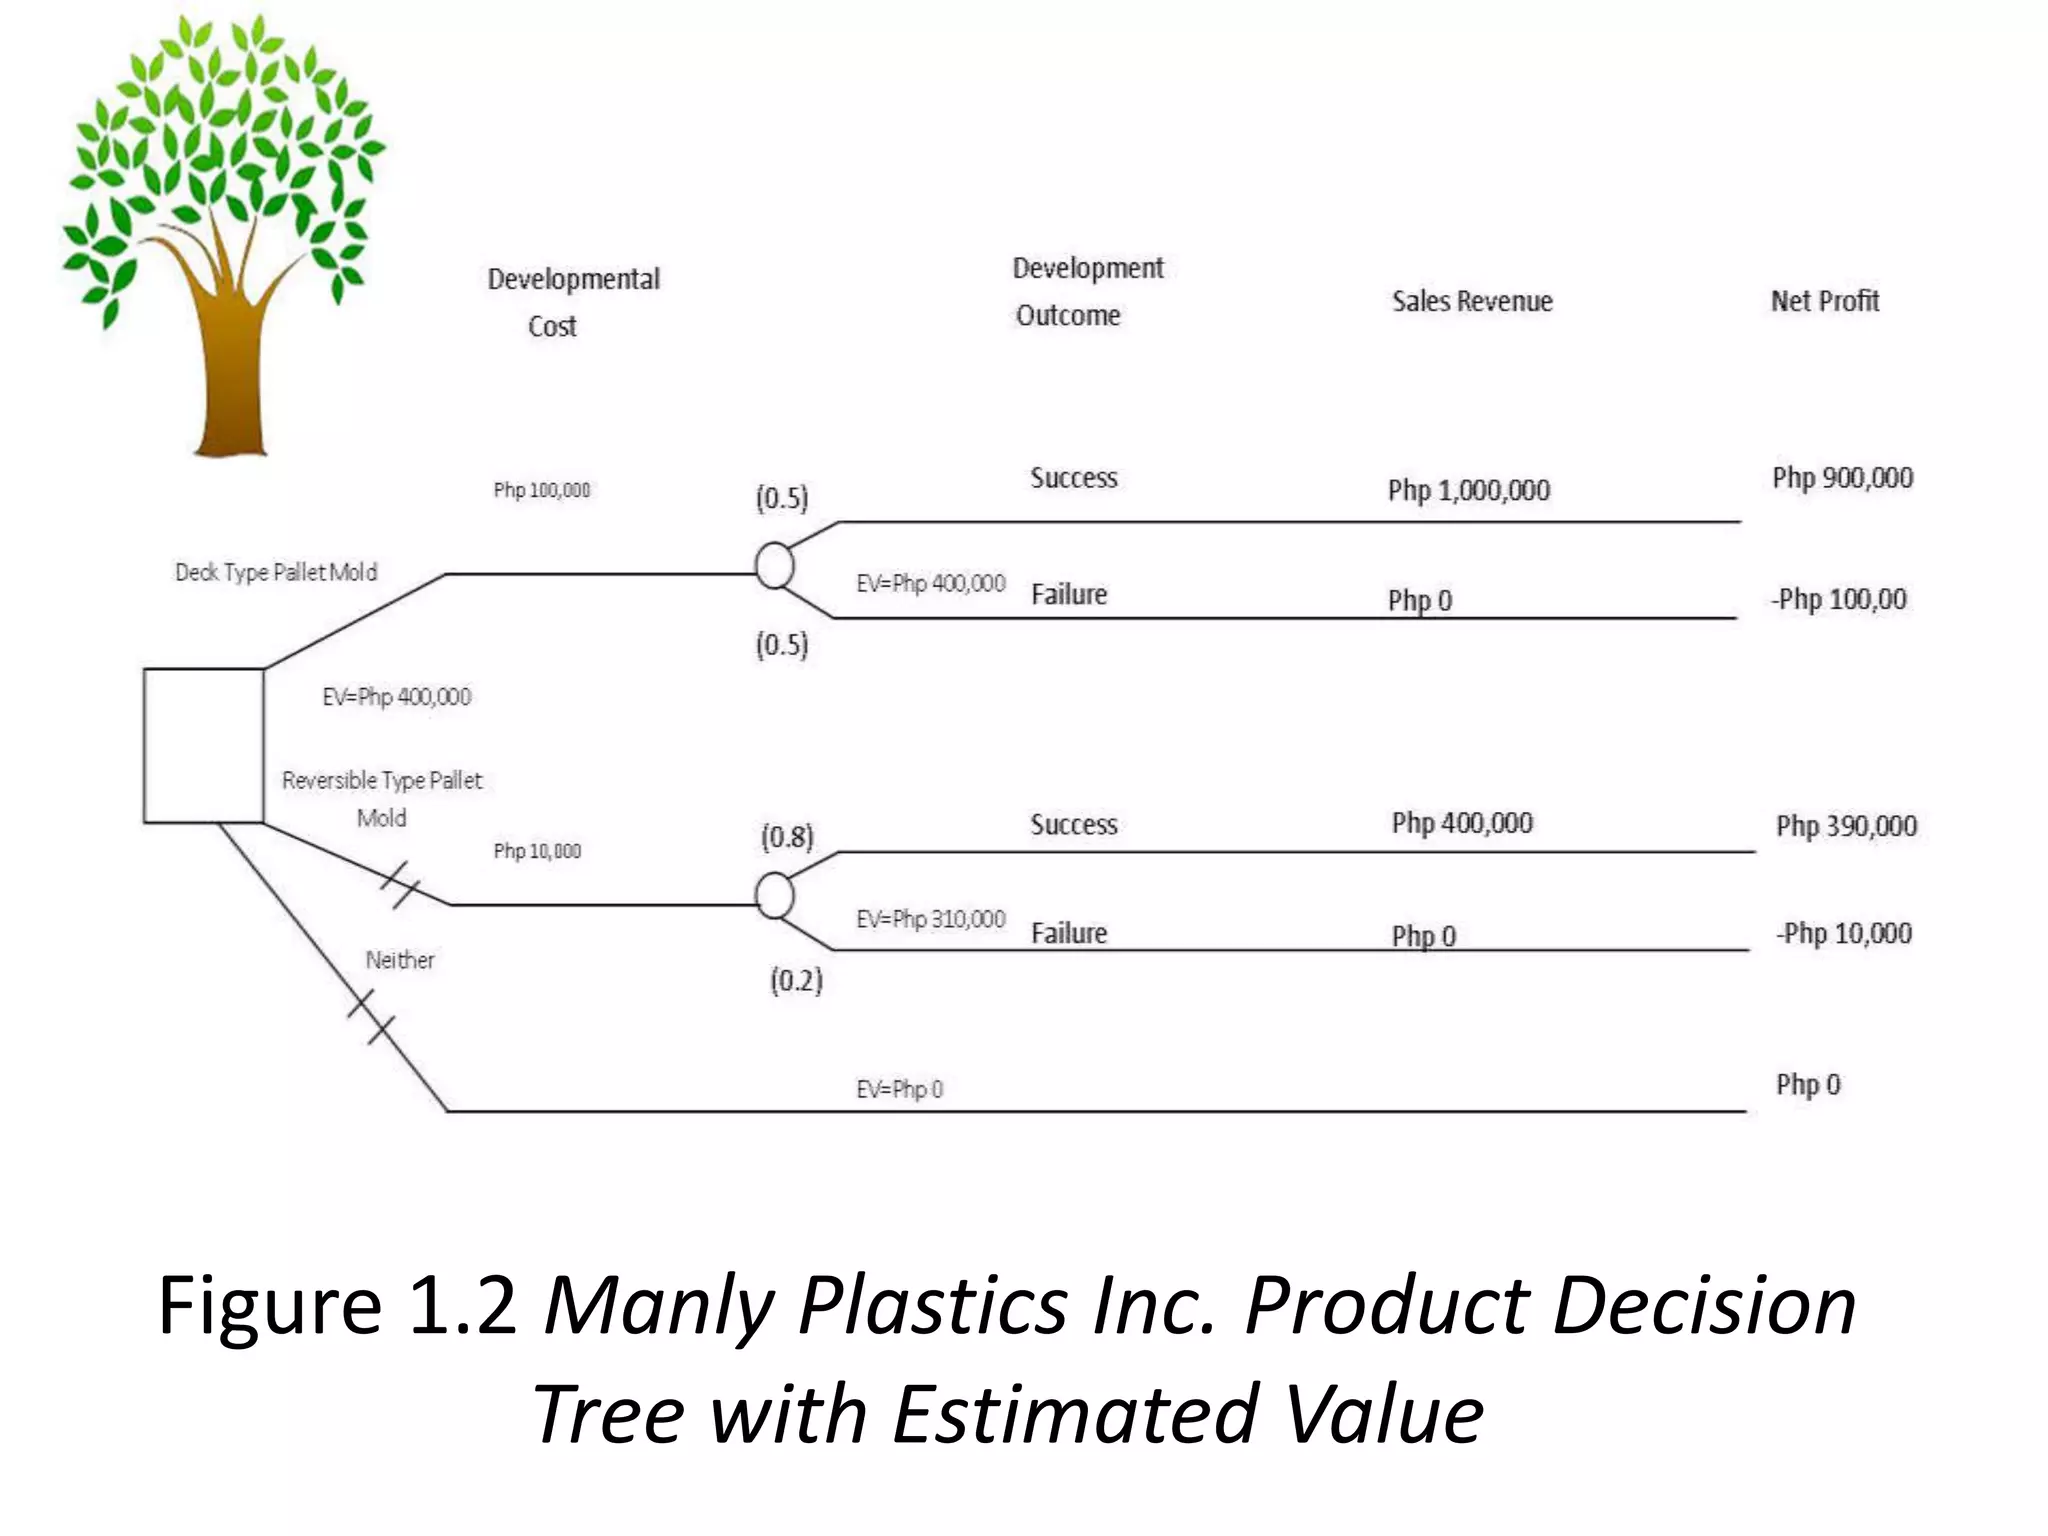
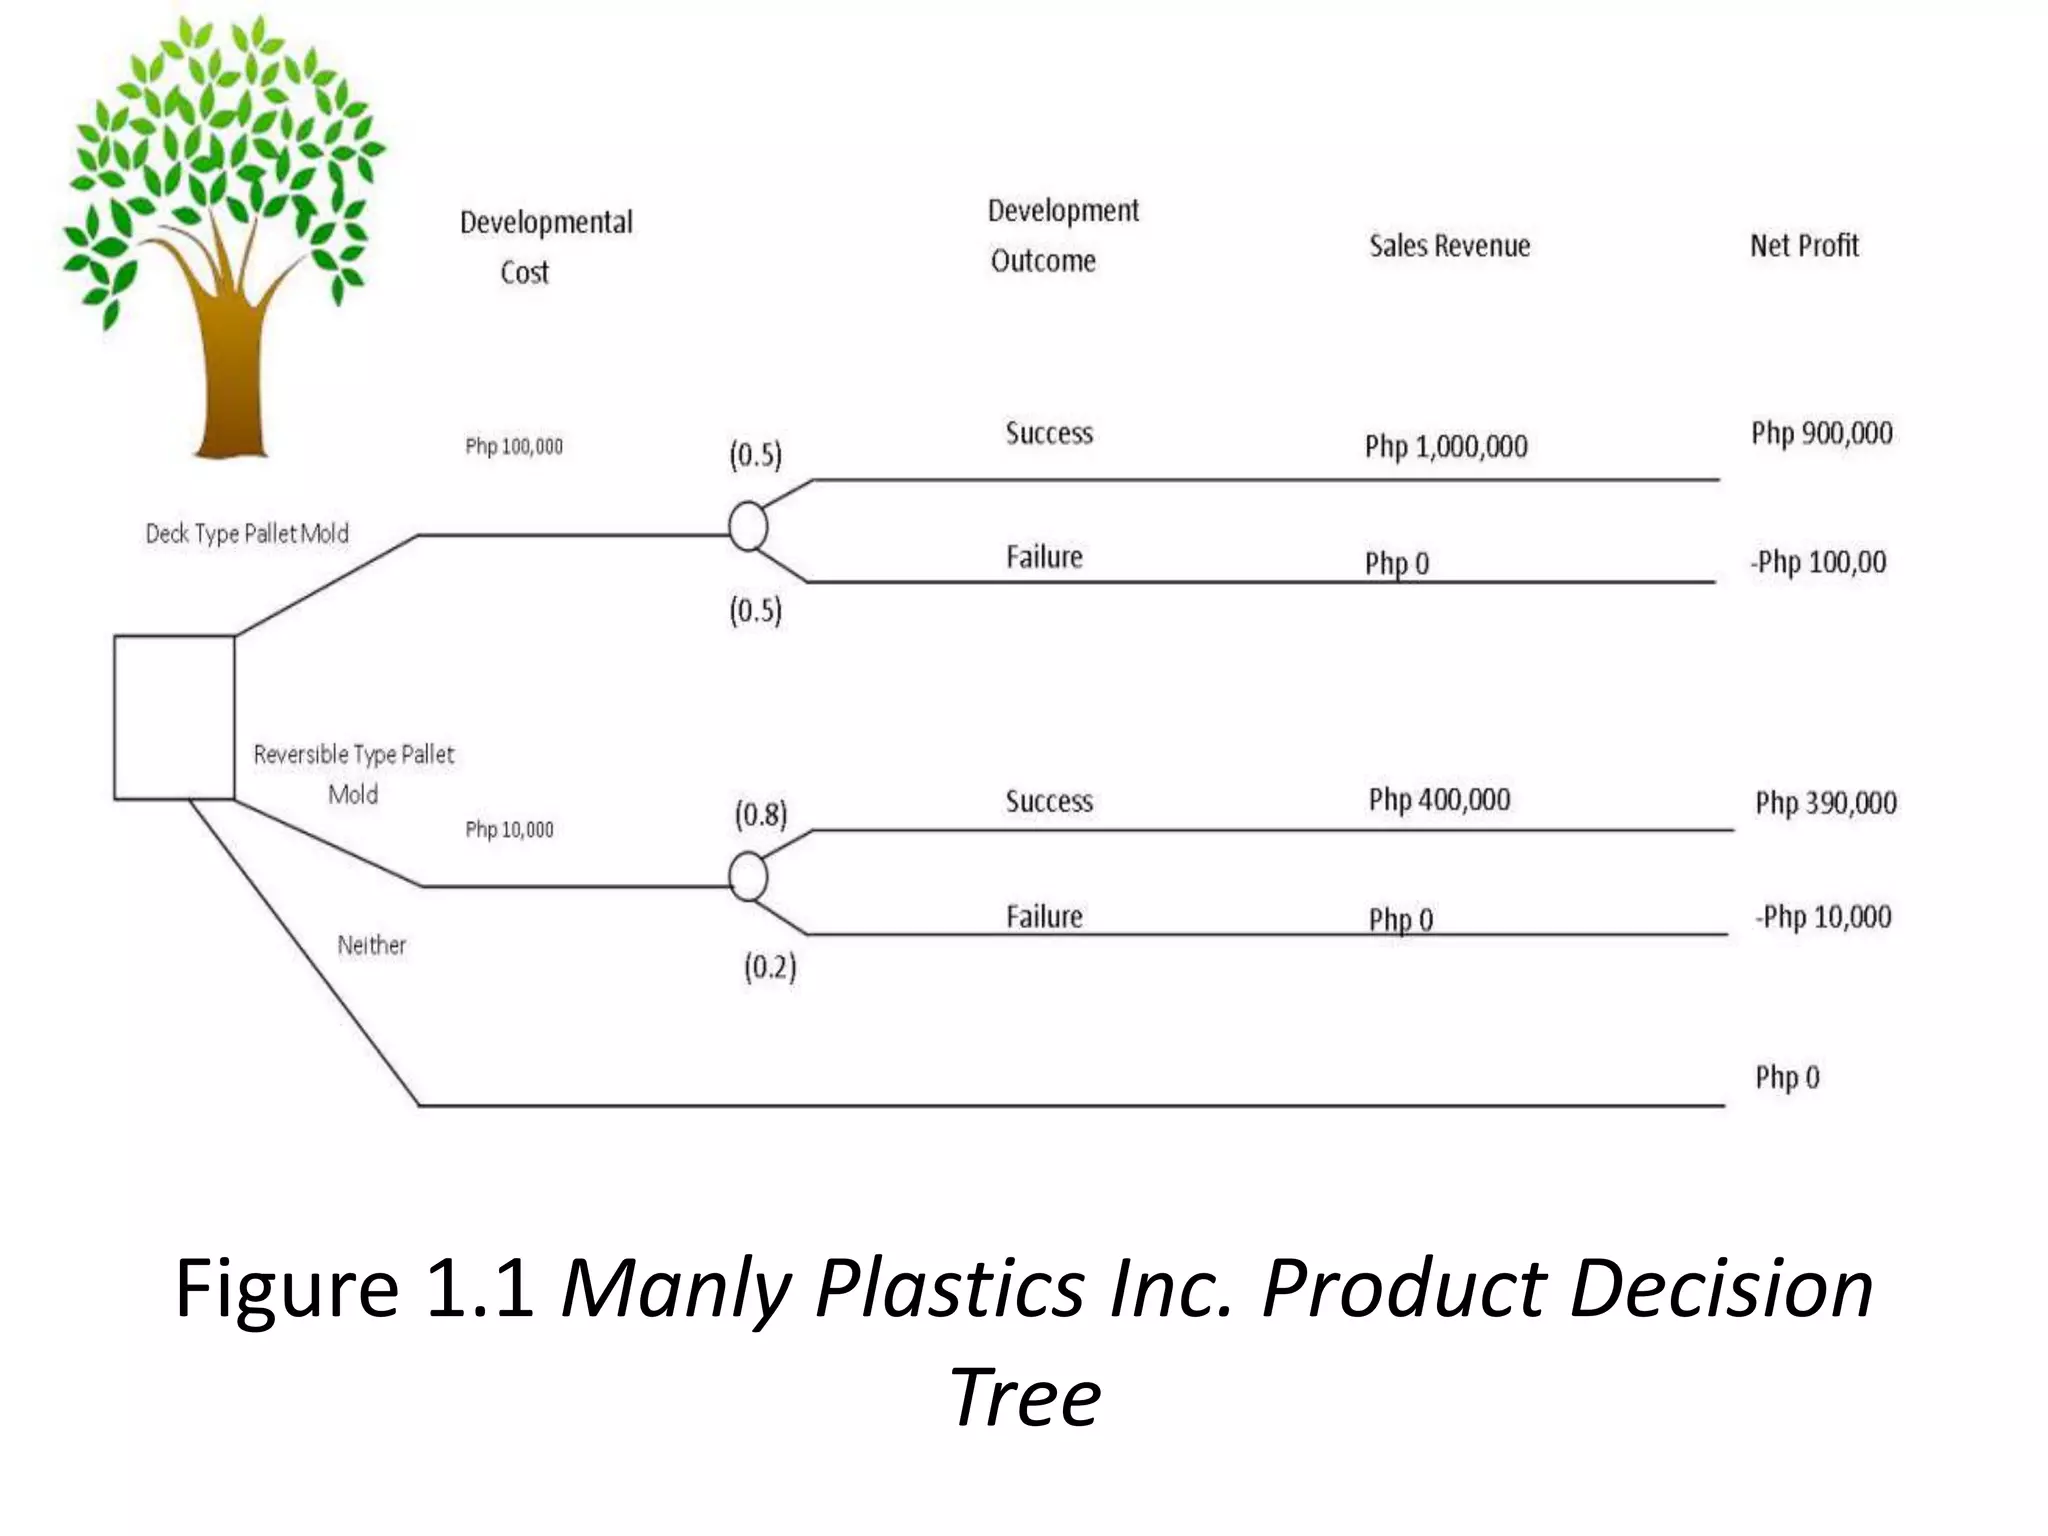
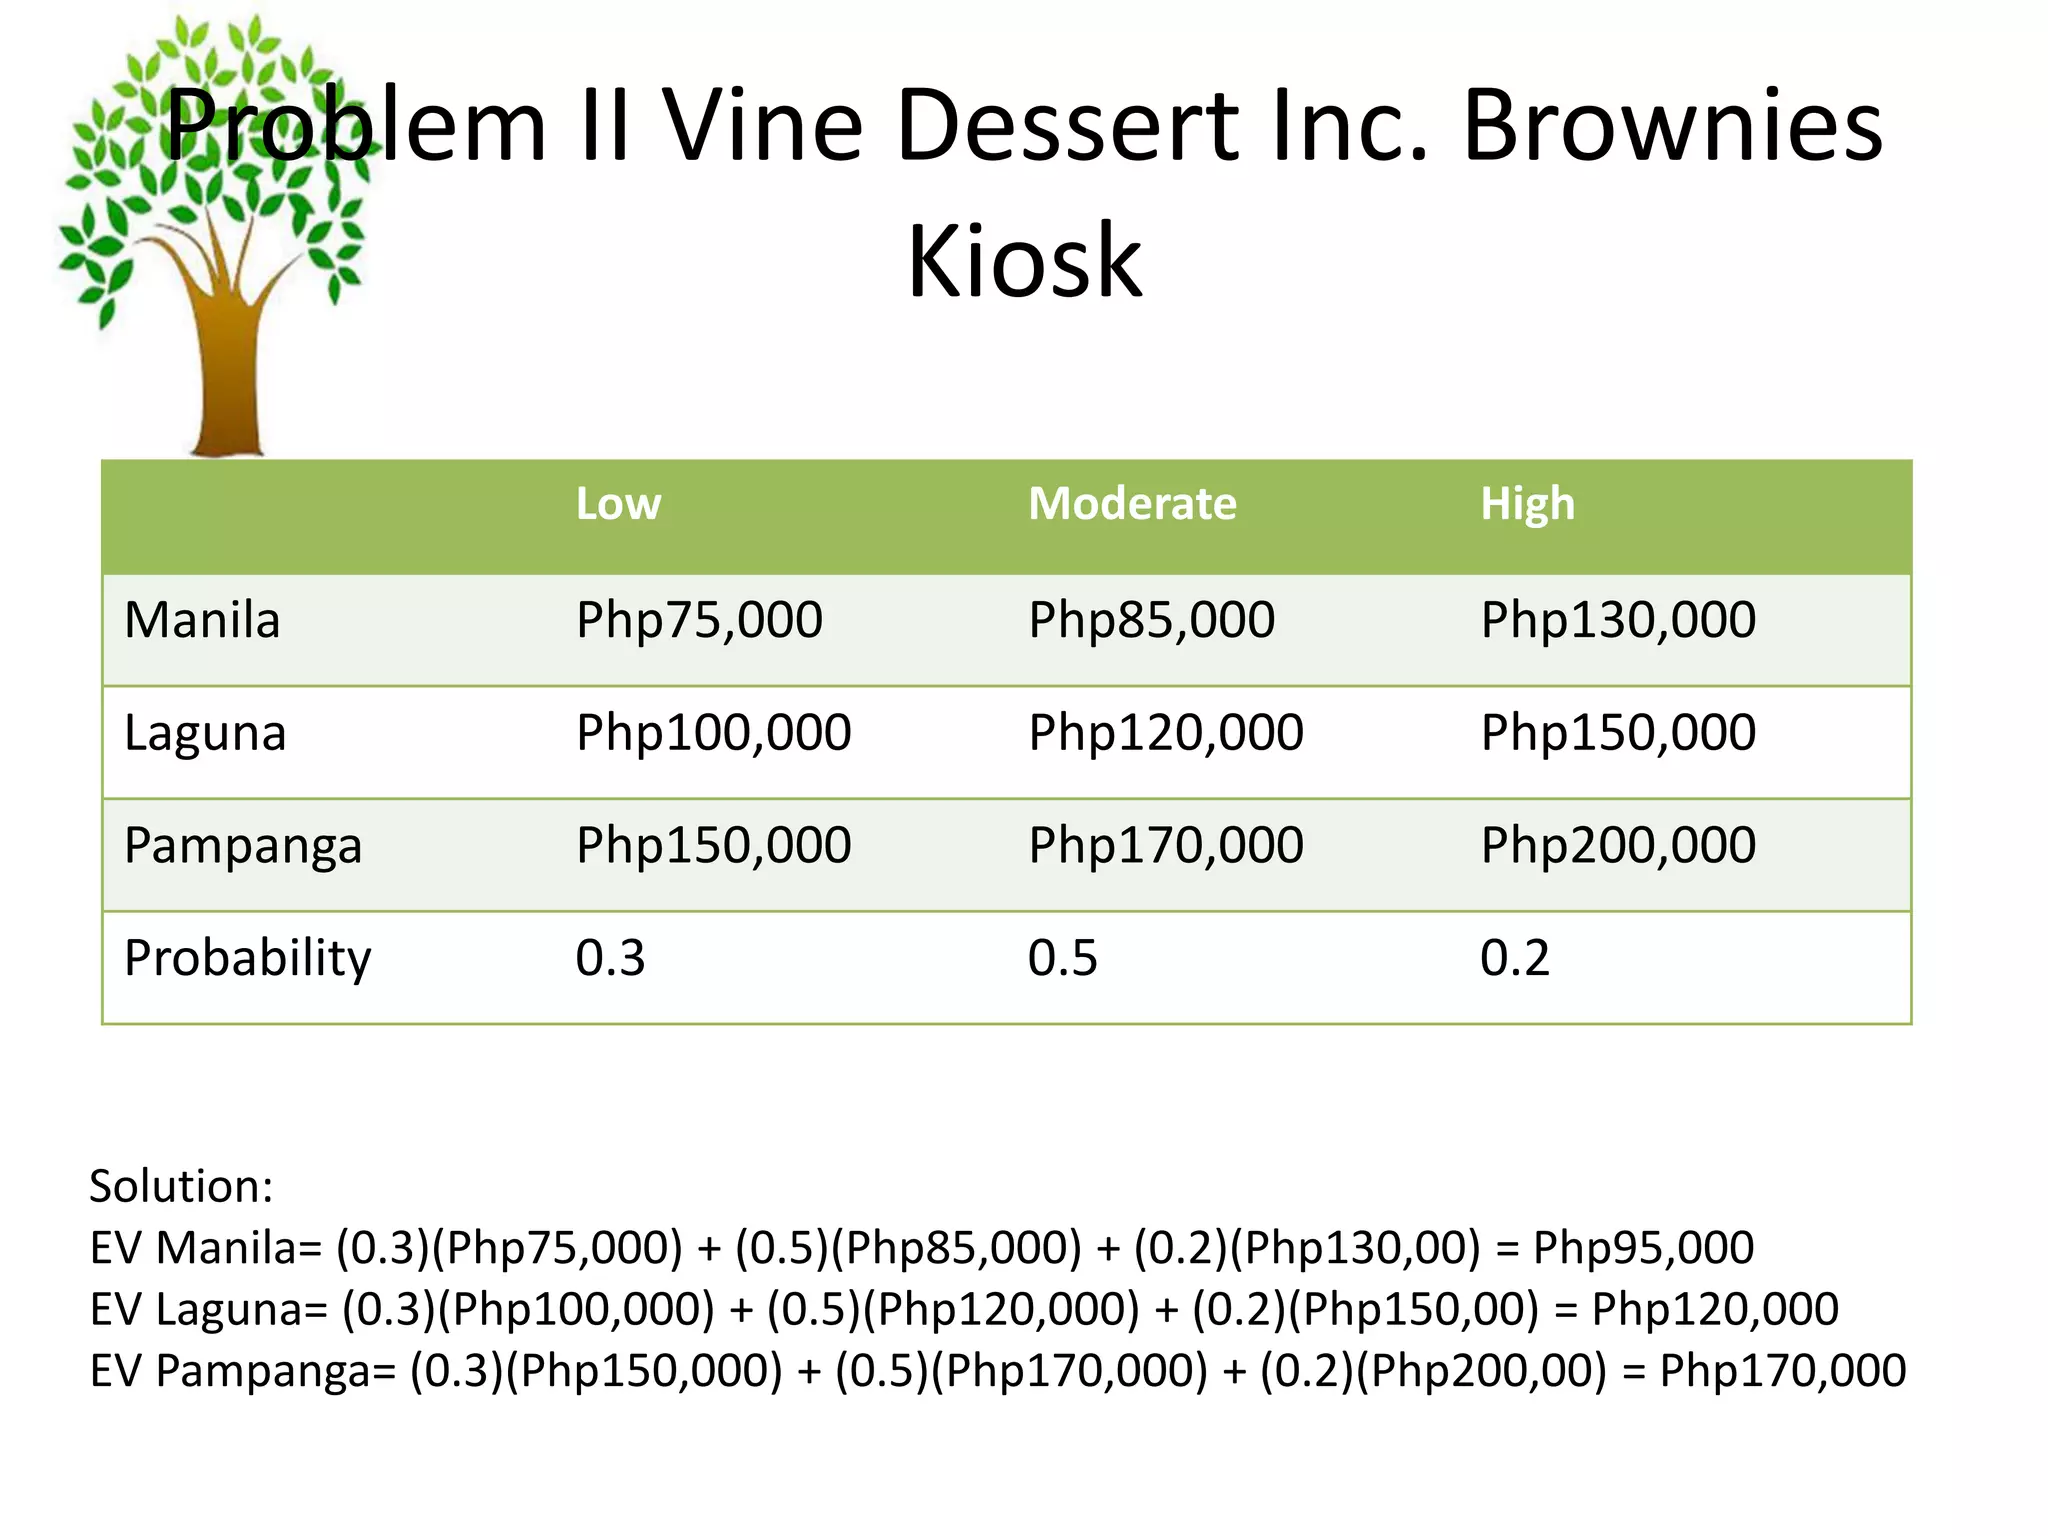


The document discusses decision trees, which are diagrams that illustrate decisions and their potential consequences. It provides examples of decision trees used by two companies - Manly Plastics and Vine Desserts - to analyze decisions about new product development and business location selection. It also discusses key concepts in decision trees, including decision nodes, chance nodes, expected value calculations, and how decision trees can be used for regression and survival analysis involving continuous or time-to-event outcomes.