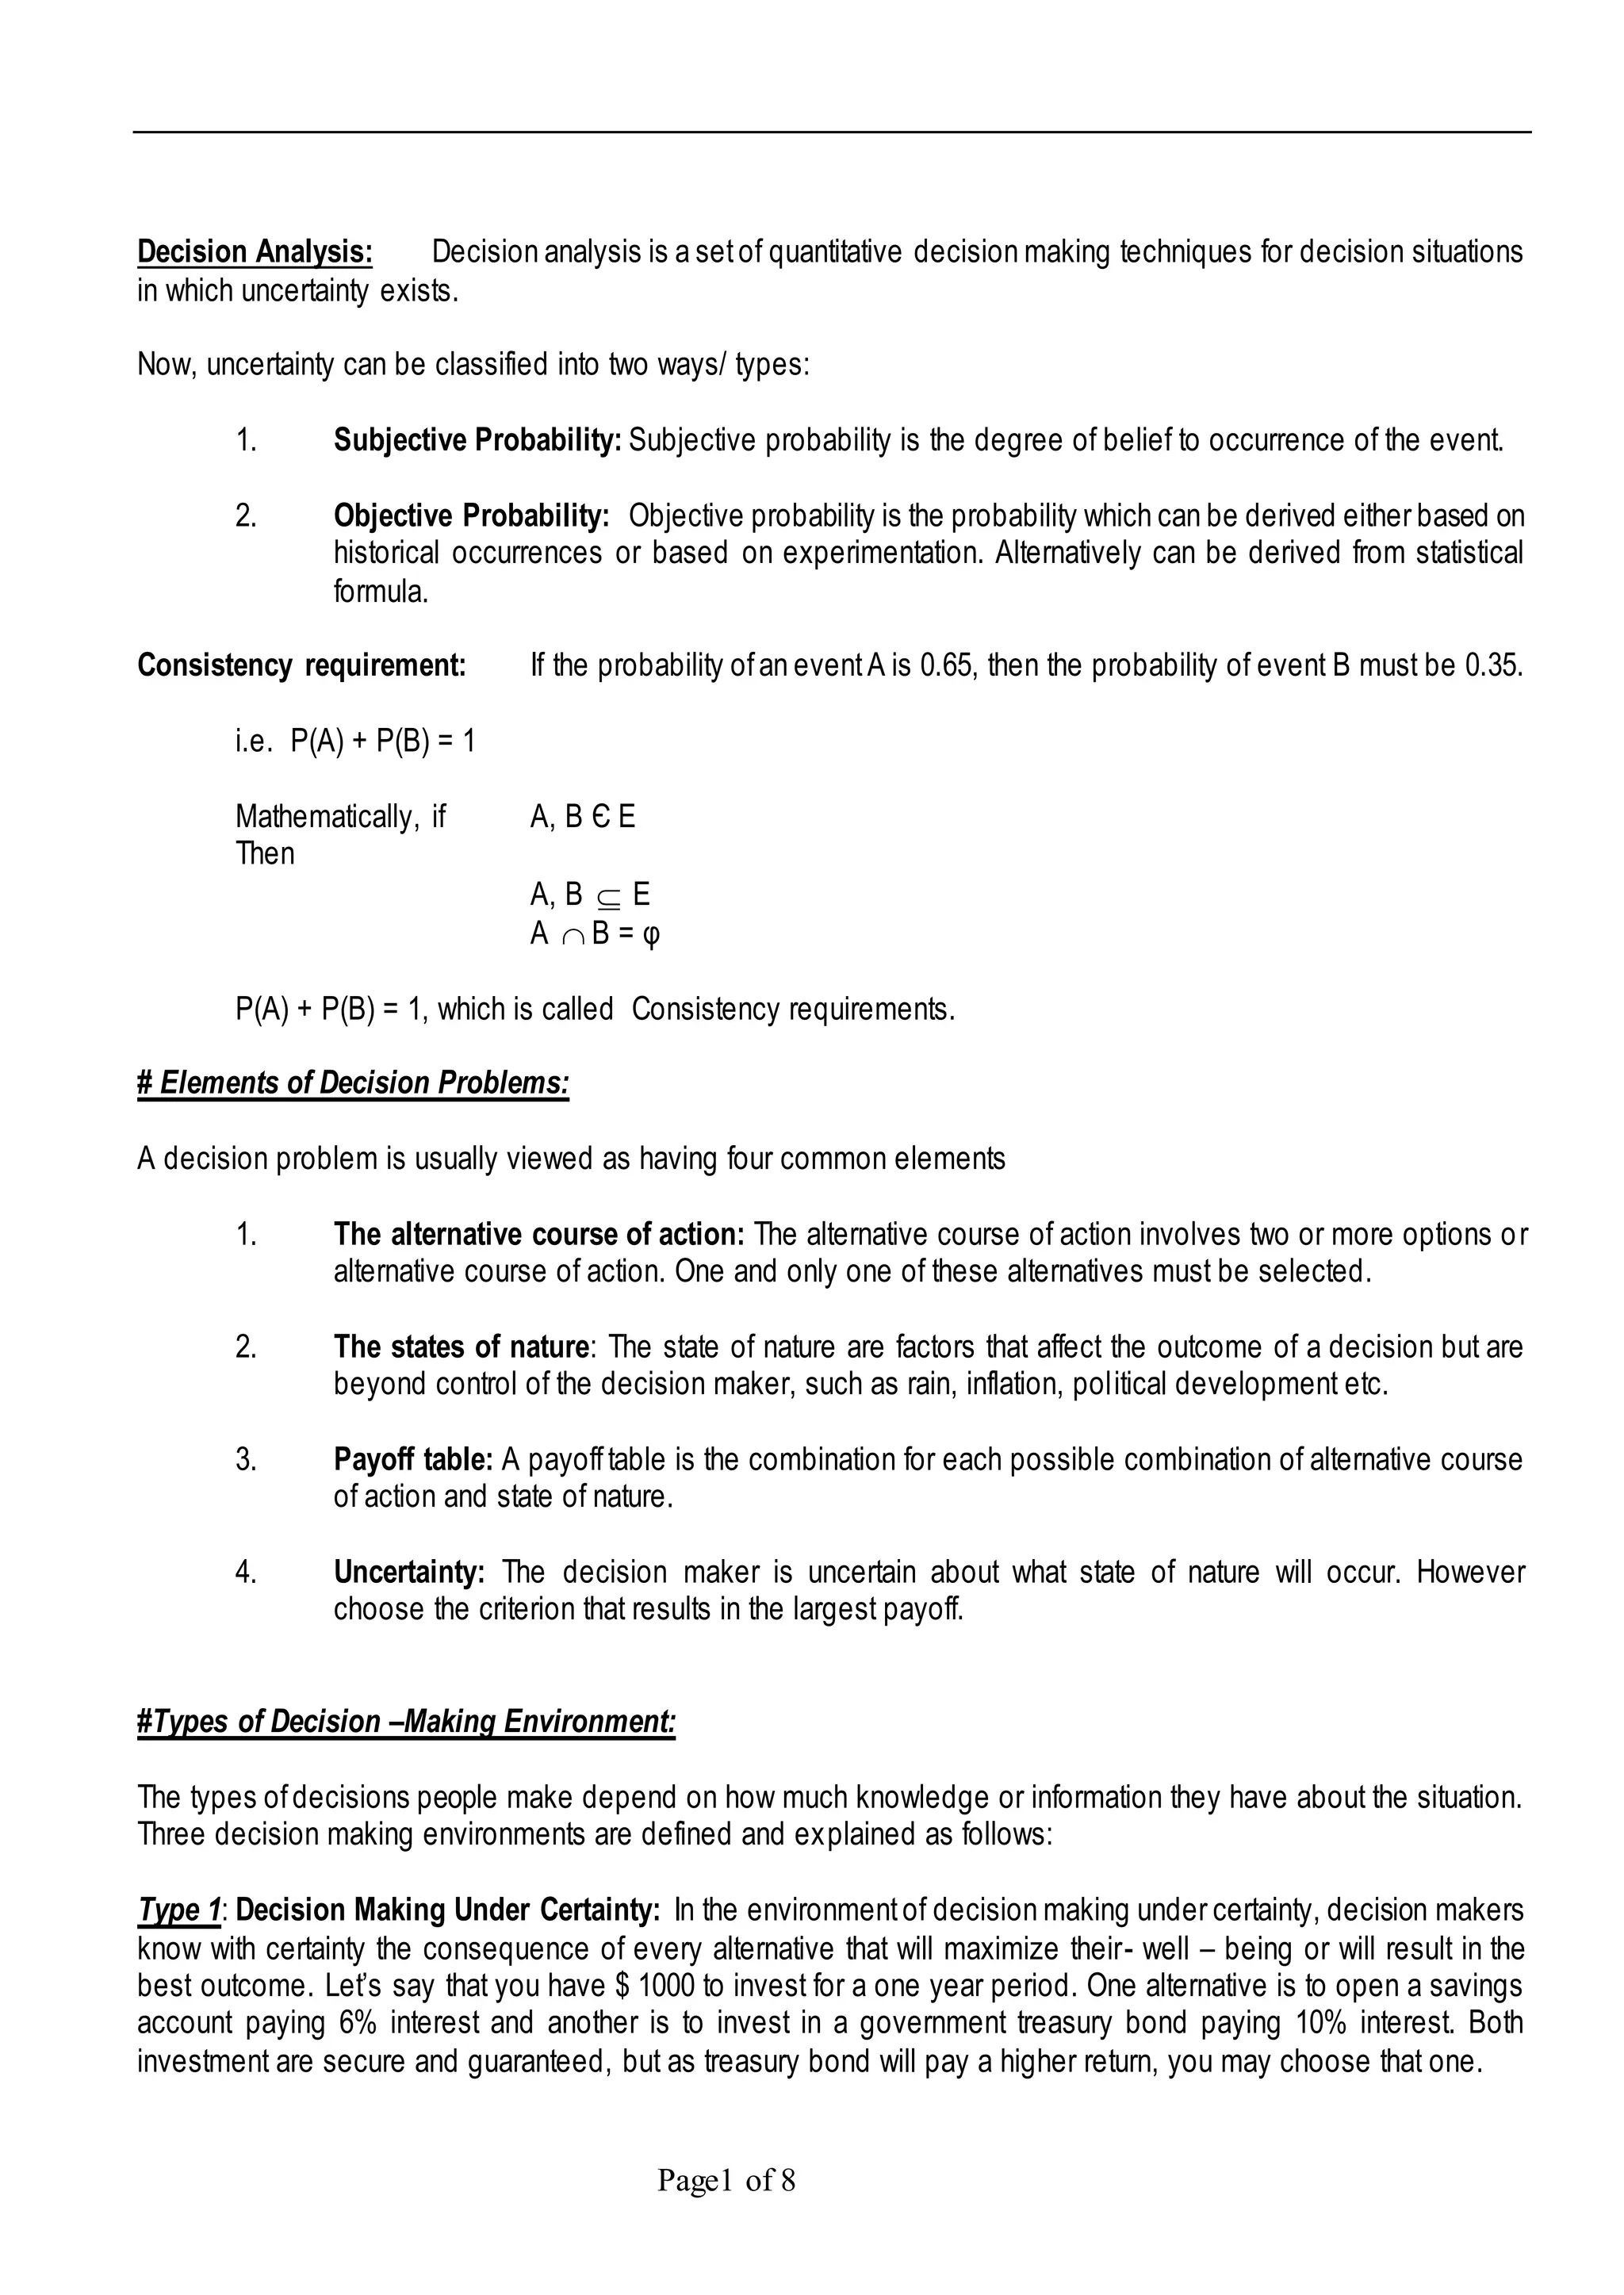
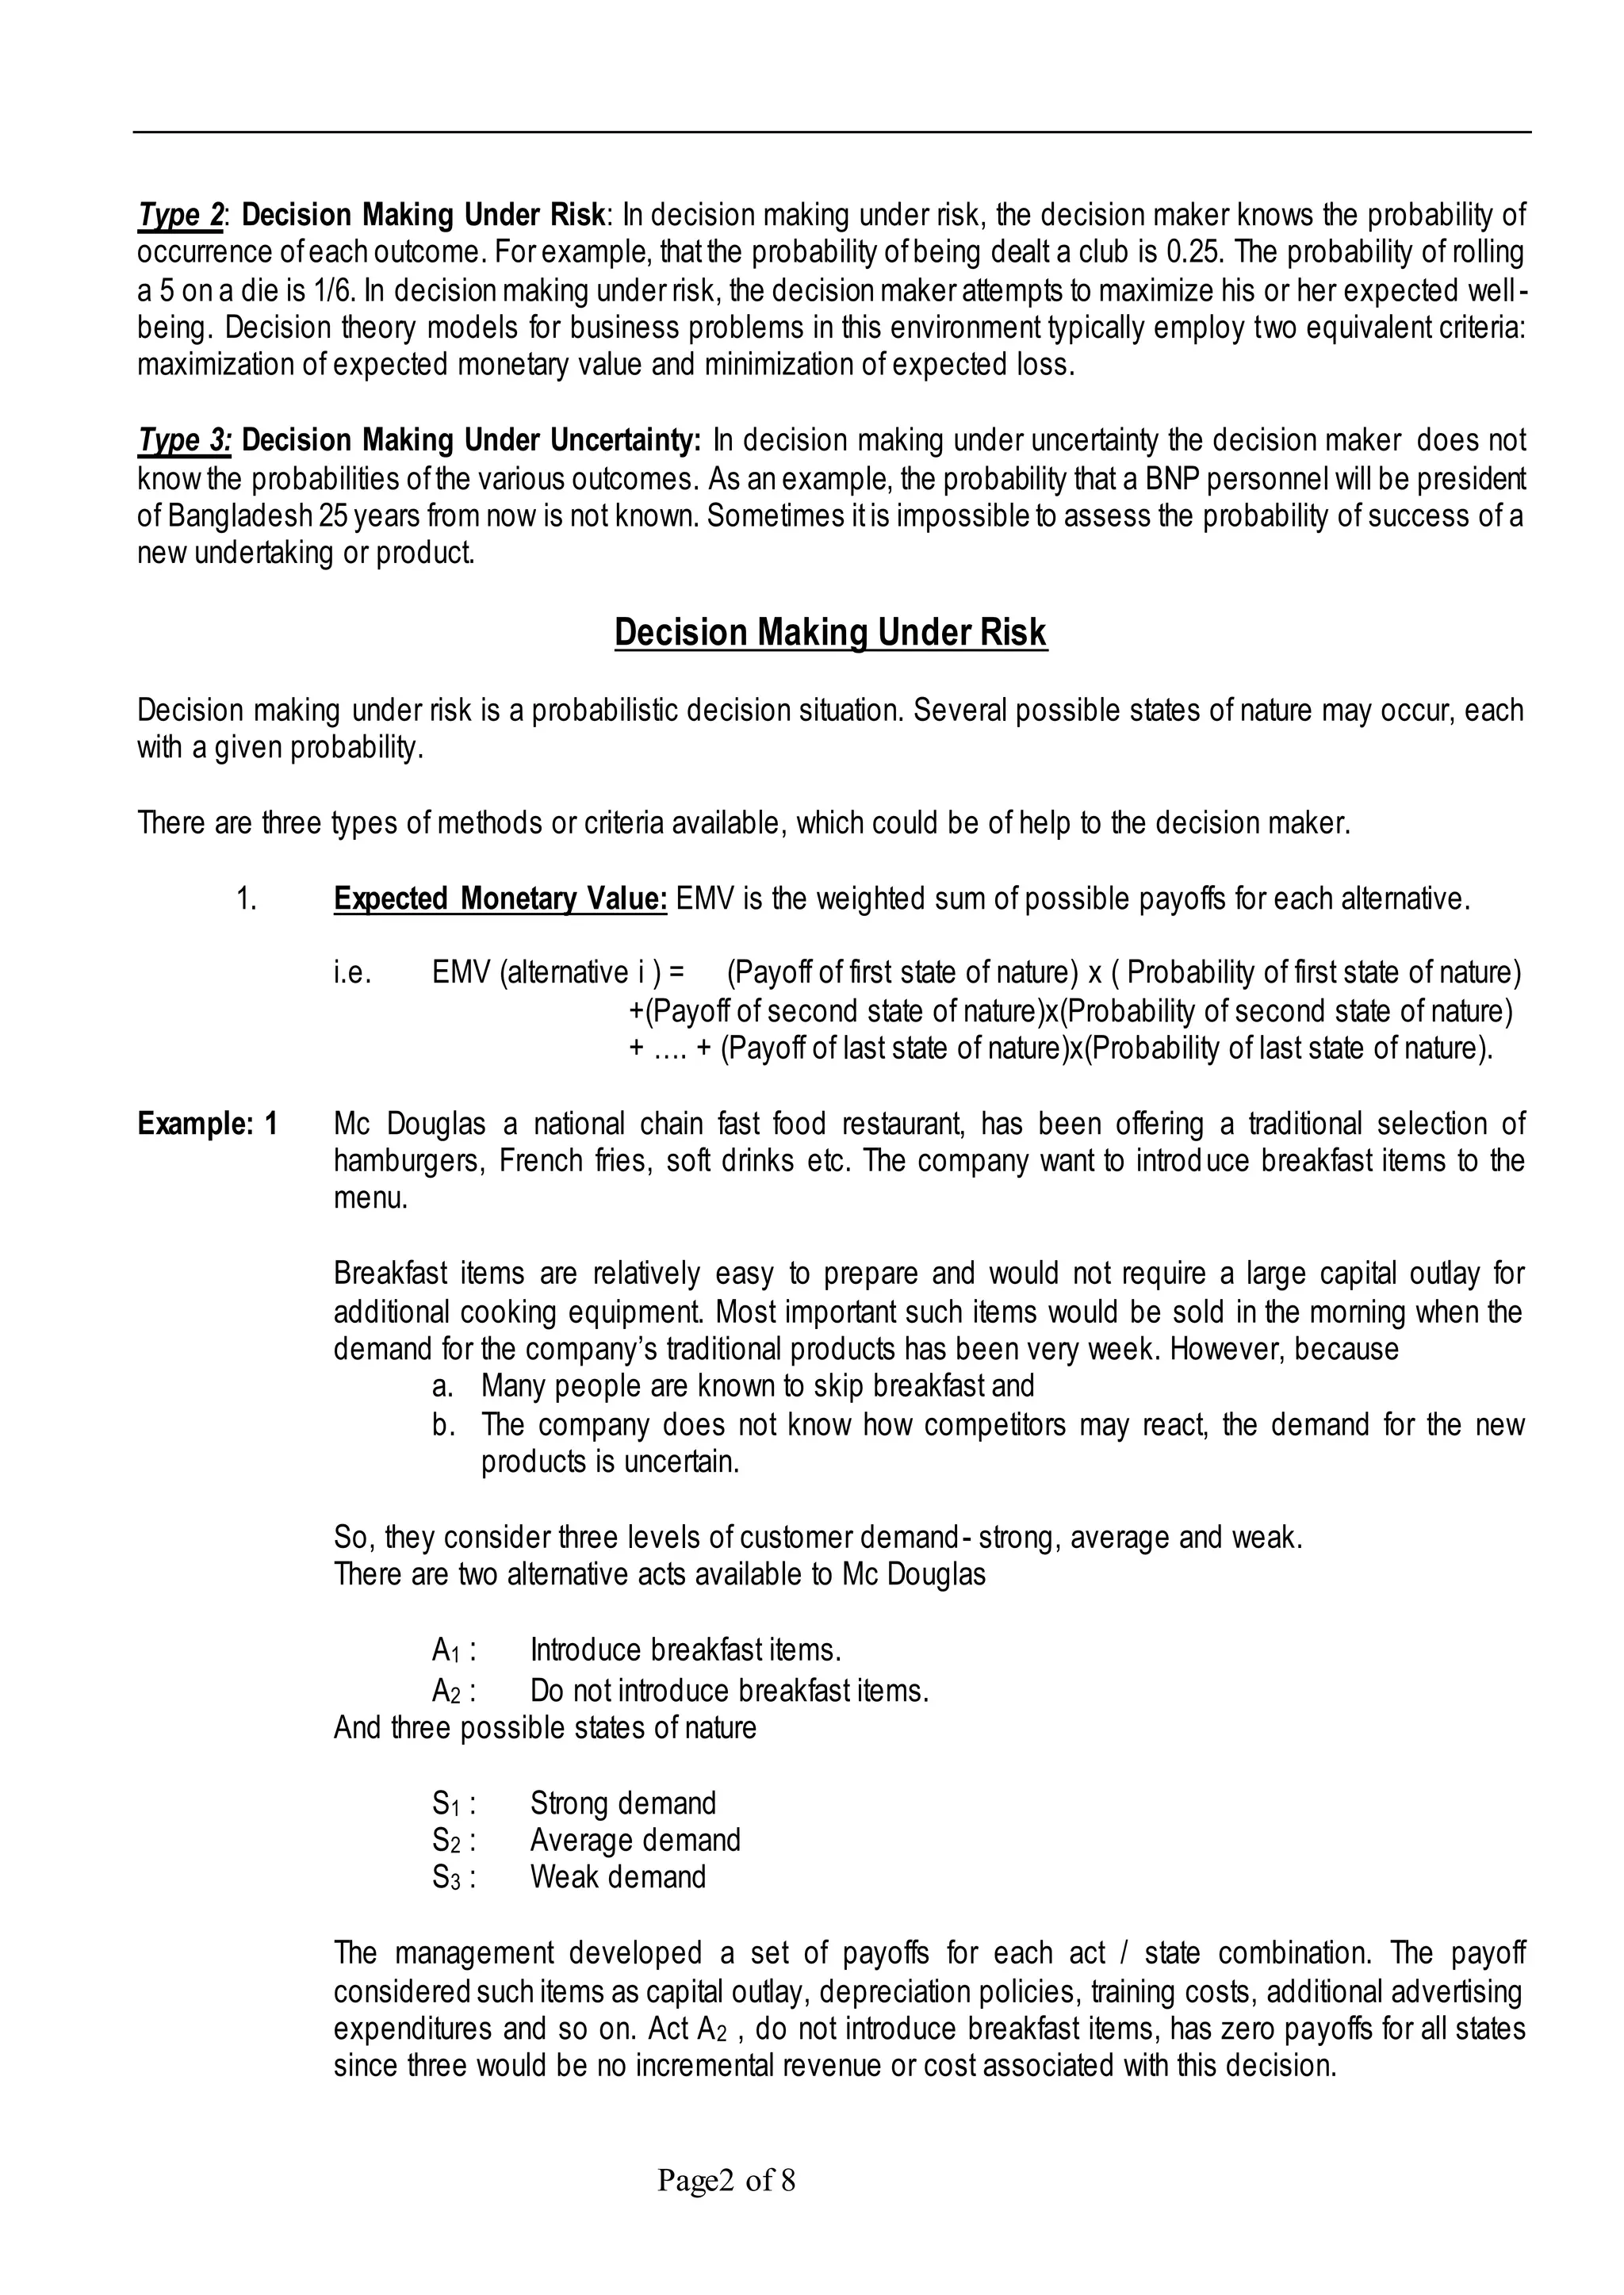
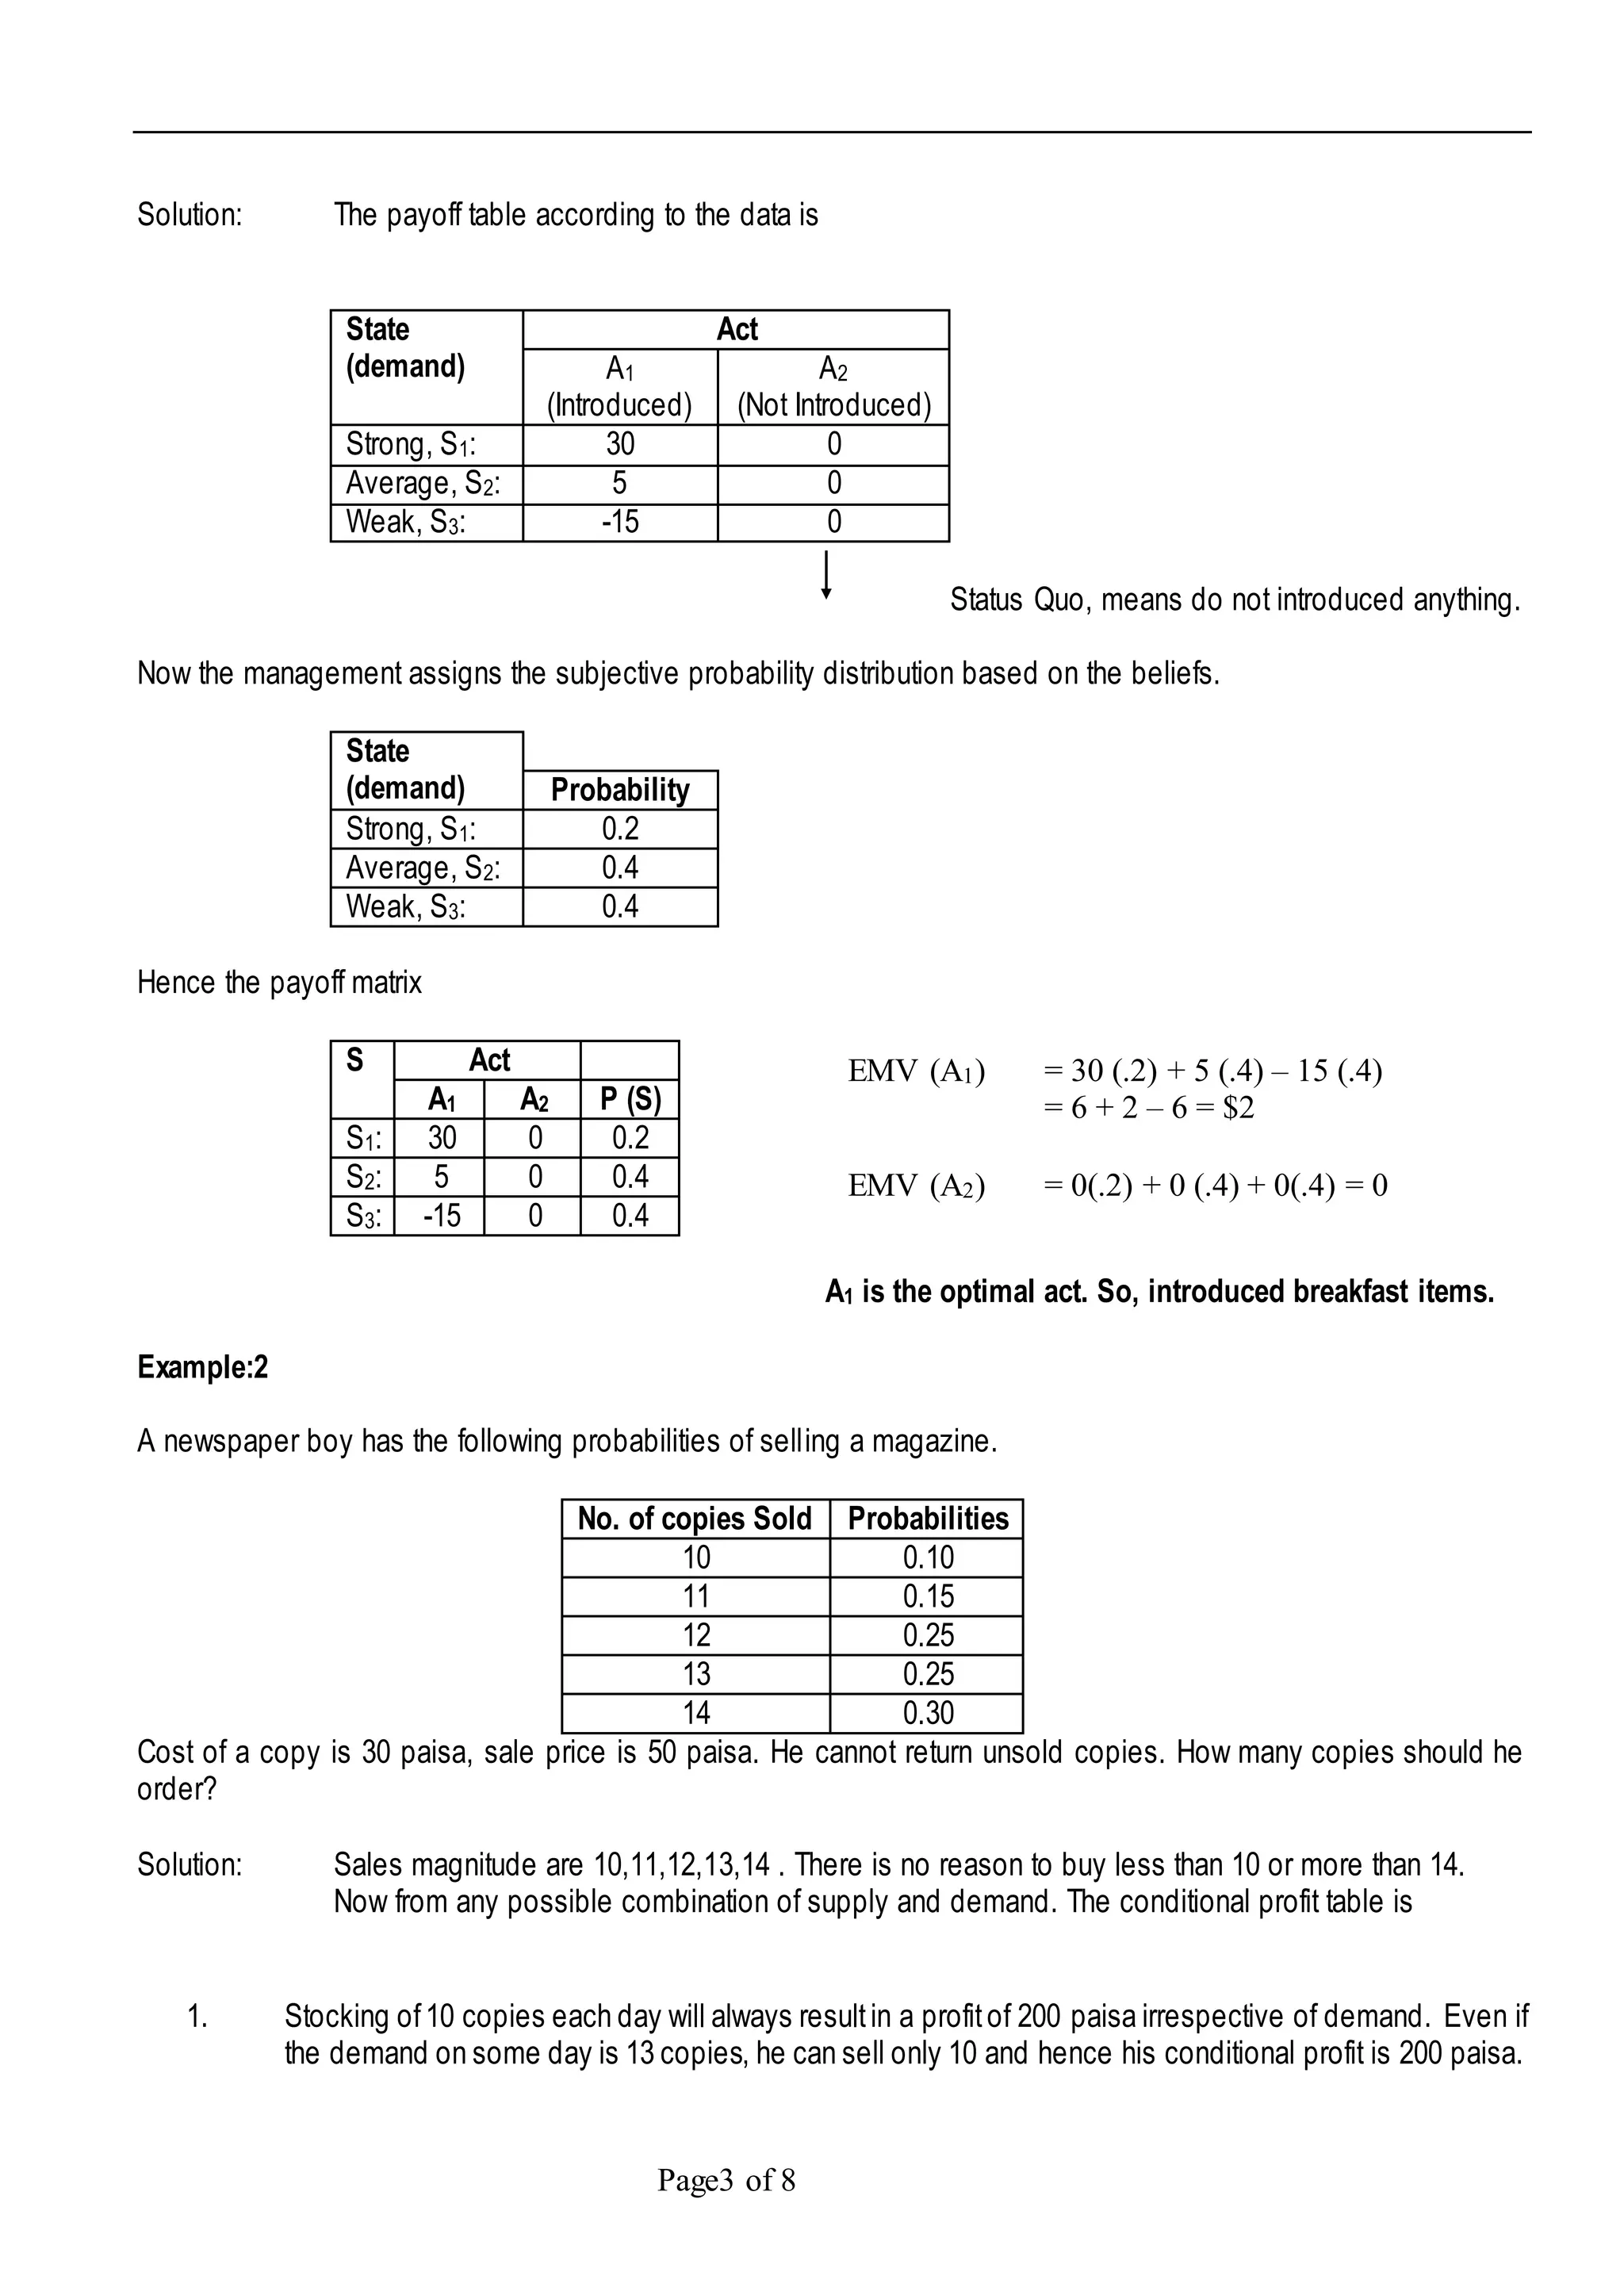
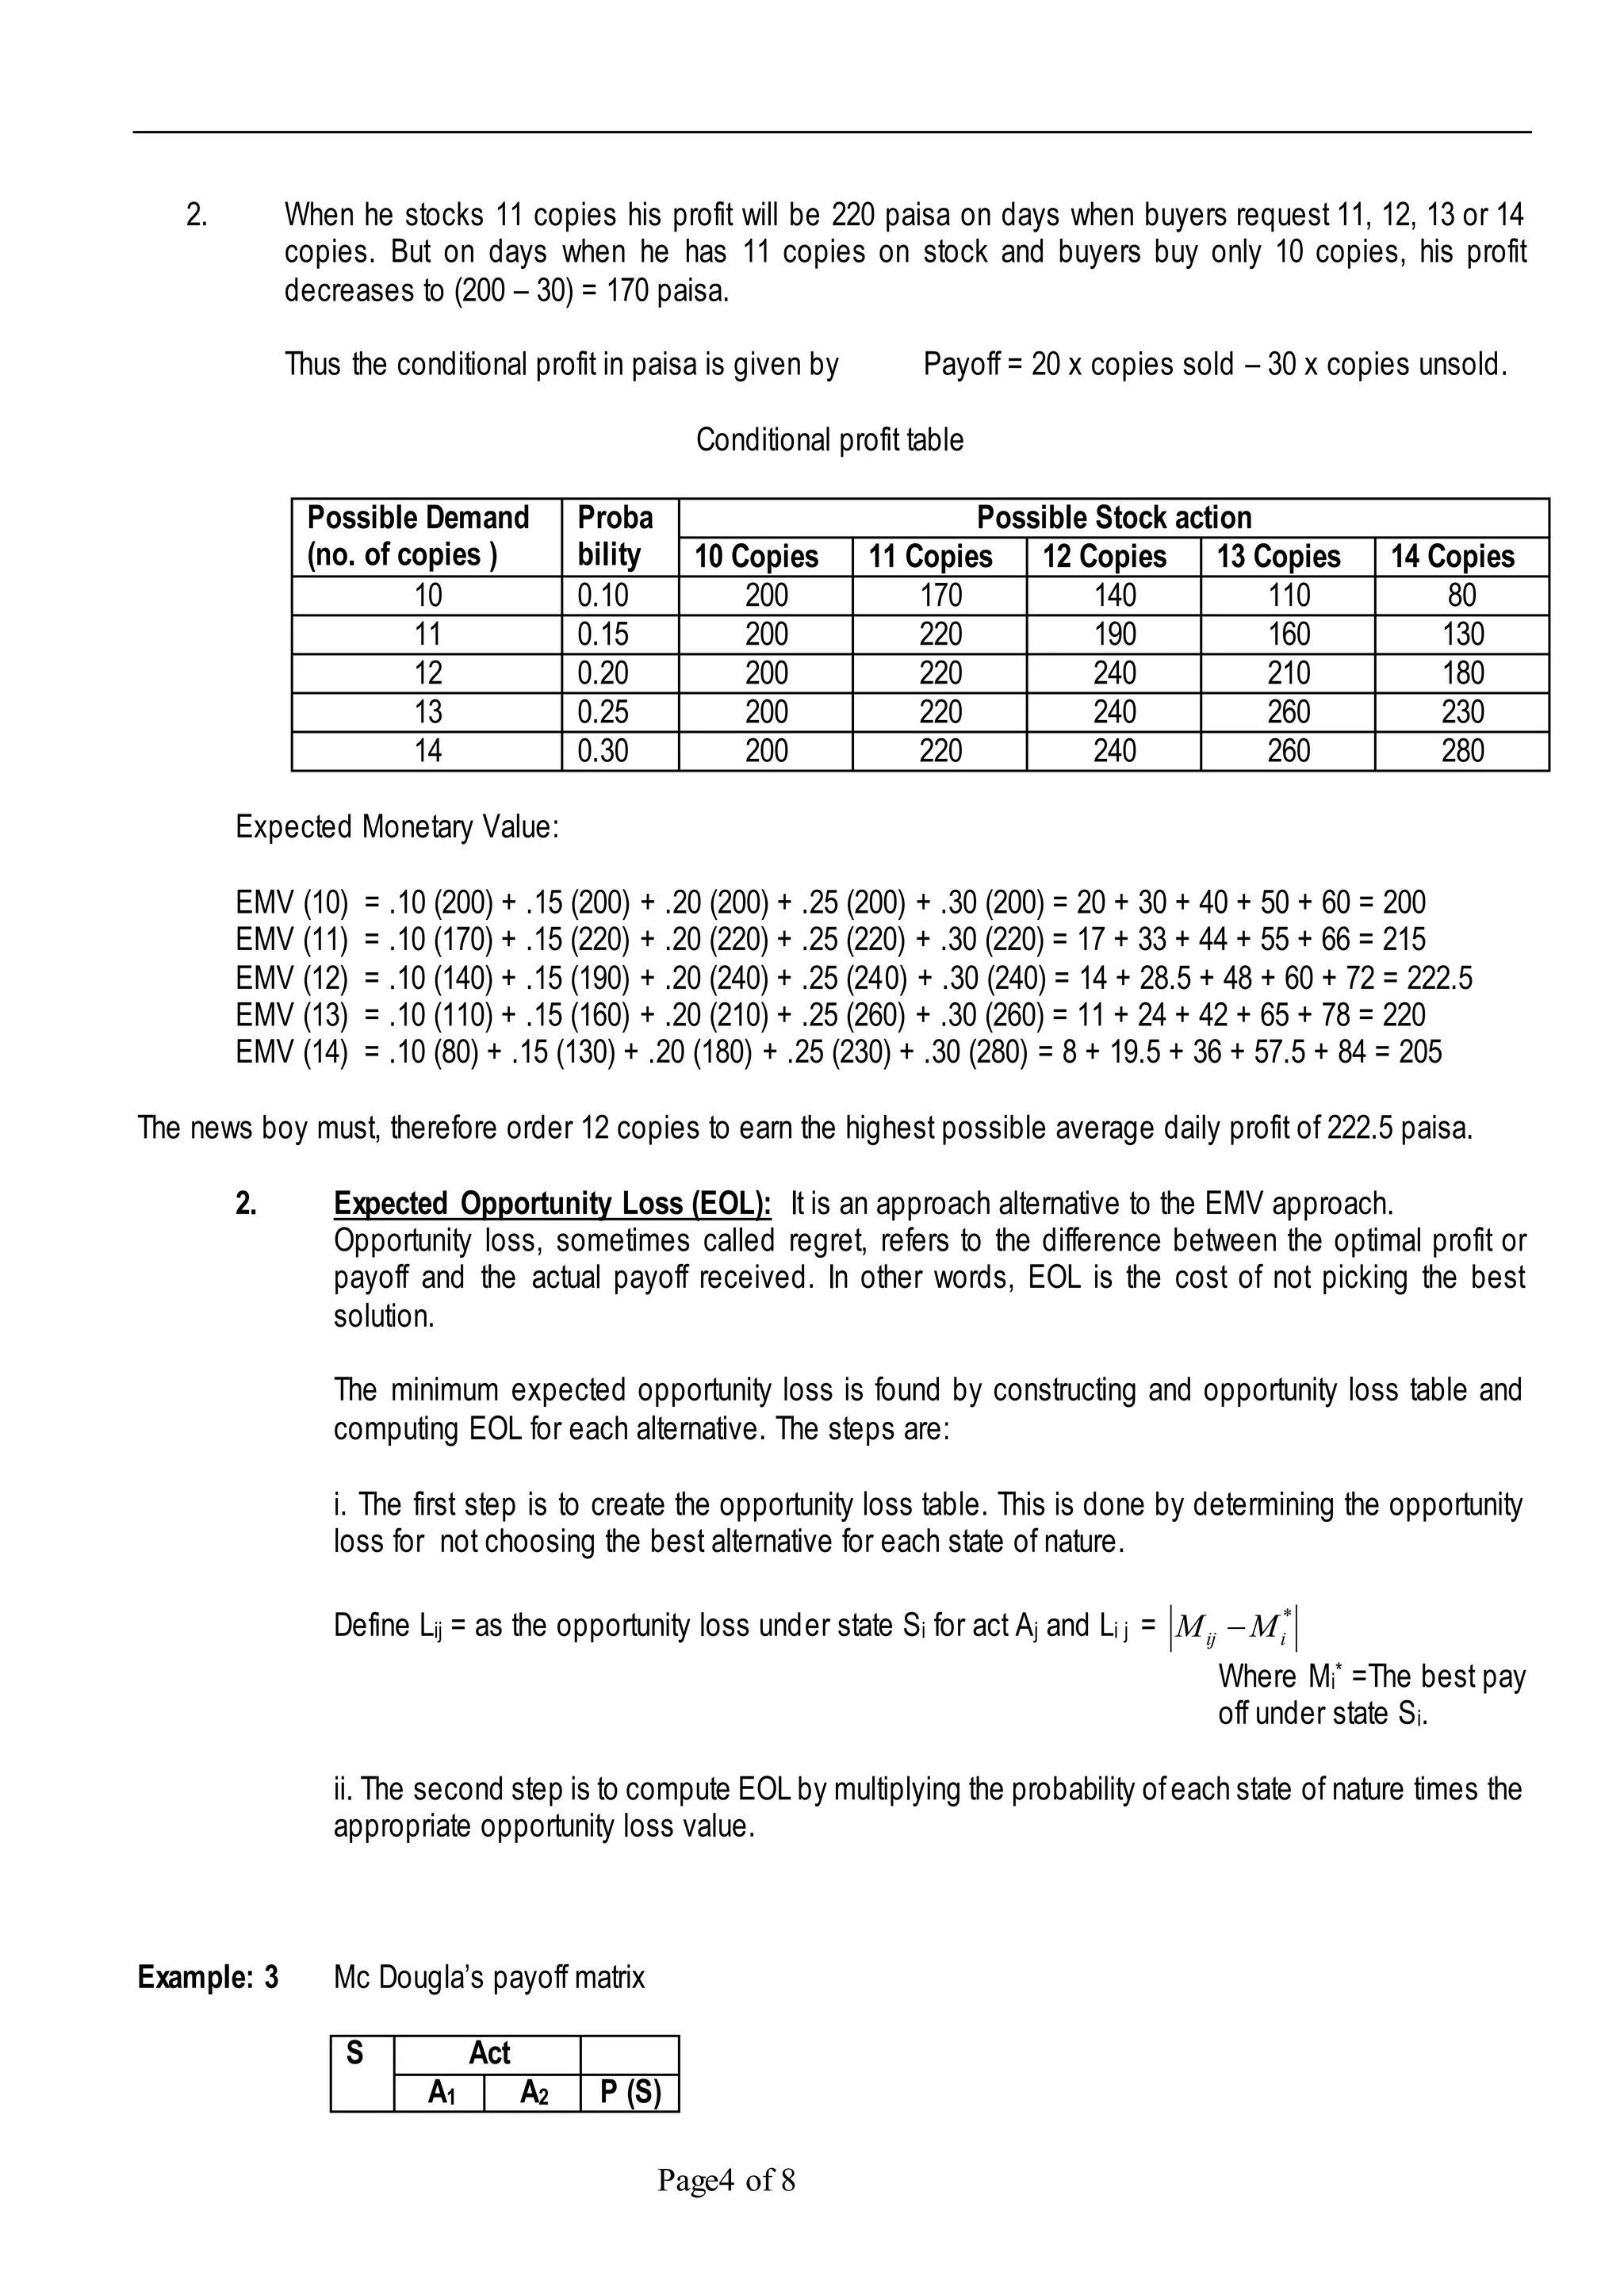
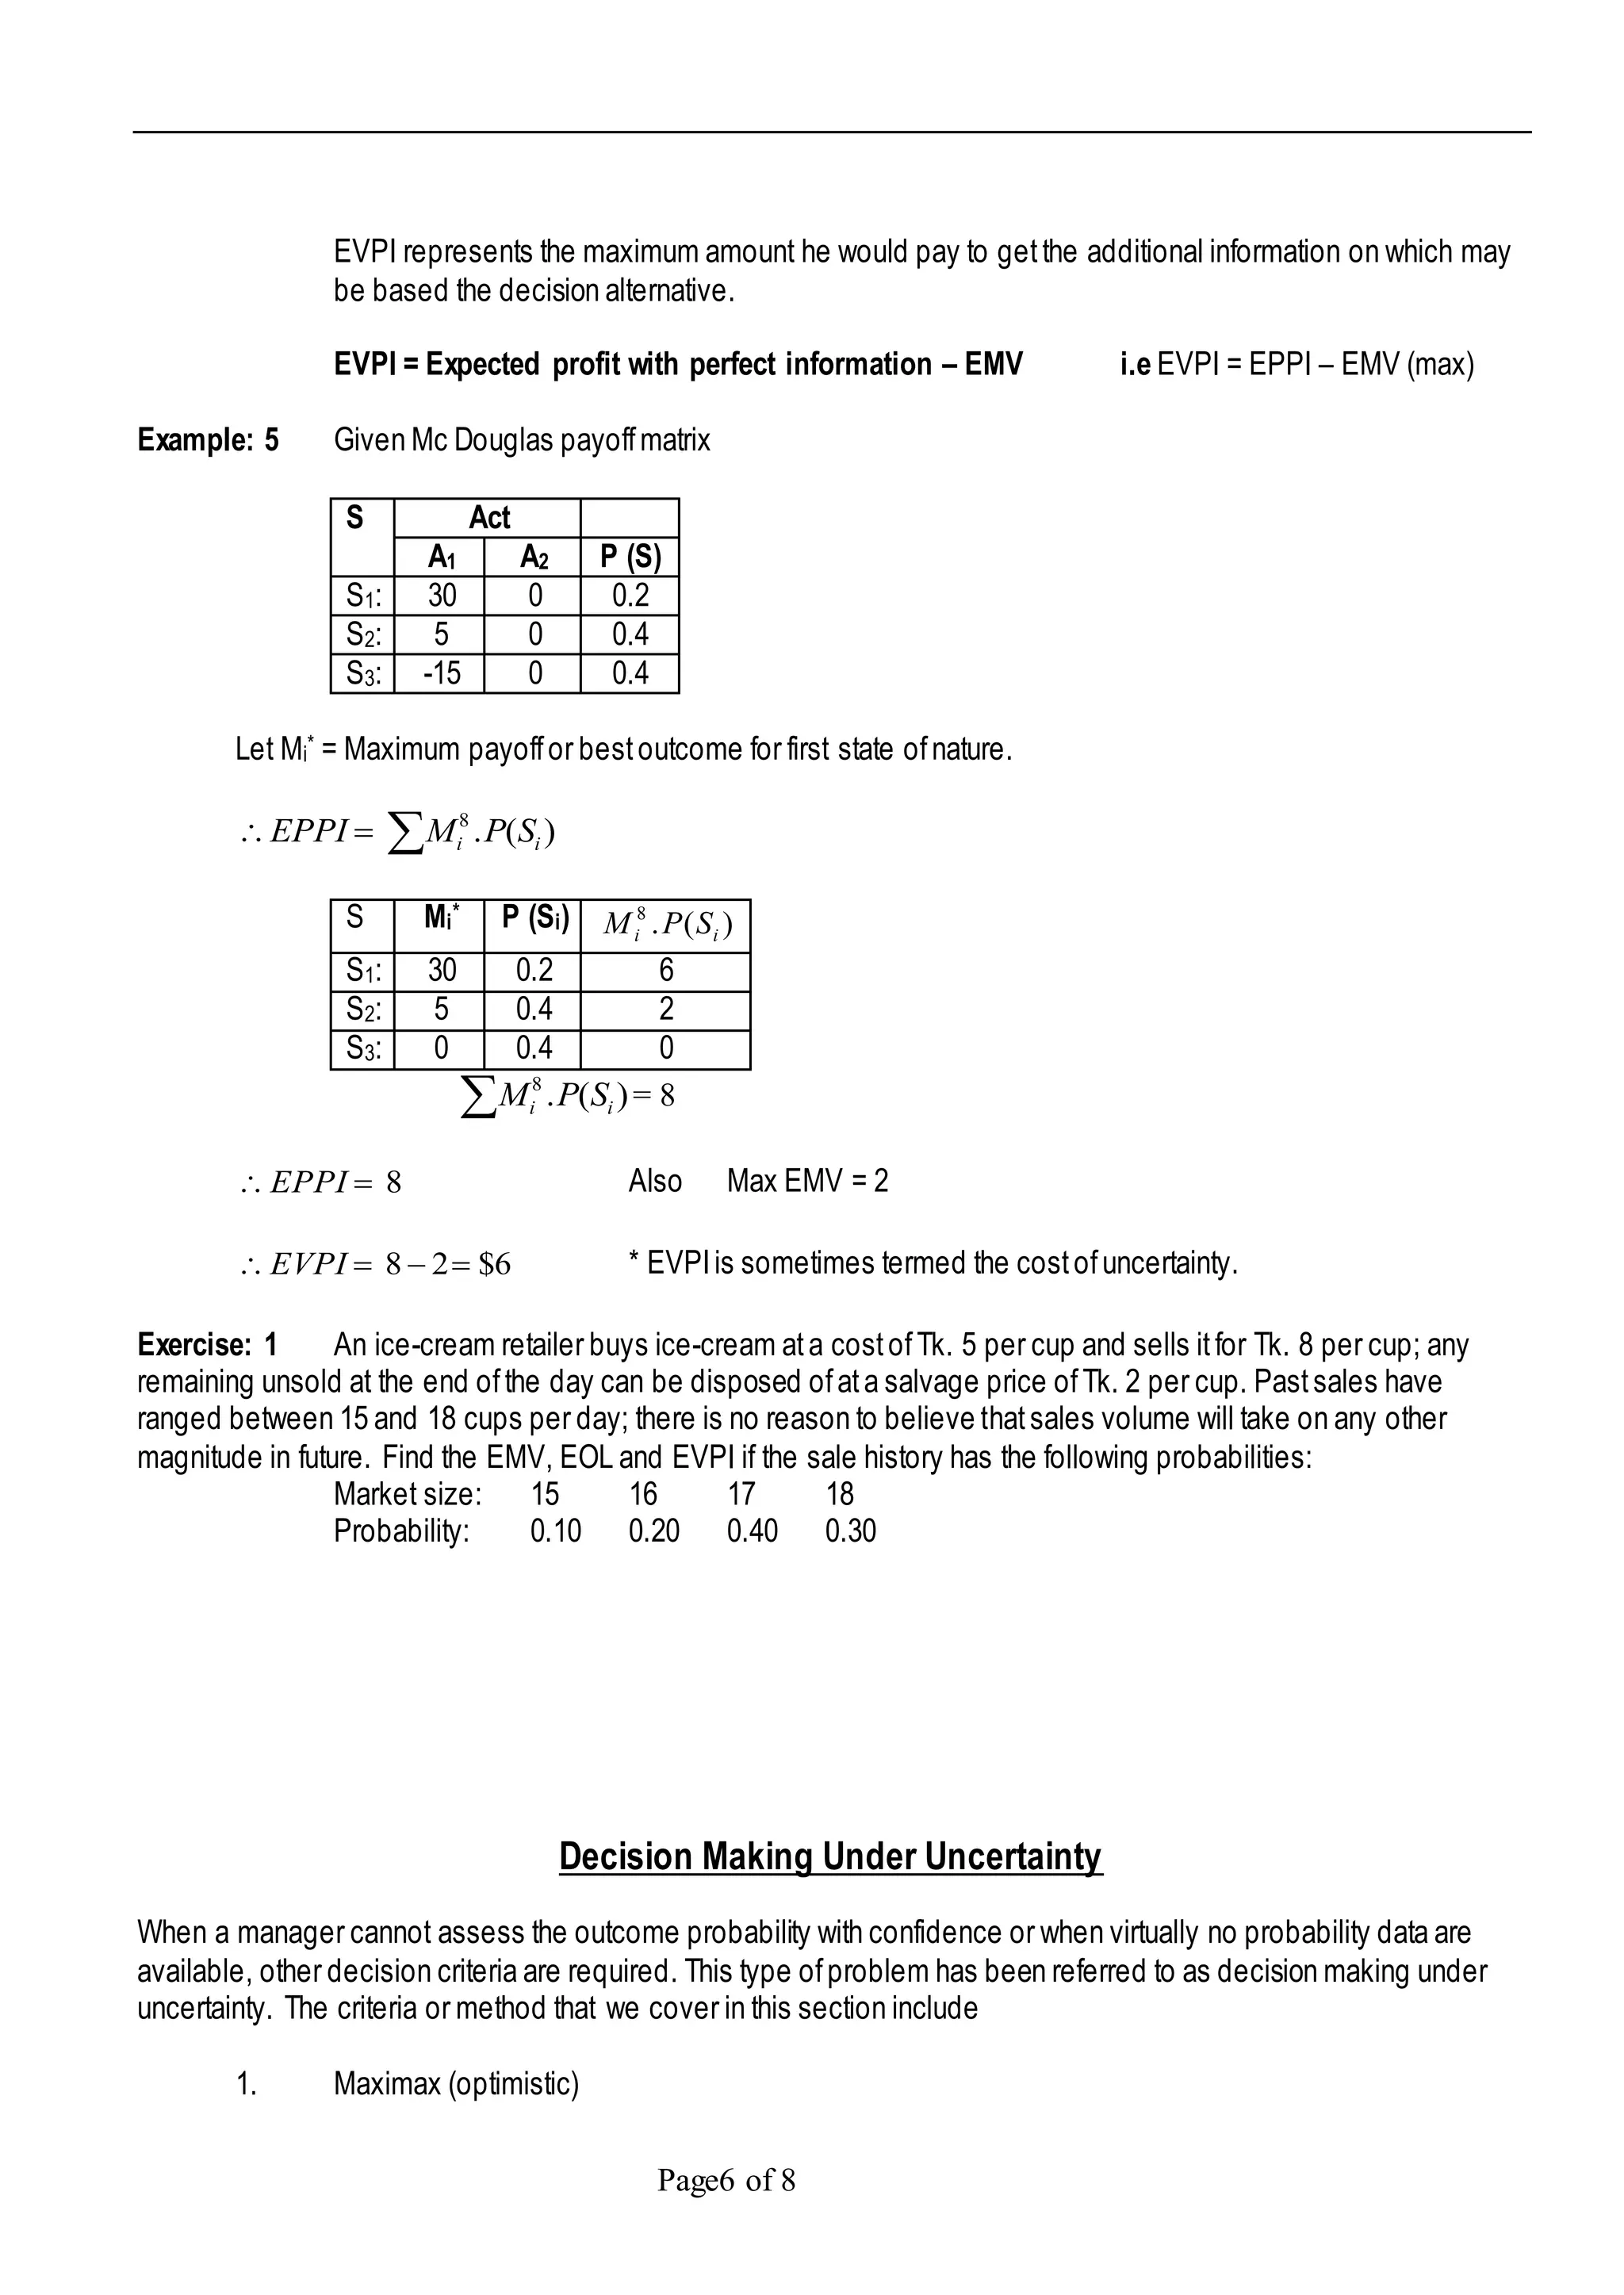
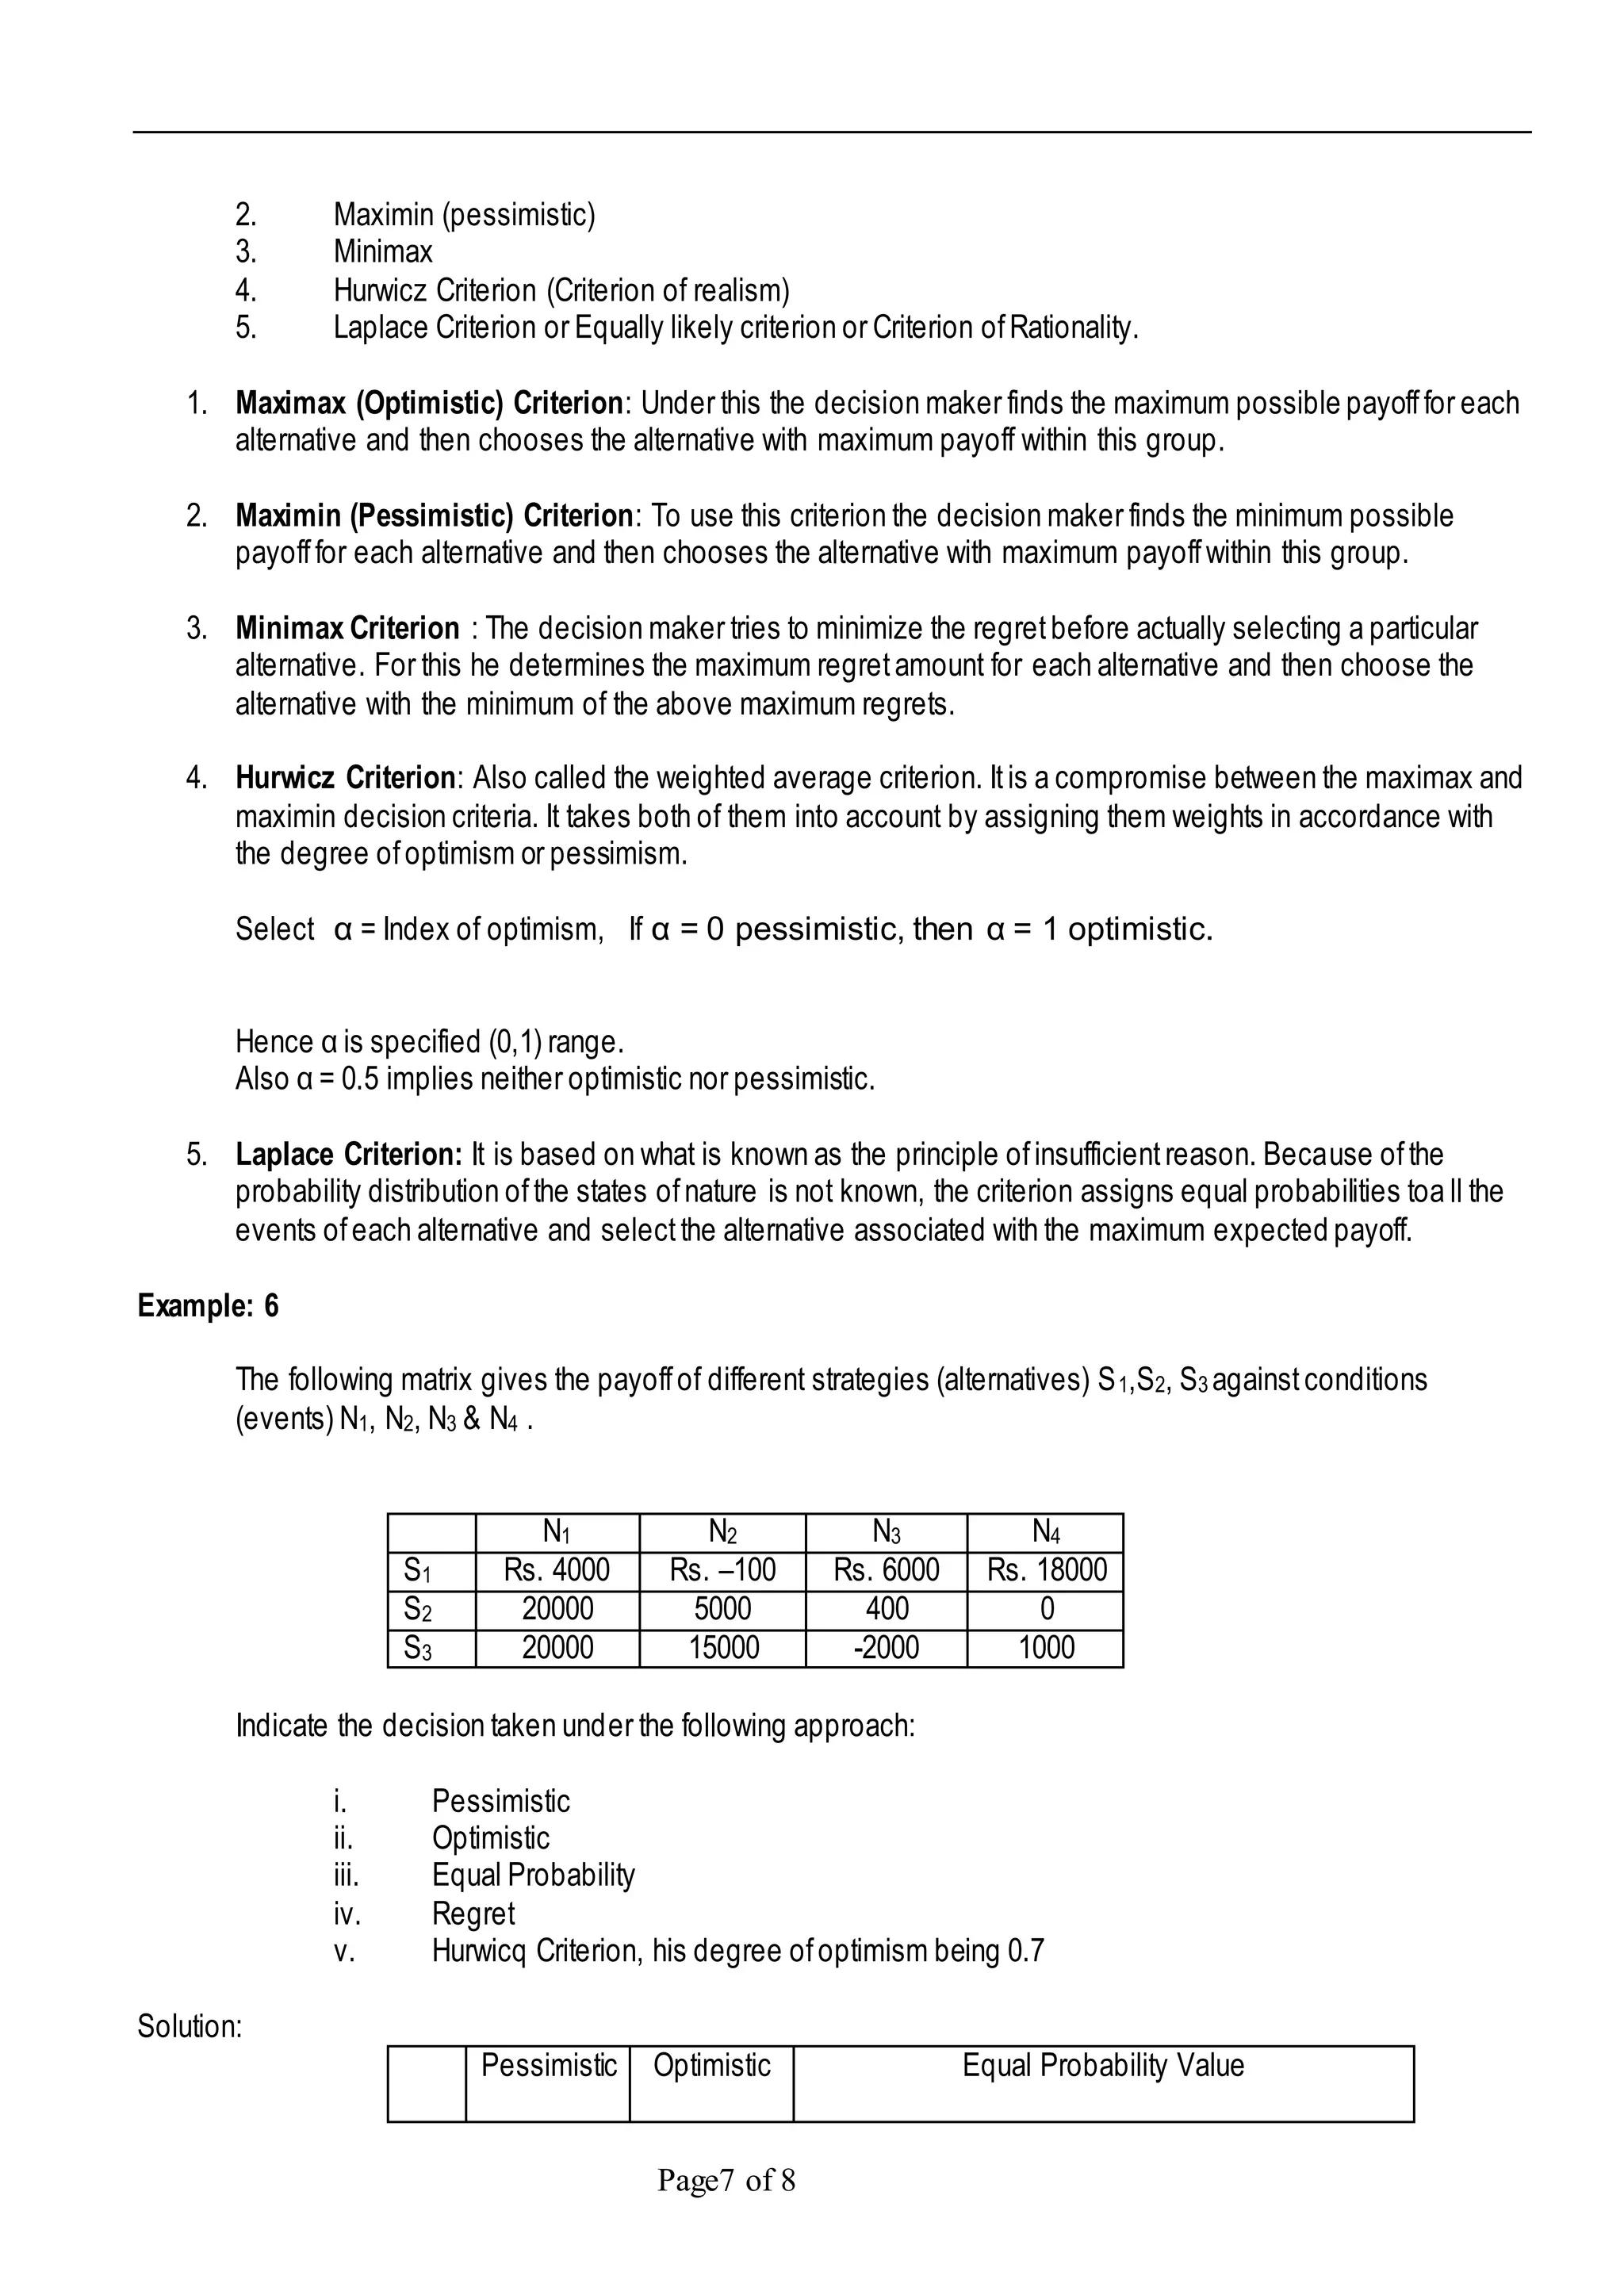
This document discusses various techniques for decision making under uncertainty. It defines subjective and objective probabilities, and consistency requirements for probabilities. It describes the key elements of decision problems including alternatives, states of nature, payoff tables, and uncertainty. It defines three types of decision making environments: certainty, risk, and uncertainty. For decision making under risk, it discusses expected monetary value, expected opportunity loss, and expected value of perfect information as decision criteria. It provides examples to illustrate these concepts and techniques. Finally, it outlines several criteria that can be used for decision making under uncertainty including maximax, maximin, and minimax.
This document discusses decision tree analysis. It provides definitions and examples of decision trees. A decision tree is a graphical representation of decision making that uses nodes to represent decisions, chances, and outcomes. It can be used to identify the strategy most likely to reach a goal. The document includes an example problem where a glass factory is considering three courses of action based on future demand. A decision tree is drawn, expected monetary values are calculated for each alternative, and the alternative with the highest value, constructing a new facility, is identified as the most preferred decision.
Security analysis (technical) and portfolio managementHarish Khan
This document provides an overview of technical analysis tools and concepts used in portfolio management. It discusses Dow theory, trends in bull and bear markets, chart patterns like head and shoulders and symmetrical triangles, and the efficient market hypothesis. It also summarizes the phases of portfolio management including security analysis, portfolio analysis models like BCG, portfolio selection using Markowitz theory, and portfolio revision and evaluation. Technical analysis tools and modern portfolio theory principles are used to construct optimal portfolios balancing risk and return.
The document discusses decision theory and decision trees. It introduces decision making under certainty, risk, and uncertainty. It defines elements related to decisions like goals, courses of action, states of nature, and payoffs. It also discusses concepts like expected monetary value, expected profit with perfect information, expected value of perfect information, and expected opportunity loss. Examples are provided to demonstrate calculating these metrics. Finally, it provides an overview of how to construct a decision tree, including defining the different node types and how to calculate values within the tree.
This document discusses decision theory and decision making under uncertainty. It outlines the steps in decision theory as determining alternative actions, possible outcomes or states of nature, and constructing a payoff table to choose the alternative with the largest payoff. It describes four types of decision making environments - certainty, uncertainty, risk, and conflict - and gives criteria for decision making under uncertainty, including minimax, maximin, maximax, minimin, Laplace, and Hurwicz criteria. It provides an example applying these criteria to a farmer choosing which crop to plant.
The document describes how to create a break-even analysis graph showing fixed costs, variable costs, total costs and total revenue, and how to identify the break-even point where total revenue equals total costs. It also defines margin of safety as the difference between actual sales and break-even sales, representing the strength of the business in knowing profits or losses relative to the break-even point.
Difference between systematic and unsystematic riskSOJIBSABBIR
Systematic risk, also known as market risk, is uncertainty inherent to the entire market and consists of day-to-day stock price fluctuations. It includes interest, market, and inflation risks and is uncontrollable, arising from macroeconomic factors that affect many securities. Unsystematic risk is uncertainty from a specific company or industry and includes business and financial risks, which can be reduced through diversification. It is controllable and arises from micro-economic factors affecting individual securities.
This presentation summarizes key aspects of decision analysis and decision making under uncertainty. It discusses decision criteria like maximax, maximin, and Laplace that can be used when outcomes are uncertain. When probabilities are known, criteria for decision making under risk are used. Sequential decisions can be modeled with decision trees, which represent decisions, chances, and outcomes with nodes and paths. The presentation was given to MBA students on the topic of decision analysis.
Wealth Maximization is superior then the profit maximizationVTU,Belgaum
Wealth maximization is superior to profit maximization for several reasons. Wealth maximization considers long-term sustainability rather than short-term profits. It accounts for the time value of money by discounting future cash flows. Wealth maximization also factors in risk and uncertainty through the discount rate. The goal of wealth maximization is to improve shareholder value, while considering the total value generated relative to costs for the business. It provides a more efficient allocation of resources while also ensuring benefits to society.
1. There are different types of probability including a priori, statistical, and estimated probabilities which involve judgment under uncertainty.
2. Risk involves known outcomes and probabilities, while uncertainty involves unknown or imprecisely estimated outcomes and probabilities. Most real-life decisions involve uncertainty.
3. The precautionary principle is meant to ensure absence of scientific certainty is not used to postpone actions to protect people and environment from credible threats of serious harm.
The economic environment consists of macro-level factors that impact the demand and supply for businesses, including the nature of the economy, level of development, resources, income levels, and income distribution. It includes economic conditions, policies, systems, and the international business environment. Economic factors like demand, supply, money, banking, income, employment, growth, and development all affect businesses. Recent economic facts about India note contributions of MSMEs, key crops and exports, foreign currency assets, and that services are the major driver of economic growth.
This document outlines several theories of business cycles or trade cycles including climatic, psychological, innovation, monetary, over-investment, over-production, and Keynesian theories. It provides a brief overview of each theory, noting key aspects like how sunspots, optimism/pessimism of businessmen, money supply changes, innovations, interest rates, overproduction, and changes in aggregate demand and investment can influence economic expansions and contractions over time. The document also discusses some criticisms of each theory, such as unrealistic assumptions or other factors not considered.
This presentation discusses the application of marginal costing techniques in decision making. It begins by defining marginal costing as the ascertainment of marginal costs and the effect on profit of changes in output volumes or types by differentiating between fixed and variable costs. Only variable costs are assigned to products, while fixed costs are written off against profits. The presentation then provides examples of how marginal costing can be applied to problems like key factor analysis, price fixation, make-or-buy decisions, product mix selection, and more. It also discusses a case study on applying marginal costing to analyze an agro-tourism business model and the impacts of COVID-19 on the tourism industry.
This document discusses simulation as a technique used in operations research to analyze the behavior of systems. It provides examples of how simulation works by initializing a system, generating inputs, observing outputs, and collecting statistics. Some key uses of simulation mentioned include testing policy decisions, conducting experiments without disrupting real systems, and obtaining operating characteristics estimates faster than working with actual systems. The document also outlines some advantages and limitations of the simulation approach. It includes two examples demonstrating how to simulate daily demand for a bakery and daily production for a moped manufacturer using random numbers.
The document discusses the measurement of profit according to accounting standards. It defines key terms like income, revenue, gains, expenses, losses, comprehensive income and equity. It explains the different approaches to measuring periodic profit and notes that the comprehensive income approach is adopted in AASB 101. Accounting standards for items like revenue, expenses and equity are also outlined.
Economic Value Added (EVA) is a metric developed by Stern Stewart & Co. in 1982 to evaluate business strategies and maximize long-term shareholder wealth. EVA is defined as net operating profit after taxes (NOPAT) minus the cost of capital. To calculate EVA, a company determines its NOPAT, weighted average cost of capital (WACC), and capital employed to see if it is generating returns above its cost of capital and creating economic value. EVA aims to align managerial decisions with shareholder interests.
Marginal analysis examines the costs and benefits of small incremental changes to determine the optimal level of a decision variable. It works by comparing the marginal benefit and marginal cost of an additional unit. If the marginal benefit exceeds the marginal cost, the decision variable should be increased as net benefits will rise. For example, a firm considers producing one more widget. If the extra widget's marginal revenue of $1,200 is less than its marginal cost of $1,500, the firm should not produce it, as net profits would fall. Marginal analysis provides a framework for maximizing benefits given scarce resources.
The document discusses break-even analysis, which determines the sales volume needed for a company to cover its total costs. It defines break-even point as the sales level where total revenue equals total costs, resulting in no profit or loss. The document provides examples of calculating break-even point using tables and charts. It also outlines the assumptions and limitations of break-even analysis, and explains its uses for management decision making like determining a target profit level or the effect of a price change.
Theory of the Firm
1. The document discusses several theories of the firm including the economic theory of profit maximization, behavioral theories such as Simon's satisficing model and Cyert and March's model, and alternative objectives like sales maximization. 2. It also explains key concepts like the firm, industry, and market, and compares accounting profit versus economic profit. 3. The theories aim to explain how firms make decisions and set objectives in different market structures under conditions of uncertainty.
This chapter describes methods for allocating joint costs between joint products. Joint products are two or more products produced from the same raw materials, like petrol and diesel from crude oil. By-products have lower value. Methods for allocating joint costs include sale value at split-off point, reverse cost method, net realizable value method, physical unit method, and contribution margin method. The net realizable value method is often most suitable.
Mr. X is considering three universities for admission and must select based on location, academic reputation, and political violence. He analyzes each university using a decision tree that weights reputation most heavily. The analysis shows University B has the best overall score. Decision analysis allows ranking alternatives based on weighted criteria to select the optimal choice.
Forecasting is the process of making statements about events whose actual outcomes have not yet been observed.
Example might be estimation of some variable of interest at some specified future date.
Prediction is a similar, but more general term. The data must be up to date in order for the forecast to be as accurate as possible
Breakeven analysis examines the relationship between costs, revenue, output levels and profit. It is an important short-term planning tool. Breakeven analysis determines the break even point, which is the sales volume needed for revenues to equal total costs. It also determines the margin of safety, which is the difference between expected sales and break even sales. Examples show how to calculate break even point, margin of safety, and sales needed to achieve a target profit level using contribution per unit and fixed costs. Limitations include the assumptions of fixed versus variable costs and constant prices and efficiency.
INTRODUCTION
A breakeven analysis is used to determine how much sales volume your business needs to start making a profit.
The breakeven analysis is especially useful when you're developing a pricing strategy, either as part of a marketing plan or a business plan.
In economics & business, specifically cost accounting, the break-even point (BEP) is the point at which cost or expenses and revenue are equal: there is no net loss or gain, and one has "broken even".
Total cost = Total revenue = B.E.P.
The document discusses risk and return in investments. It defines key concepts such as realized and expected return, ex-ante and ex-post returns, sources and measurements of risk including standard deviation and coefficient of variation. It also discusses the risk-return tradeoff and how higher risk investments require higher potential returns to compensate for additional risk.
Linear programming is an optimization technique used to maximize or minimize a linear objective function subject to linear constraints. It involves defining variables, constraints, and an objective function in terms of those variables. The optimal solution is found by systematically considering all extreme points of the feasible region defined by the constraints. Linear programming has wide applications in fields like production, transportation, finance, and resource allocation.
Organisational Performance Measures. This is only for study purpose, The content is refereed from various available sources. Through this, the learner, decision makers are may got benefited.
This document provides an overview of approaches to social accounting and social reporting practices of companies in India. It discusses 8 main approaches to social accounting, including cost-benefit analysis, socio-economic operating statement, and descriptive or narrative approaches. It also outlines social reporting practices of major Indian companies like Tata, Infosys, Mahindra & Mahindra, Reliance Industries, and Aptech. The document concludes with limitations of social reporting in India and references used.
The document discusses strategies for implementing risk management in organizations. It covers developing incentives consistent with risk-taking, decentralization and the risk of over-conservatism, evaluating risk attitudes through utility functions, and establishing appropriate incentives through alternative personnel evaluation plans that separate outcomes from decisions.
This document contains practice problems related to risk and return. It discusses different types of risk like sales risk, operating risk, interest rate risk, and how they can vary between firms or bonds. It also covers risk measurement by calculating expected values and standard deviations for probability distributions. Other topics include the capital asset pricing model, portfolio risk and return, diversification, and how correlation between investments affects portfolio risk.
1. Modification of Problem 9.3 from the book Jean Clark i.docxjackiewalcutt
1. Modification of Problem 9.3 from the book:
Jean Clark is the manager of the Midtown Saveway Grocery Store. She now needs to replenish her
supply of strawberries. Her regular supplier can provide as many cases as she wants. However, because
these strawberries already are very ripe, she will need to sell them tomorrow and then discard any that
remain unsold. Jean estimates that she will be able to sell 10, 11, 12, or 13 cases tomorrow. She can
purchase the strawberries for $3 per case and sell them for $8 per case. Jean now needs to decide how
many cases to purchase.
Jean has checked the store’s records on daily sales of strawberries. On this basis, she estimates that the
prior probabilities are 0.2, 0.4, 0.3, and 0.1 for being able to sell 10, 11, 12, and 13 cases of strawberries
tomorrow, respectively.
a) Develop a decision analysis formulation of this problem by identifying the decision
alternatives, the states of nature, and the payoff table. (Build a table similar to the
Table 9.3 in the textbook or the table on Slide 9 of Lecture Notes 11 – Decision
Analysis).
State of Nature
Alternative Sell 10 cases Sell 11 cases Sell 12 cases Sell 13 cases
Buy 10 cases $50 $50 $50 $50
Buy 11 cases $47 $55 $55 $55
Buy 12 cases $44 $52 $60 $60
Buy 13 cases $41 $49 $57 $65
Prior Probability 0.2 0.4 0.3 0.1
b) If Jean is dubious about the accuracy of these prior probabilities and so chooses to
ignore them and use the maximax criterion, how many cases of strawberries should
she purchase? Show how you reach to your answer using the table you have in part
a).
Max(Buy 10) = $50,
Max(Buy 11) = $55,
Max(Buy 12) = $60,
Max(Buy 13) = $65.
Maximax = $65 with buying 13 cases.
State of Nature
Alternative Sell 10 cases Sell 11 cases Sell 12 cases Sell 13 cases
Buy 10 cases $50 $50 $50 $50
Buy 11 cases $47 $55 $55 $55
Buy 12 cases $44 $52 $60 $60
Buy 13 cases $41 $49 $57 $65
c) How many cases should be purchased if she uses the maximin criterion? Show how
you reach to your answer using the table you have in part a).
Min(Buy 10) = $50,
Min(Buy 11) = $47,
Min(Buy 12) = $44,
Min(Buy 13) = $41.
Maximin = $50 with buying 10 cases.
State of Nature
Alternative Sell 10 cases Sell 11 cases Sell 12 cases Sell 13 cases
Buy 10 cases $50 $50 $50 $50
Buy 11 cases $47 $55 $55 $55
Buy 12 cases $44 $52 $60 $60
Buy 13 cases $41 $49 $57 $65
d) How many cases should be purchased if she uses the maximum likelihood criterion?
Show how you reach to your answer using the table you have in part a).
The most likely state of nature is to sell 11 cases. Under this state, she should buy 11
cases with a payoff of $55.
State of Nature
Alternative Sell 10 cases Sell 11 cases Sell 12 cases Sell 13 cases
Buy 10 cases $50 $50 $50 $50
Buy 11 cases $47 $55 $55 $55
Buy 12 cases $44 $52 $60 $60
Buy 13 cases $41 $49 $57 $65
Prior Probability 0.2 0.4 0.3 0.1
e) ...
The document contains examples of calculating probabilities of default for bonds and credit portfolios using various inputs like probability of default, loss given default, recovery rates, bond yields, risk free rates, and firm value volatility. The key calculations shown include probability of 1, 2, or more bonds defaulting in a portfolio; cumulative default probability over multiple periods; implied default probability from bond-Treasury yield spreads; and default probability estimation using Merton model inputs like firm value, debt, and equity volatility.
The document defines and provides examples of decision trees. It explains that decision trees use a branching graph structure to illustrate all possible outcomes of a decision. They are used in operations research and decision analysis to help identify the most likely strategy to reach a goal. The document provides an example of an email management decision tree and explains how decision tree analysis involves forecasting outcomes and assigning probabilities. It outlines some common applications of decision trees and provides an example decision tree for weekend activity choices based on weather, finances, and parental visits.
We have chosen our business as a press firm and whose name isShimanto Deb
This document discusses operations management strategies used by a publishing firm. It summarizes key steps the firm took:
1. It calculated productivity ratios like labor productivity to determine optimal production levels.
2. It used decision analysis techniques like expected monetary value, expected opportunity loss, and expected value of perfect information to analyze alternatives and make production decisions under conditions of certainty, risk, and uncertainty.
3. It performed break-even analysis to determine the production level where total costs equal total revenue, allowing it to anticipate its zero profit point.
By taking these operational strategy steps including productivity analysis, decision making, and break-even analysis, the firm aims to maximize profit by minimizing loss with limited production resources.
This chapter discusses key concepts in finance including present value, risk and return, and asset valuation. It introduces the concept of present value to compare sums of money over time, accounting for interest. It also discusses how risk-averse individuals can use insurance and diversification to manage risk. The chapter explores how the market values assets based on expectations of future cash flows, dividends, and prices, as described by the efficient market hypothesis. It concludes by discussing debates around market efficiency and irrationality.
This document discusses binary classification and logistic regression. It defines key terms like odds, odds ratios, and probability. It also notes some issues that can arise, such as imbalanced samples, separation, and unclear practices regarding variable selection and dealing with collinearity. Interpretation of coefficients in logistic regression is discussed, specifically that coefficients estimate the log of the odds ratios comparing different levels of the independent variables.
- The document discusses logistic regression models for binary classification problems. It covers interpreting coefficients in logistic regression models as odds ratios. An odds ratio above 1 indicates the variable increases the odds of the event, while an odds ratio below 1 decreases the odds.
- It also provides an example of how dummy variables are interpreted, where the exponentiated coefficient represents the odds ratio of the event occurring for that category versus the reference category. This allows easy comparison of probabilities between groups defined by the dummy variable.
This document discusses key concepts in finance including present value, future value, compound interest, risk and return, insurance, and diversification. It provides examples to illustrate concepts such as how present value can be used to compare cash flows over time. It also discusses why people are generally risk averse and how insurance and diversification allow people to manage risk. The document suggests that an asset's value depends on factors like expected future cash flows, and notes that the efficient markets hypothesis posits that asset prices reflect all available public information, making it difficult to outperform the market.
This document discusses key concepts in finance including present value, future value, compound interest, risk and return, insurance, diversification, and asset valuation. It explains that present value allows comparison of sums over time by discounting future cash flows. Risk-averse individuals use insurance and diversification to manage risk. The value of an asset depends on expected future cash flows discounted at the appropriate interest rate. The efficient markets hypothesis suggests that asset prices already reflect all available public information, making it difficult to "beat the market".
You can use a calculator to do numerical calculations. No graphing.docxjeffevans62972
This document presents three ethical scenarios involving the use of information technology and personal information:
1) A business owner tracking employee locations using GPS in company vehicles.
2) A security professional being asked to access a background check system by a friend to check on a neighbor.
3) A restaurant owner tracking detailed customer data and purchase histories through a new customer relationship system.
The document poses ethical questions around privacy and appropriate use and protection of personal information in each scenario. It prompts consideration of responsibilities in handling such information and any related actions that should or should not be taken.
1. The document discusses various financial concepts including the importance of financial intelligence, passive income, income statements, balance sheets, and different approaches to valuing stocks.
2. It provides examples of using financial functions in spreadsheets to calculate things like present and future value, interest rates, and payments for investments and loans.
3. The risks and returns of different asset classes are examined, including how to calculate portfolio risk and the security market line to determine required rates of return for stocks.
This document discusses key concepts in decision theory and decision making under uncertainty. It begins by defining decision theory and describing the degree of certainty in decision making problems. It then outlines elements of decision analysis like states of nature, chance occurrences governed by probabilities, and payoff matrices. An example involving production decisions for a dairy product is provided. The document also discusses criteria for decision making under uncertainty like Laplace, maximin, maximax, Hurwicz, and regret. It concludes by covering expected monetary value, expected opportunity loss, expected value of perfect information, and decision trees as approaches to decision making under risk.
This document provides an overview of decision analysis and decision making under certainty and uncertainty. It describes decision environments like certainty, where outcomes are known, and uncertainty, where outcomes are unknown. It also defines decision criteria for nonprobabilistic decisions, where probabilities are unknown, and probabilistic decisions, which consider probabilities. Examples are given of decision criteria like expected value, maximax, maximin and minimax regret. Payoff tables, opportunity loss tables, and decision trees are used to demonstrate the application of these decision criteria.
This document provides an introduction to key concepts in finance, including:
1) Present value is used to compare sums of money from different times by discounting future values to their worth today using prevailing interest rates.
2) People are generally risk averse because diminishing marginal utility means losses reduce utility more than equivalent gains increase it. Insurance and diversification help manage risk.
3) An asset's value depends on expected future cash flows discounted at the appropriate interest rate. The efficient markets hypothesis suggests beating the overall market is very difficult.
This chapter introduces fundamental concepts in finance, including present value, risk aversion, and asset valuation. It discusses how present value can be used to compare cash flows over time and explains why people are risk averse due to diminishing marginal utility. Insurance and diversification are introduced as ways for risk-averse individuals to manage risk. The chapter also covers the efficient markets hypothesis and how asset prices are determined based on available information.
The document discusses inventory management concepts including economic order quantity (EOQ) models. It defines key inventory costs: ordering/setup costs, holding/carrying costs, shortage costs. The EOQ model balances ordering and carrying costs to determine the optimal order quantity. An example calculates the EOQ, annual carrying cost, ordering cost, and total annual cost for a company with constant demand and known costs and demand values. The optimal order quantity minimizes total annual inventory costs.
The document discusses decision trees, which are diagrams that illustrate decisions and their potential consequences. It provides examples of decision trees used by two companies - Manly Plastics and Vine Desserts - to analyze decisions about new product development and business location selection. It also discusses key concepts in decision trees, including decision nodes, chance nodes, expected value calculations, and how decision trees can be used for regression and survival analysis involving continuous or time-to-event outcomes.
The document introduces decision tree analysis for addressing complex decisions involving uncertainty. It provides an example where a company is deciding whether to develop a temperature sensor or pressure sensor. A decision tree is constructed to represent the possible outcomes and their probabilities. Expected value is introduced as a decision-making criterion that considers both outcomes and their probabilities. An example uses expected value to analyze whether one should accept a bet involving the roll of a die.
The document provides an overview of quantitative analysis. It discusses that quantitative analysis is the systematic study of an organization's structure, characteristics, functions, and relationships to provide executives with a quantitative basis for decision making. The characteristics of quantitative analysis include a focus on decision making, applying a scientific approach, using an interdisciplinary team, and applying formal mathematical models. The quantitative analysis process involves defining the problem, developing a model, acquiring data, developing a solution, testing the solution, and validating the model. Common tools used in quantitative analysis include linear programming, statistical techniques, decision tables, decision trees, game theory, forecasting, and mathematical programming.
This document outlines five methods for managing conflict: accommodation, compromise, avoidance, competition, and collaboration. Accommodation is a lose/win approach where one party forfeits their position. Compromise is a win/lose-win/lose approach where all parties gain and lose through negotiation. Avoidance is a lose/lose approach where issues remain unresolved. Competition is a win/lose approach where one party attempts to dominate. Collaboration is a win/win approach that requires trust and understanding between all parties. Each approach is best suited to different conflict situations.
This document summarizes 10 key human capital trends from 2017 to 2020 according to annual surveys. The trends include the changing nature of careers, learning, talent acquisition, employee experience, performance management, leadership, digital HR, people analytics, diversity and inclusion, and the future of work involving new technologies. Organizations are shifting from hierarchies to empowered networks and teams and redesigning jobs to leverage both human and technological capabilities. Learning is becoming more continuous, personalized and integrated with work. Well-being, the hyper-connected workplace, data privacy, and social impact are also emerging as important issues.
Define conflict and conflict behavior in organizations
Distinguish between functional and dysfunctional conflict
Understand different levels and types of conflict in organizations
Analyze conflict episodes and the linkages among them
Explain why conflict arises, and identify the types and sources of conflict in organizations.
Describe conflict management strategies that managers can use to resolve conflict effectively.
Understand the nature of negotiation and why integrative bargaining is more effective than distributive negotiation.
,managing conflict ,politics ,and negotiation
This document discusses conflict management in an organizational context. It begins by defining conflict and outlining learning objectives around understanding conflict, dealing with typical conflicts that arise, and developing skills to resolve conflicts. It then presents a case study about the performance of three typists, Anabia, Sonia and Tania, and asks the reader to evaluate their performance. Additional details provided about each typist may affect the reader's evaluation. The document goes on to discuss causes of conflicts, effects of conflicts in organizations, different approaches to dealing with conflicts, and steps that can be taken to prevent and resolve conflicts. It concludes by noting that while conflict is inevitable and not entirely negative, poorly managed conflicts can have counterproductive results while well-managed
Differences between legal compliances and managing diversityJubayer Alam Shoikat
The document provides guidelines for developing an organizational code of ethics or code of conduct. It outlines several key components that should be addressed in a code, including personal integrity, compliance with laws, political contributions, confidential information, conflicts of interest, financial records, employment policies, securities transactions, use of company assets, gifts and entertainment, environmental issues, and compliance/enforcement. It stresses that codes are most effective when communicated, modeled by leadership, and enforced with accountability.
,
capital budgeting
,
concept of capital budgeting
,
the capital budgeting process
,
significance of capital budgeting
,
classification of investment project proposals
,
techniques of capital budgeting
,
types of project
The document discusses database management systems (DBMS) and cybercrime. It defines a DBMS as software that enables the use of databases and provides methods for creating, updating, storing and retrieving data. The main components of a DBMS are software, hardware, data, procedures and database access languages like SQL. Cybercrime is defined as illegal activities involving computers, like hacking, phishing and spamming. Hackers may break into networks for recreational or financial reasons. Common online spying tools used by cybercriminals include cookies, spyware, web bugs and spam to track users and acquire personal information without consent.
basic organization of computer
,
input unit
,
output unit
,
storage unit
,
arithmetic logic unit (alu)
,
computer codes
,
computer for organization
,
business communication
,
payroll system
,
management information system
This document discusses different number systems including non-positional, positional, decimal, binary, octal, and hexadecimal systems. It provides examples of how to convert numbers between these bases using direct conversion methods or shortcuts. Key aspects covered include how the position and base of each digit determines its value in a number, converting a number to decimal and then to another base, and dividing binary, octal, or hexadecimal numbers into groups to convert to a different base number system.
operating system
,
os
,
what is an os?
,
types of os
,
logical architecture of a computer system
,
basic task perform by os
,
task switching
,
utility software
,
main functions of an os
This document provides an overview of data communications and computer networks. It discusses the basic elements of a communication system including senders, receivers, and transmission media. It then describes different types of transmission media such as twisted pair wire, coaxial cable, microwave systems, and optical fibers. The document also covers digital and analog data transmission, network topologies including star, ring, bus and hybrid networks. It defines local and wide area networks and describes some common networking devices like network interface cards.
The document discusses the five generations of computers from the 1940s to present. It provides details on the key hardware technologies, software technologies, and characteristics of each generation. The first generation used vacuum tubes and were very large, unreliable, and costly. The second generation introduced transistors, magnetic storage, and batch operating systems. The third generation saw the rise of integrated circuits, timesharing operating systems, and standard programming languages. The fourth generation brought microprocessors, PCs, networks, and GUIs. The fifth generation includes powerful desktops, notebooks, servers, supercomputers, and technologies like the internet, multimedia, and Java.
International Business basic concept of international business
,
approaches to international business/ modes of ent
,
barriers to international business
,
absolute advantage and comparative advantage
The document provides information about the accounting cycle for Taposhi Corporation Ltd, including a trial balance, additional information, a 10-column worksheet, income statement, statement of owner's equity, and classified balance sheet. The worksheet adjusts account balances based on additional information and carries forward balances to the financial statements. The income statement shows net income of 20,500 Taka. The statement of owner's equity shows an increase in capital from opening to closing balance. The balance sheet presents assets, liabilities, and owner's equity as of December 31.
This document summarizes a study on the annual reports of Grameenphone over 10 years. It includes an analysis of gross profit and net profit from 2006 to 2015 showing increases over time. Charts in the form of histograms and polygons visualize these trends. Key findings note that Grameenphone is the largest telecom provider in Bangladesh with over 56 million subscribers and extensive network coverage. The network provides mobile, internet, and other digital services across the country.
How to Add Chatter in the odoo 17 ERP ModuleCeline George
In Odoo, the chatter is like a chat tool that helps you work together on records. You can leave notes and track things, making it easier to talk with your team and partners. Inside chatter, all communication history, activity, and changes will be displayed.
Executive Directors Chat Leveraging AI for Diversity, Equity, and InclusionTechSoup
Let’s explore the intersection of technology and equity in the final session of our DEI series. Discover how AI tools, like ChatGPT, can be used to support and enhance your nonprofit's DEI initiatives. Participants will gain insights into practical AI applications and get tips for leveraging technology to advance their DEI goals.
A review of the growth of the Israel Genealogy Research Association Database Collection for the last 12 months. Our collection is now passed the 3 million mark and still growing. See which archives have contributed the most. See the different types of records we have, and which years have had records added. You can also see what we have for the future.
Introduction to AI for Nonprofits with Tapp NetworkTechSoup
Dive into the world of AI! Experts Jon Hill and Tareq Monaur will guide you through AI's role in enhancing nonprofit websites and basic marketing strategies, making it easy to understand and apply.
Main Java[All of the Base Concepts}.docxadhitya5119
This is part 1 of my Java Learning Journey. This Contains Custom methods, classes, constructors, packages, multithreading , try- catch block, finally block and more.
How to Manage Your Lost Opportunities in Odoo 17 CRMCeline George
Odoo 17 CRM allows us to track why we lose sales opportunities with "Lost Reasons." This helps analyze our sales process and identify areas for improvement. Here's how to configure lost reasons in Odoo 17 CRM
Exploiting Artificial Intelligence for Empowering Researchers and Faculty, In...Dr. Vinod Kumar Kanvaria
Exploiting Artificial Intelligence for Empowering Researchers and Faculty,
International FDP on Fundamentals of Research in Social Sciences
at Integral University, Lucknow, 06.06.2024
By Dr. Vinod Kumar Kanvaria
Exploiting Artificial Intelligence for Empowering Researchers and Faculty, In...
Decision analysis
1. Page1 of 8
Decision Analysis: Decision analysis is a setof quantitative decision making techniques for decision situations
in which uncertainty exists.
Now, uncertainty can be classified into two ways/ types:
1. Subjective Probability: Subjective probability is the degree of belief to occurrence of the event.
2. Objective Probability: Objective probability is the probability which can be derived either based on
historical occurrences or based on experimentation. Alternatively can be derived from statistical
formula.
Consistency requirement: If the probability ofan eventA is 0.65, then the probability of event B must be 0.35.
i.e. P(A) + P(B) = 1
Mathematically, if A, B Є E
Then
A, B E
A B = φ
P(A) + P(B) = 1, which is called Consistency requirements.
# Elements of Decision Problems:
A decision problem is usually viewed as having four common elements
1. The alternative course of action: The alternative course of action involves two or more options or
alternative course of action. One and only one of these alternatives must be selected.
2. The states of nature: The state of nature are factors that affect the outcome of a decision but are
beyond control of the decision maker, such as rain, inflation, political development etc.
3. Payoff table: A payofftable is the combination for each possible combination of alternative course
of action and state of nature.
4. Uncertainty: The decision maker is uncertain about what state of nature will occur. However
choose the criterion that results in the largest payoff.
#Types of Decision –Making Environment:
The types ofdecisions people make depend on how much knowledge or information they have about the situation.
Three decision making environments are defined and explained as follows:
Type 1: Decision Making Under Certainty: In the environmentof decision making under certainty, decision makers
know with certainty the consequence of every alternative that will maximize their- well – being or will result in the
best outcome. Let’s say that you have $ 1000 to invest for a one year period. One alternative is to open a savings
account paying 6% interest and another is to invest in a government treasury bond paying 10% interest. Both
investment are secure and guaranteed, but as treasury bond will pay a higher return, you may choose that one.
2. Page2 of 8
Type 2: Decision Making Under Risk: In decision making under risk, the decision maker knows the probability of
occurrence ofeach outcome. For example, thatthe probability ofbeing dealt a club is 0.25. The probability of rolling
a 5 on a die is 1/6. In decision making under risk, the decision maker attempts to maximize his or her expected well-
being. Decision theory models for business problems in this environment typically employ two equivalent criteria:
maximization of expected monetary value and minimization of expected loss.
Type 3: Decision Making Under Uncertainty: In decision making under uncertainty the decision maker does not
know the probabilities ofthe various outcomes. As an example, the probability that a BNP personnel will be president
of Bangladesh 25 years from now is not known. Sometimes itis impossible to assess the probability of success of a
new undertaking or product.
Decision Making Under Risk
Decision making under risk is a probabilistic decision situation. Several possible states of nature may occur, each
with a given probability.
There are three types of methods or criteria available, which could be of help to the decision maker.
1. Expected Monetary Value: EMV is the weighted sum of possible payoffs for each alternative.
i.e. EMV (alternative i ) = (Payoff of first state of nature) x ( Probability of first state of nature)
+(Payoff of second state of nature)x(Probability of second state of nature)
+ …. + (Payoff of last state of nature)x(Probability of last state of nature).
Example: 1 Mc Douglas a national chain fast food restaurant, has been offering a traditional selection of
hamburgers, French fries, soft drinks etc. The company want to introduce breakfast items to the
menu.
Breakfast items are relatively easy to prepare and would not require a large capital outlay for
additional cooking equipment. Most important such items would be sold in the morning when the
demand for the company’s traditional products has been very week. However, because
a. Many people are known to skip breakfast and
b. The company does not know how competitors may react, the demand for the new
products is uncertain.
So, they consider three levels of customer demand- strong, average and weak.
There are two alternative acts available to Mc Douglas
A1 : Introduce breakfast items.
A2 : Do not introduce breakfast items.
And three possible states of nature
S1 : Strong demand
S2 : Average demand
S3 : Weak demand
The management developed a set of payoffs for each act / state combination. The payoff
considered such items as capital outlay, depreciation policies, training costs, additional advertising
expenditures and so on. Act A2 , do not introduce breakfast items, has zero payoffs for all states
since three would be no incremental revenue or cost associated with this decision.
3. Page3 of 8
Solution: The payoff table according to the data is
State
(demand)
Act
A1
(Introduced)
A2
(Not Introduced)
Strong, S1: 30 0
Average, S2: 5 0
Weak, S3: -15 0
Status Quo, means do not introduced anything.
Now the management assigns the subjective probability distribution based on the beliefs.
State
(demand) Probability
Strong, S1: 0.2
Average, S2: 0.4
Weak, S3: 0.4
Hence the payoff matrix
S Act
A1 A2 P (S)
S1: 30 0 0.2
S2: 5 0 0.4
S3: -15 0 0.4
A1 is the optimal act. So, introduced breakfast items.
Example:2
A newspaper boy has the following probabilities of selling a magazine.
No. of copies Sold Probabilities
10 0.10
11 0.15
12 0.25
13 0.25
14 0.30
Cost of a copy is 30 paisa, sale price is 50 paisa. He cannot return unsold copies. How many copies should he
order?
Solution: Sales magnitude are 10,11,12,13,14 . There is no reason to buy less than 10 or more than 14.
Now from any possible combination of supply and demand. The conditional profit table is
1. Stocking of10 copies each day will always resultin a profitof 200 paisa irrespective of demand. Even if
the demand on some day is 13 copies, he can sell only 10 and hence his conditional profit is 200 paisa.
EMV (A1) = 30 (.2) + 5 (.4) – 15 (.4)
= 6 + 2 – 6 = $2
EMV (A2) = 0(.2) + 0 (.4) + 0(.4) = 0
4. Page4 of 8
2. When he stocks 11 copies his profit will be 220 paisa on days when buyers request 11, 12, 13 or 14
copies. But on days when he has 11 copies on stock and buyers buy only 10 copies, his profit
decreases to (200 – 30) = 170 paisa.
Thus the conditional profit in paisa is given by Payoff = 20 x copies sold – 30 x copies unsold.
Conditional profit table
Possible Demand
(no. of copies )
Proba
bility
Possible Stock action
10 Copies 11 Copies 12 Copies 13 Copies 14 Copies
10 0.10 200 170 140 110 80
11 0.15 200 220 190 160 130
12 0.20 200 220 240 210 180
13 0.25 200 220 240 260 230
14 0.30 200 220 240 260 280
Expected Monetary Value:
EMV (10) = .10 (200) + .15 (200) + .20 (200) + .25 (200) + .30 (200) = 20 + 30 + 40 + 50 + 60 = 200
EMV (11) = .10 (170) + .15 (220) + .20 (220) + .25 (220) + .30 (220) = 17 + 33 + 44 + 55 + 66 = 215
EMV (12) = .10 (140) + .15 (190) + .20 (240) + .25 (240) + .30 (240) = 14 + 28.5 + 48 + 60 + 72 = 222.5
EMV (13) = .10 (110) + .15 (160) + .20 (210) + .25 (260) + .30 (260) = 11 + 24 + 42 + 65 + 78 = 220
EMV (14) = .10 (80) + .15 (130) + .20 (180) + .25 (230) + .30 (280) = 8 + 19.5 + 36 + 57.5 + 84 = 205
The news boy must, therefore order 12 copies to earn the highest possible average daily profit of 222.5 paisa.
2. Expected Opportunity Loss (EOL): It is an approach alternative to the EMV approach.
Opportunity loss, sometimes called regret, refers to the difference between the optimal profit or
payoff and the actual payoff received. In other words, EOL is the cost of not picking the best
solution.
The minimum expected opportunity loss is found by constructing and opportunity loss table and
computing EOL for each alternative. The steps are:
i. The first step is to create the opportunity loss table. This is done by determining the opportunity
loss for not choosing the best alternative for each state of nature.
Define Lij = as the opportunity loss under state Si for act Aj and Li j = *
iij MM
Where Mi* =The best pay
off under state Si.
ii. The second step is to compute EOL by multiplying the probability ofeach state of nature times the
appropriate opportunity loss value.
Example: 3 Mc Dougla’s payoff matrix
S Act
A1 A2 P (S)
5. Page5 of 8
S1: 30 0 0.2
S2: 5 0 0.4
S3: -15 0 0.4
Now, Li j = *
iij MM i.e. L11 = 03030*
111 MM , L12 = 30300*
112 MM ,
L21 = 055*
221 MM , L22 = 550*
222 MM ,
L31 = 15015*
331 MM , L32 = 000*
332 MM ,
Hence the opportunity loss table on the basis of the original matrix is
S Act
A1 A2 P (S)
S1: 0 30 0.2
S2: 0 5 0.4
S3: 15 0 0.4
Hence A1 is the optimal act as it minimize EOL.
Example:4
The Conditional Profit Table of the news paper boy is given
Possible Demand
(no. of copies )
Proba
bility
Possible Stock action
10 Copies 11 Copies 12 Copies 13 Copies 14 Copies
10 0.10 200 170 140 110 80
11 0.15 200 220 190 160 130
12 0.20 200 220 240 210 180
13 0.25 200 220 240 260 230
14 0.30 200 220 240 260 280
The Opportunity Loss Table / Conditional Loss table (Paisa)
Possible Demand
(no. of copies )
Proba
bility
Possible Stock action
10 Copies 11 Copies 12 Copies 13 Copies 14 Copies
10 0.10 0 30 60 90 120
11 0.15 20 0 30 60 90
12 0.20 40 20 0 30 60
13 0.25 60 40 20 0 30
14 0.30 80 60 40 20 0
Hence EOL (10) = .10 (0) + .15 (20) + .20 (40) + .25 (60) + .30 (80) = 0 + 3 + 8 + 15 + 24 = 50 (Paisa)
EOL (11) = .10 (30) + .15 (0) + .20 (20) + .25 (40) + .30 (60) = 3 + 0 + 4 + 10 + 18 = 35
EOL (12) = .10 (60) + .15 (30) + .20 (0) + .25 (20) + .30 (40) = 6 + 4.5 + 0 + 5 + 12 = 27.5
EOL (13) = .10 (90) + .15 (60) + .20 (30) + .25 (0) + .30 (20) = 9 + 9 + 6 + 0+ 6= 30
EOL (14) = .10 (120) + .15 (90) + .20 (60) + .25 (30) + .30 (0) = 12 + 13.5 + 12 + 7.5+ 0= 45
Hence stocking 12 copies each day will minimize expected opportunity loss, which is 27.5 paisa.
3. Expected Value of Perfect Information: (EVPI)
Complete and accurate information aboutthe future demand, referred to as perfectinformation
would remove all uncertainty form the problem. With this perfectinformation, the decision maker
would know in advance exactly aboutthe future demand.
EOL (A1) = 0 (.2) + 0(.4) + 15 (.4)
= $6
EOL (A2) = 30(.2) + 5 (.4) + 0(.4) = 8
6. Page6 of 8
EVPI represents the maximum amount he would pay to getthe additional information on which may
be based the decision alternative.
EVPI = Expected profit with perfect information – EMV i.e EVPI = EPPI – EMV (max)
Example: 5 Given Mc Douglas payoffmatrix
S Act
A1 A2 P (S)
S1: 30 0 0.2
S2: 5 0 0.4
S3: -15 0 0.4
Let Mi* = Maximum payoffor bestoutcome for first state ofnature.
)(.8
ii SPMEPPI
S Mi* P (Si) )(.8
ii SPM
S1: 30 0.2 6
S2: 5 0.4 2
S3: 0 0.4 0
)(.8
ii SPM = 8
8 EPPI Also Max EMV = 2
6$28 EVPI * EVPIis sometimes termed the costofuncertainty.
Exercise: 1 An ice-cream retailer buys ice-cream ata costofTk. 5 per cup and sells itfor Tk. 8 per cup; any
remaining unsold at the end ofthe day can be disposed ofata salvage price ofTk. 2 per cup. Pastsales have
ranged between 15 and 18 cups per day; there is no reason to believe thatsales volume will take on any other
magnitude in future. Find the EMV, EOL and EVPI if the sale history has the following probabilities:
Market size: 15 16 17 18
Probability: 0.10 0.20 0.40 0.30
Decision Making Under Uncertainty
When a manager cannot assess the outcome probability with confidence or when virtually no probability data are
available, other decision criteria are required. This type ofproblem has been referred to as decision making under
uncertainty. The criteria or method that we cover in this section include
1. Maximax (optimistic)
7. Page7 of 8
2. Maximin (pessimistic)
3. Minimax
4. Hurwicz Criterion (Criterion of realism)
5. Laplace Criterion or Equally likely criterion or Criterion ofRationality.
1. Maximax (Optimistic) Criterion: Under this the decision maker finds the maximum possible payofffor each
alternative and then chooses the alternative with maximum payoff within this group.
2. Maximin (Pessimistic) Criterion: To use this criterion the decision maker finds the minimum possible
payofffor each alternative and then chooses the alternative with maximum payoffwithin this group.
3. Minimax Criterion : The decision maker tries to minimize the regretbefore actually selecting a particular
alternative. For this he determines the maximum regretamount for each alternative and then choose the
alternative with the minimum of the above maximum regrets.
4. Hurwicz Criterion: Also called the weighted average criterion. Itis a compromise between the maximax and
maximin decision criteria. It takes both of them into account by assigning them weights in accordance with
the degree ofoptimism or pessimism.
Select α = Index of optimism, If α = 0 pessimistic, then α = 1 optimistic.
Hence α is specified (0,1) range.
Also α = 0.5 implies neither optimistic nor pessimistic.
5. Laplace Criterion: It is based on what is known as the principle ofinsufficientreason. Because ofthe
probability distribution ofthe states ofnature is not known, the criterion assigns equal probabilities toa ll the
events ofeach alternative and selectthe alternative associated with the maximum expected payoff.
Example: 6
The following matrix gives the payoffof different strategies (alternatives) S1,S2, S3 againstconditions
(events) N1, N2, N3 & N4 .
N1 N2 N3 N4
S1 Rs. 4000 Rs. –100 Rs. 6000 Rs. 18000
S2 20000 5000 400 0
S3 20000 15000 -2000 1000
Indicate the decision taken under the following approach:
i. Pessimistic
ii. Optimistic
iii. Equal Probability
iv. Regret
v. Hurwicq Criterion, his degree ofoptimism being 0.7
Solution:
Pessimistic Optimistic Equal Probability Value
8. Page8 of 8
S1 -100 18000 Rs. ¼ ( 4000 – 100 + 6000 + 18000) = 6975
S2 0 20000 Rs. ¼ ( 20000 + 5000 + 400 + 0) = 6350
S3 -2000 20000 Rs. ¼ ( 20000 + 15000 -2000 + 1000) = 8500
i. S2 is the optimal decision.
ii. S2 or S3 is the optimal decision.
iii. S3 is the alternative to be selected.
iv. Under regretcriterion
i th regret= (maximum payoff – i th payoff) for the jth event.
N1 N2 N3 N4 Maximum
regret
S1 16000 15100 0 0 16000
S2 0 10000 5600 18000 18000
S3 0 0 8000 17000 17000
The decision alternative S1 would be chosen since itcorresponds to the minimal ofthe maximum possible
regrets.
v. For the given payoffmatrix the minimum and the maximum payofffor each alternative are
given below.
Minimum
payoff
Maximum
payoff
Payoff = α. Maximum + (1- α) minimum
Where α = 0.7
S1 -100 18000 .7 x 18000 + .3 x (-100) = 12570
S2 0 20000 .7 x 20000 + .3 (0) = 14000
S3 -2000 20000 .7 x 20000 + .3 (-2000) = 13400
Thus under Hurwicz rule, alternative S2 should be chosen as itis associated with the
highestpayoffof Rs. 14000.
Exercise: Taylor, p-42. No. S1-1, S1-2, S1-3,S1-4,S1-12, S1-17, 1-18, 1-21