


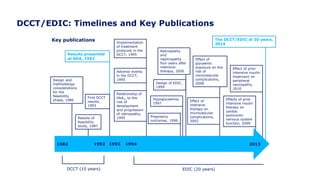


![Lower Prevalence of DPN and CAN with Intensive vs.
Conventional Treatment
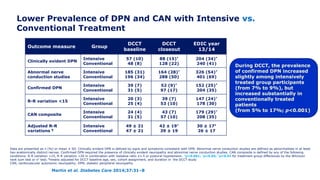
In EDIC, a 30% reduction in the risk of incident confirmed DPN was observed with
prior intensive therapy odds ratio [OR] 0.70 [95% CI: 0.52–0.93]
Martin et al. Diabetes Care 2014;37:31–8
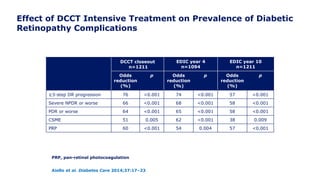
*Incidence at DCCT closeout is among participants without the defined outcome at DCCT baseline. Incidence at
EDIC year 13/14 is among participants without the defined outcome at DCCT closeout. †p<0.001; ‡p=0.0125
former intensive vs. conventional
Outcome measure Group DCCT closeout* EDIC year 13/14
Clinically evident DPN
Intensive
Conventional
57 (11)†
96 (18)
145 (29)
154 (34)
Abnormal nerve
conduction studies
Intensive
Conventional
73 (18)†
137 (36)
195 (45)
151 (52)
Confirmed DPN
Intensive
Conventional
32 (6)†
75 (14)
117 (22)‡
136 (28)](https://image.slidesharecdn.com/23marchdcctfinal-160327195451/85/DCCT-Learned-Lessons-46-320.jpg)

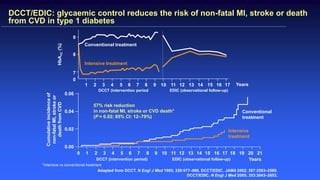
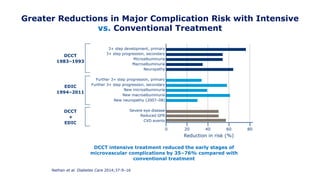

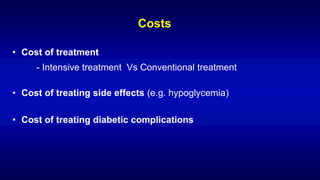
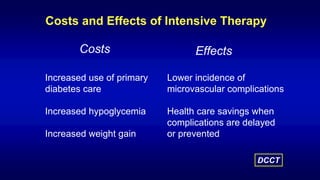


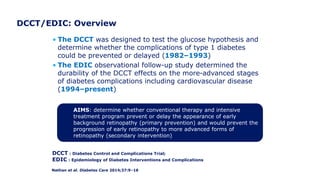
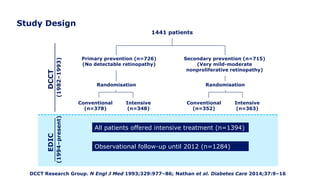
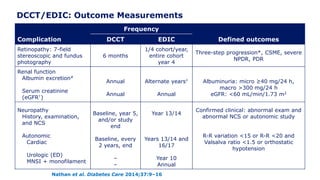
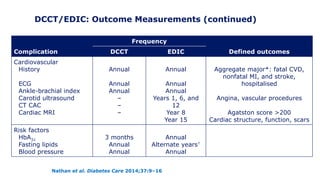
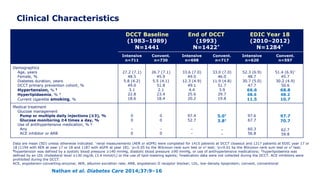
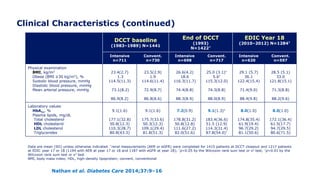
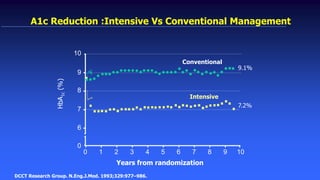
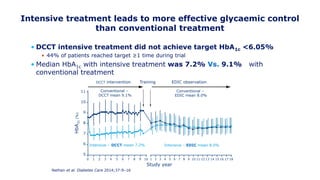
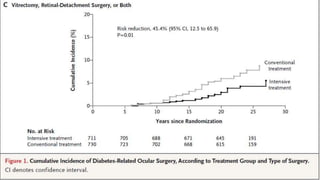
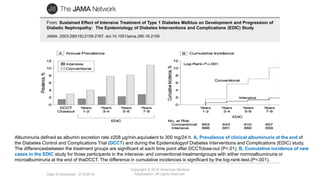
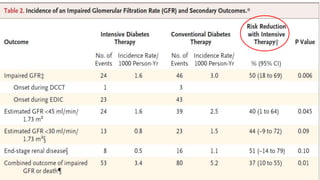
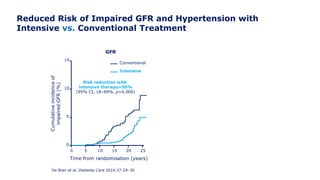
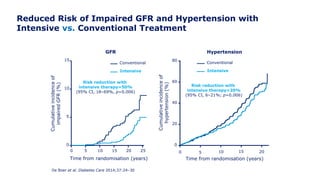
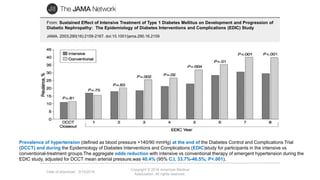
The 30+ year DCCT-EDIC trial provided important insights into the long-term effects of intensive glycemic control in type 1 diabetes patients. The DCCT found that intensive control significantly reduced the risk of developing diabetic complications compared to conventional treatment. The EDIC observational follow-up study found these benefits were durable, and intensive control continued to have beneficial effects on complications even after glycemic control was relaxed. Together, DCCT-EDIC established intensive glycemic control as the standard of care for type 1 diabetes and demonstrated its benefits in both preventing and delaying complications over the long term.


![CTEV [ clubfoot] DR ARUN LAL ,DR MOHAMED ASHRAF travancore medical college k...](https://cdn.slidesharecdn.com/ss_thumbnails/ctevclubfootdrarunlaldrmohamedashraftravancoremedicalcollegekollamkeralaindia-260208063247-18fc466c-thumbnail.jpg?width=640&height=640&fit=bounds)


