Downloaded 135 times


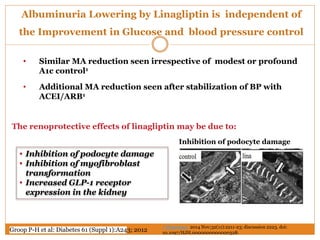
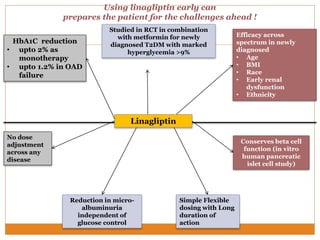
![Linagliptin and Glimepiride
Variables Linagliptin Glimepiride
HbA1C
FPG, PPG
PP Glucagon No change
Pro-Insulin
(marker of decreasing
Beta cell function)
PAI-1 (procoagulant &
marker of endothelial
dysfunction)
Forst T et al. Diabetes Metab Res Rev. 2014 Jan 23. doi: 10.1002/dmrr.2525. [Epub ahead of print]
GLP-1 based therapies improve the conversion of intact pro-
insulin into insulin and c-peptide
2014 Forst et al](https://image.slidesharecdn.com/enrichjan-160329074337/85/Enrich-Programme-10-320.jpg)
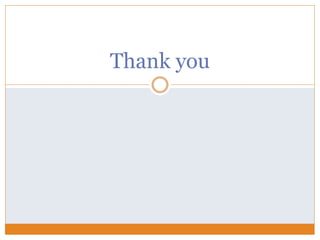
![54% significant relative risk reduction in CV events
for Trajenta® compared with glimepiride
Source: Gallwitz B, et al. Lancet. 2012;380:475–483
Composite
endpoint
(patients)1
SU
Add on MET
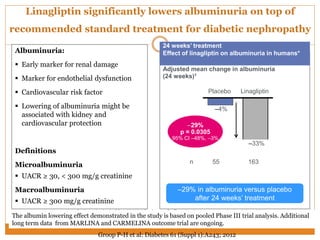
N=775
Relative risk3
Trajenta® better SU better
x
11/21/41/8 2 4 8
Trajenta®
Add on MET
N= 776
12 26 0.46 [0.23, 0.91]
p-value2
0.02
Note: All events independently adjudicated by CEC, all endpointsprespecified (also for individual studies) from CV meta-analysis statistical plan.
Individual events may not add up to total of the composite endpoint, because one patient could have experienced more than one CV event
Overall
CV events
No increase in CV risk](https://image.slidesharecdn.com/enrichjan-160329074337/85/Enrich-Programme-21-320.jpg)
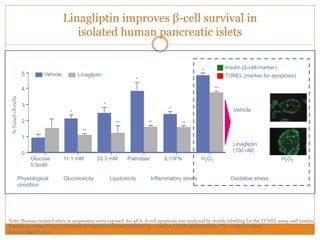
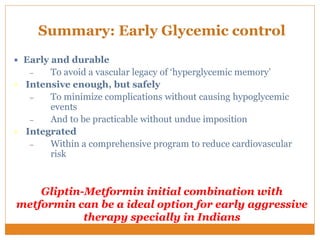
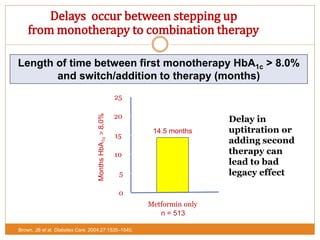
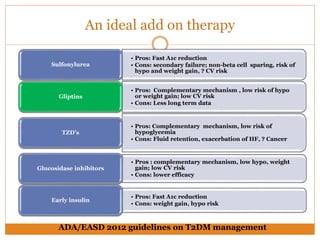

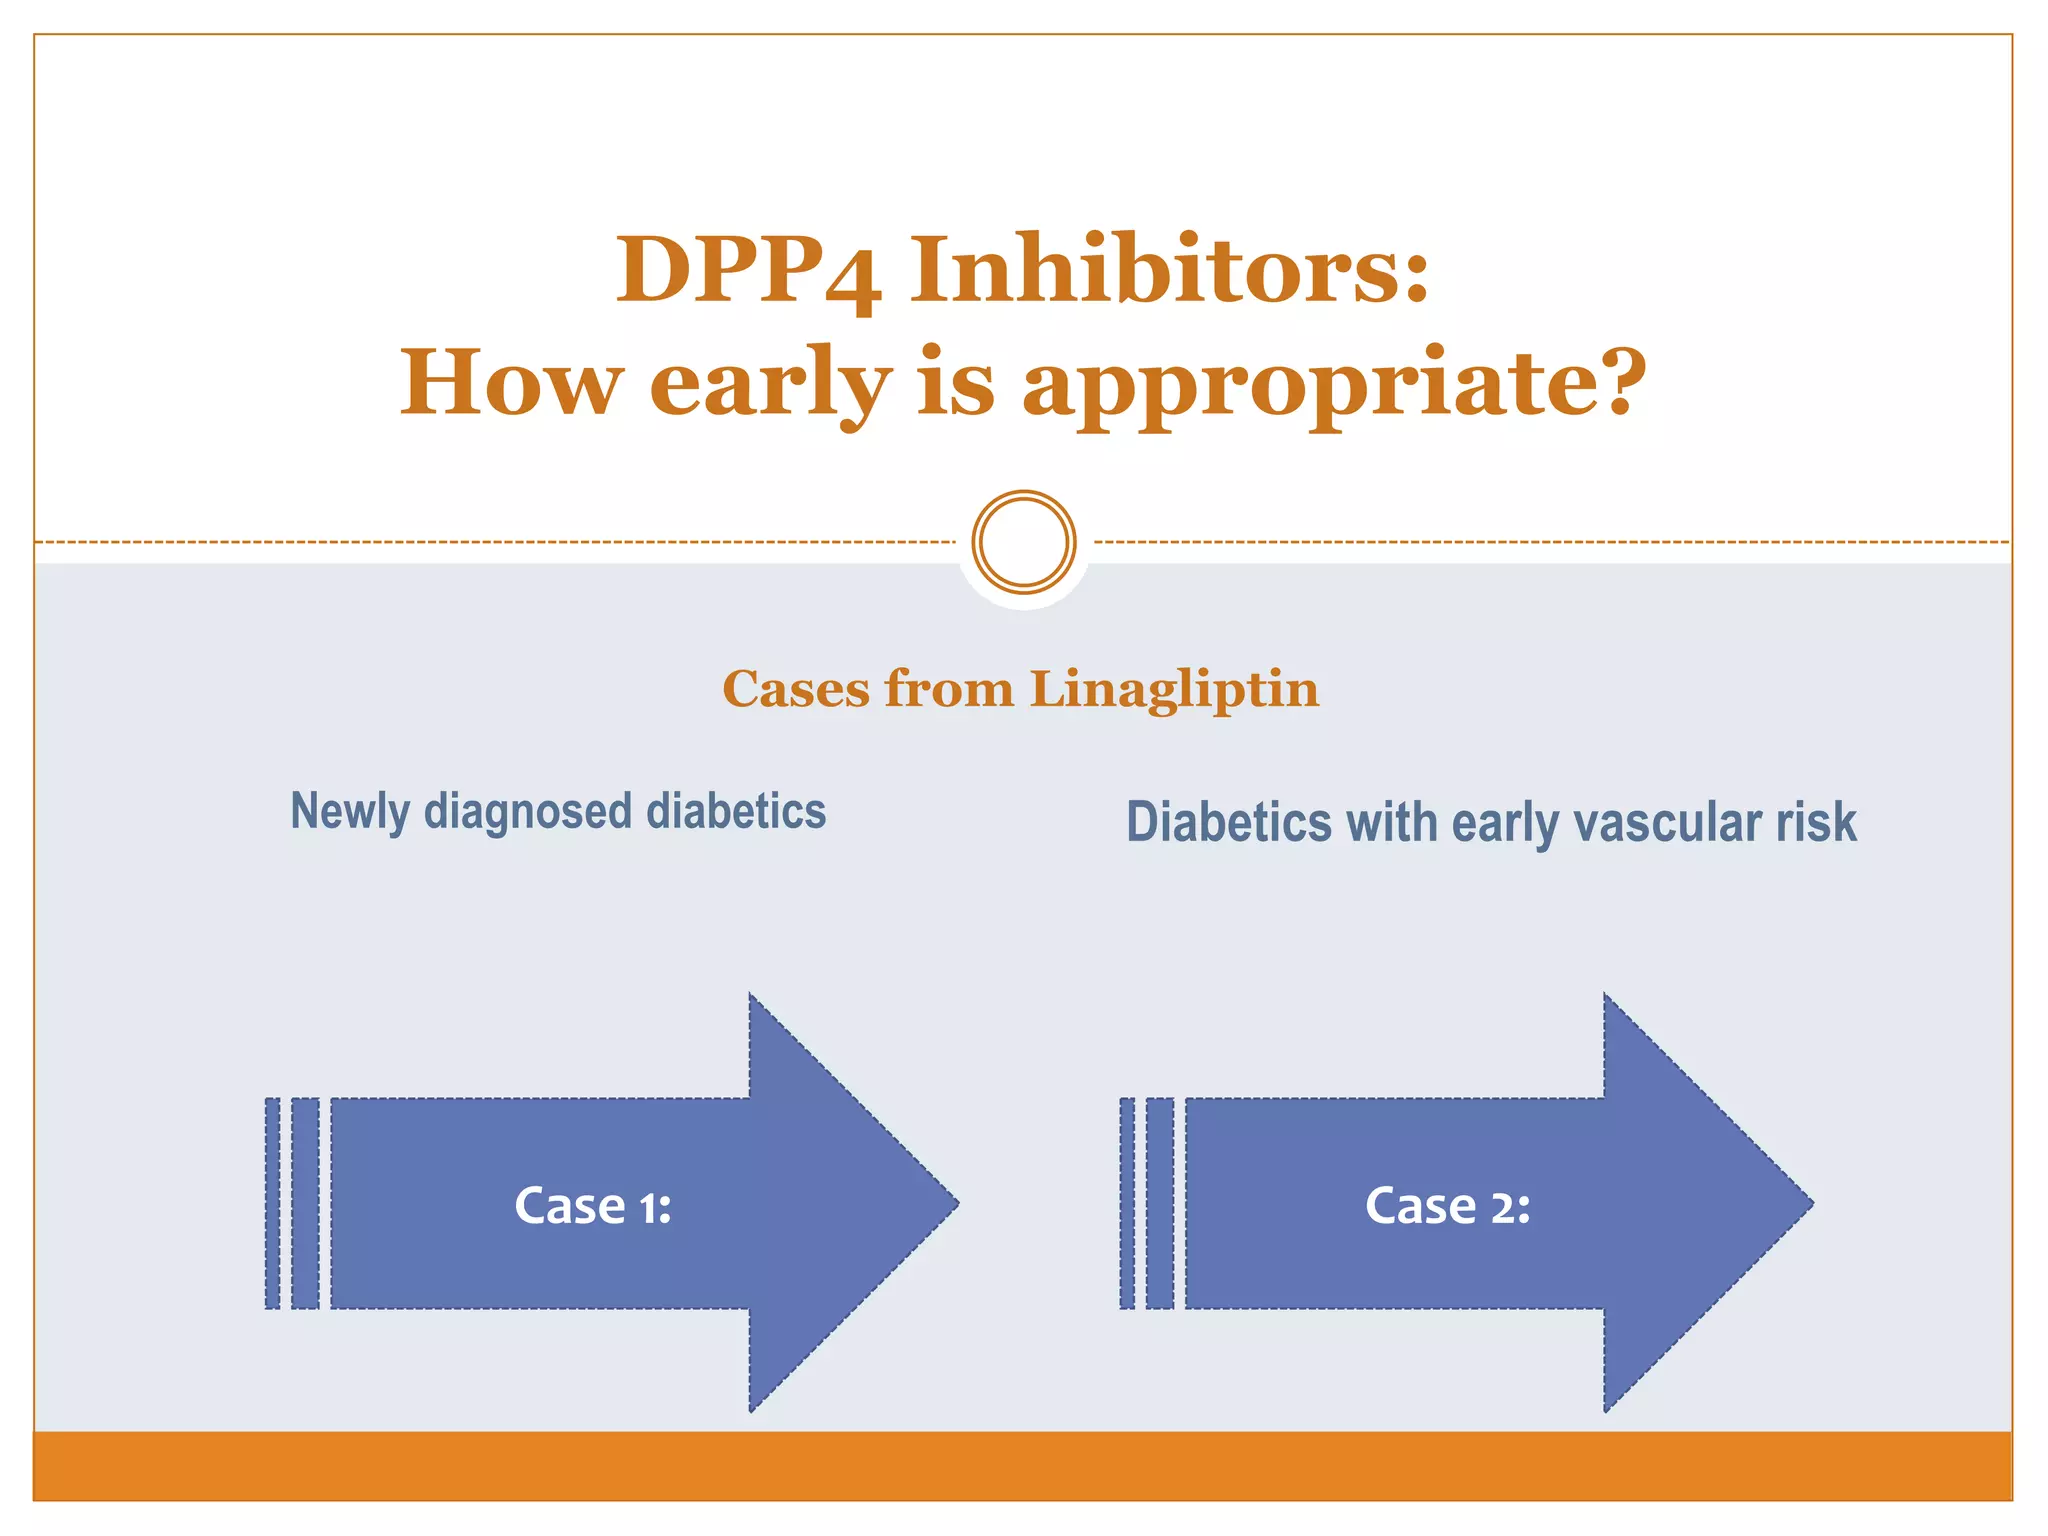
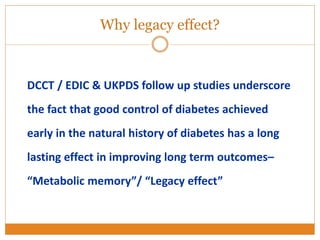
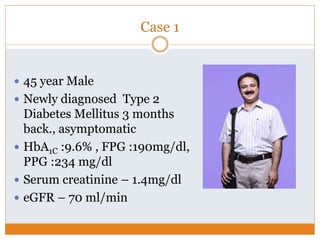
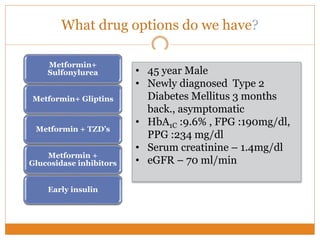
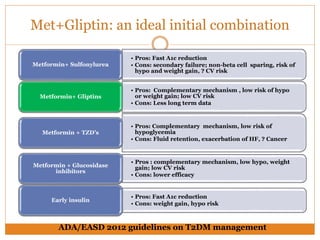
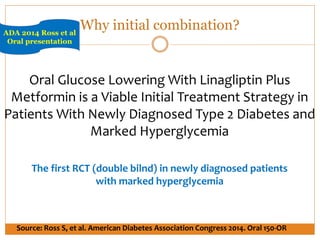
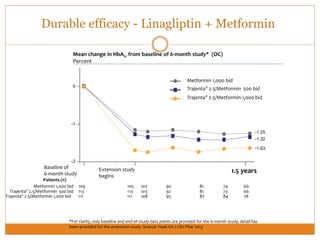
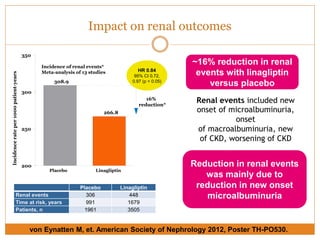
The document discusses the use of DPP-4 inhibitors like linagliptin in newly diagnosed type 2 diabetes patients with a focus on achieving early glycemic control to promote a 'legacy effect' that improves long-term outcomes. It presents two case studies that emphasize proactive treatment strategies, glycemic targets, and various drug combinations like metformin with gliptins to prevent vascular complications associated with diabetes. The findings suggest that early and coordinated management of diabetes could significantly reduce future cardiovascular and renal risks.


