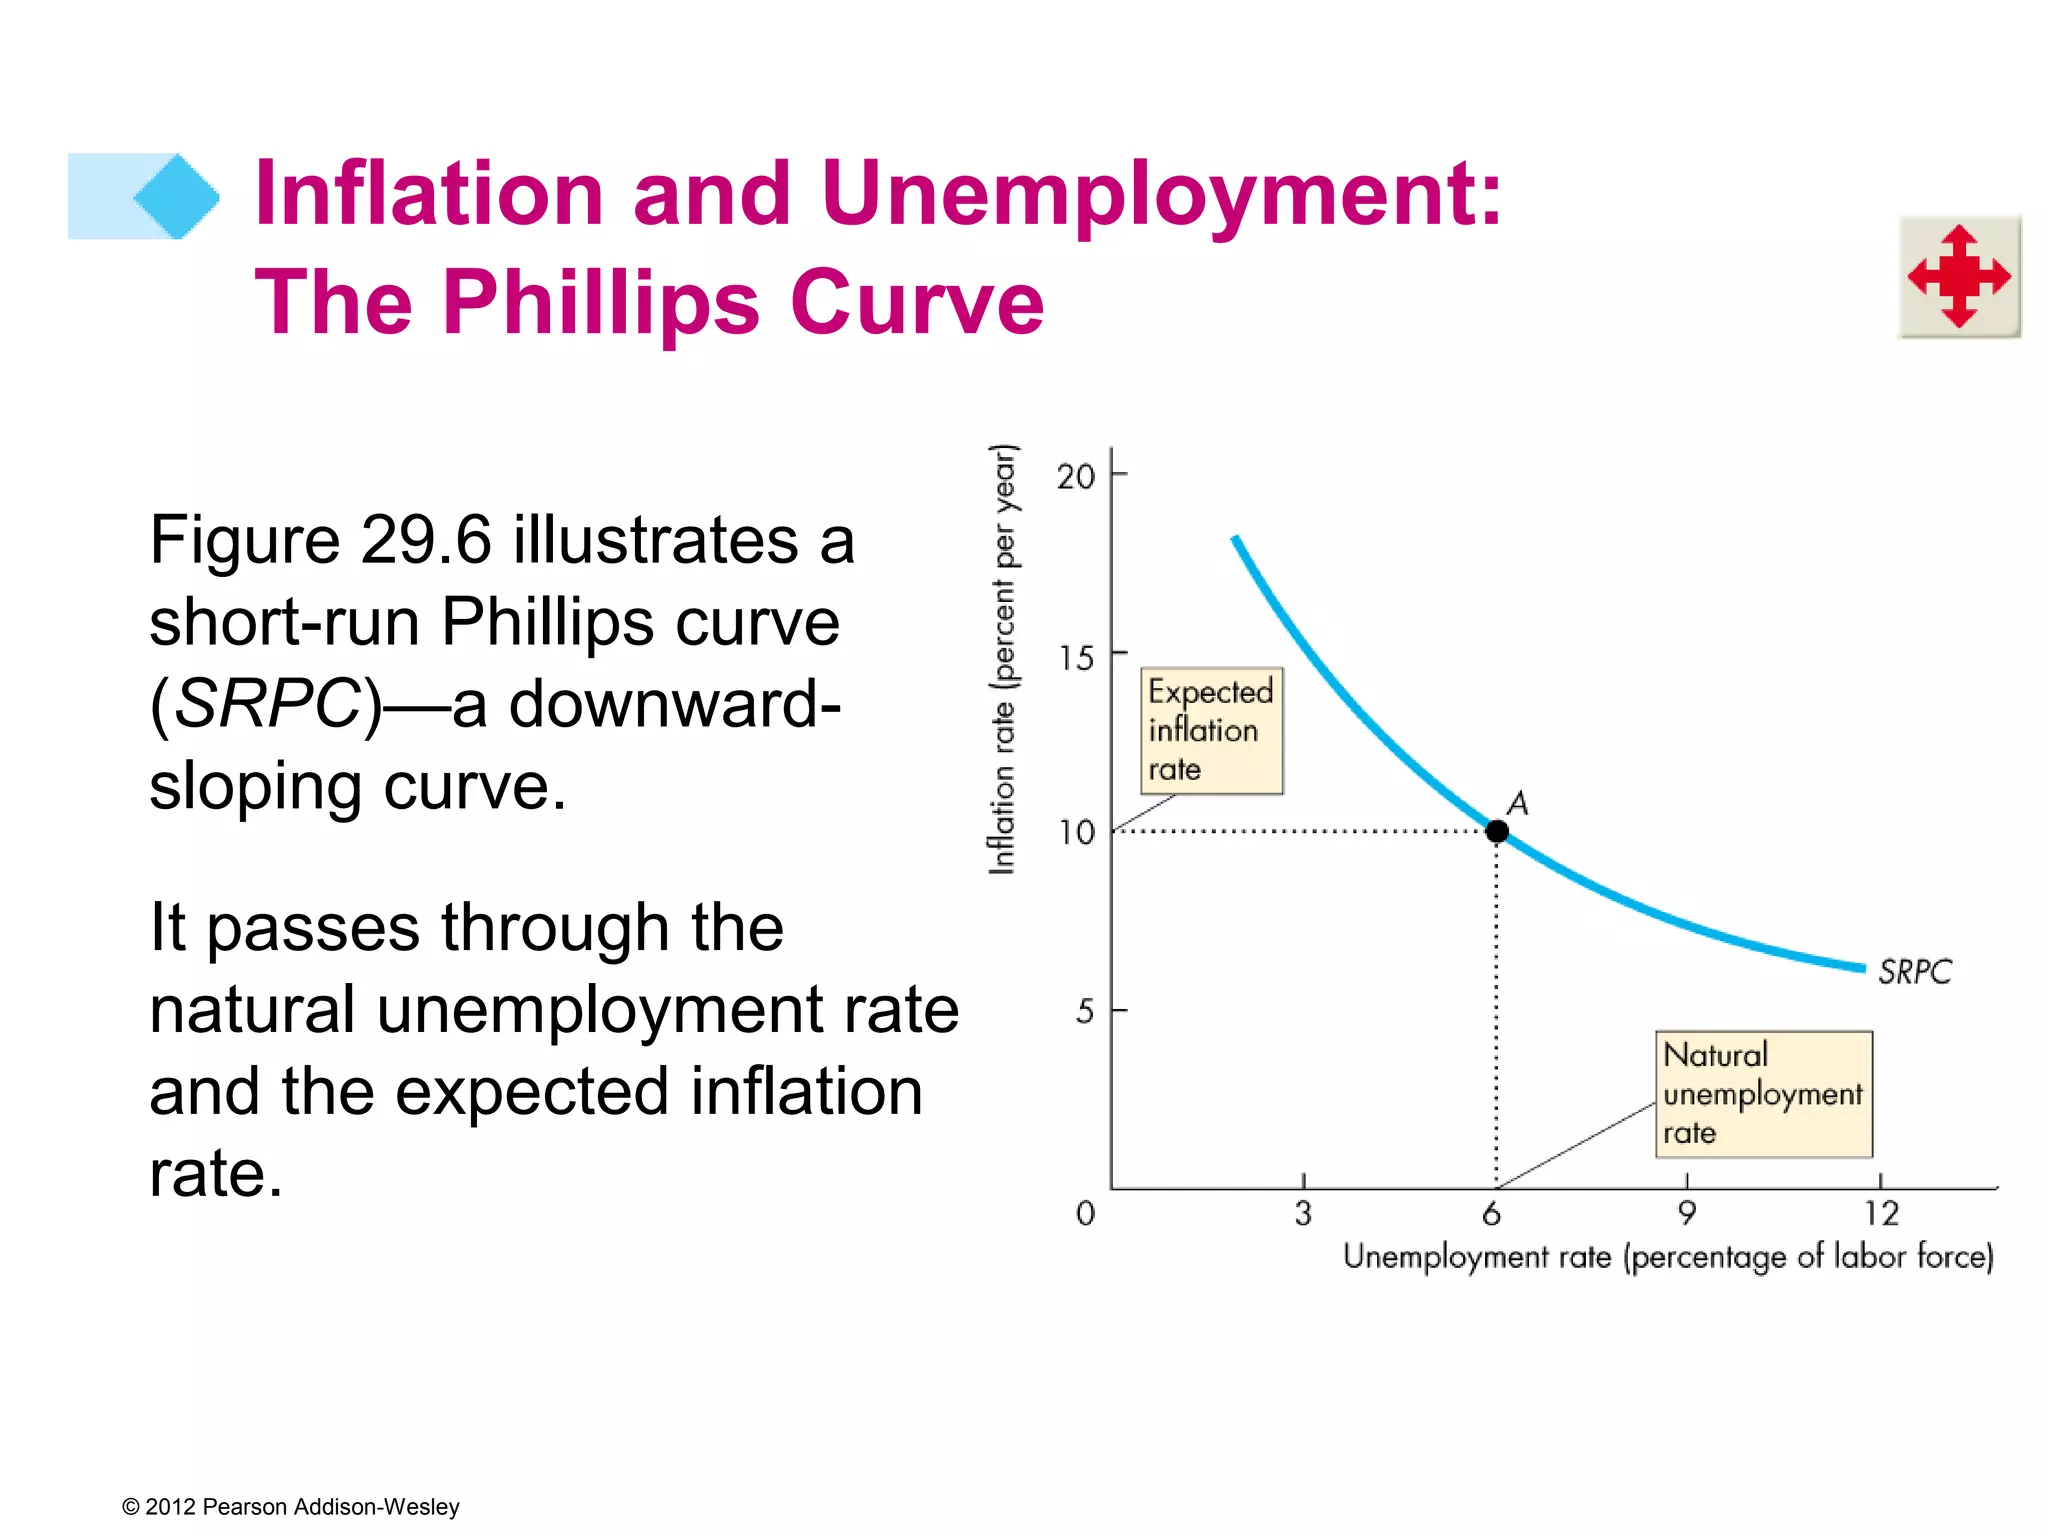
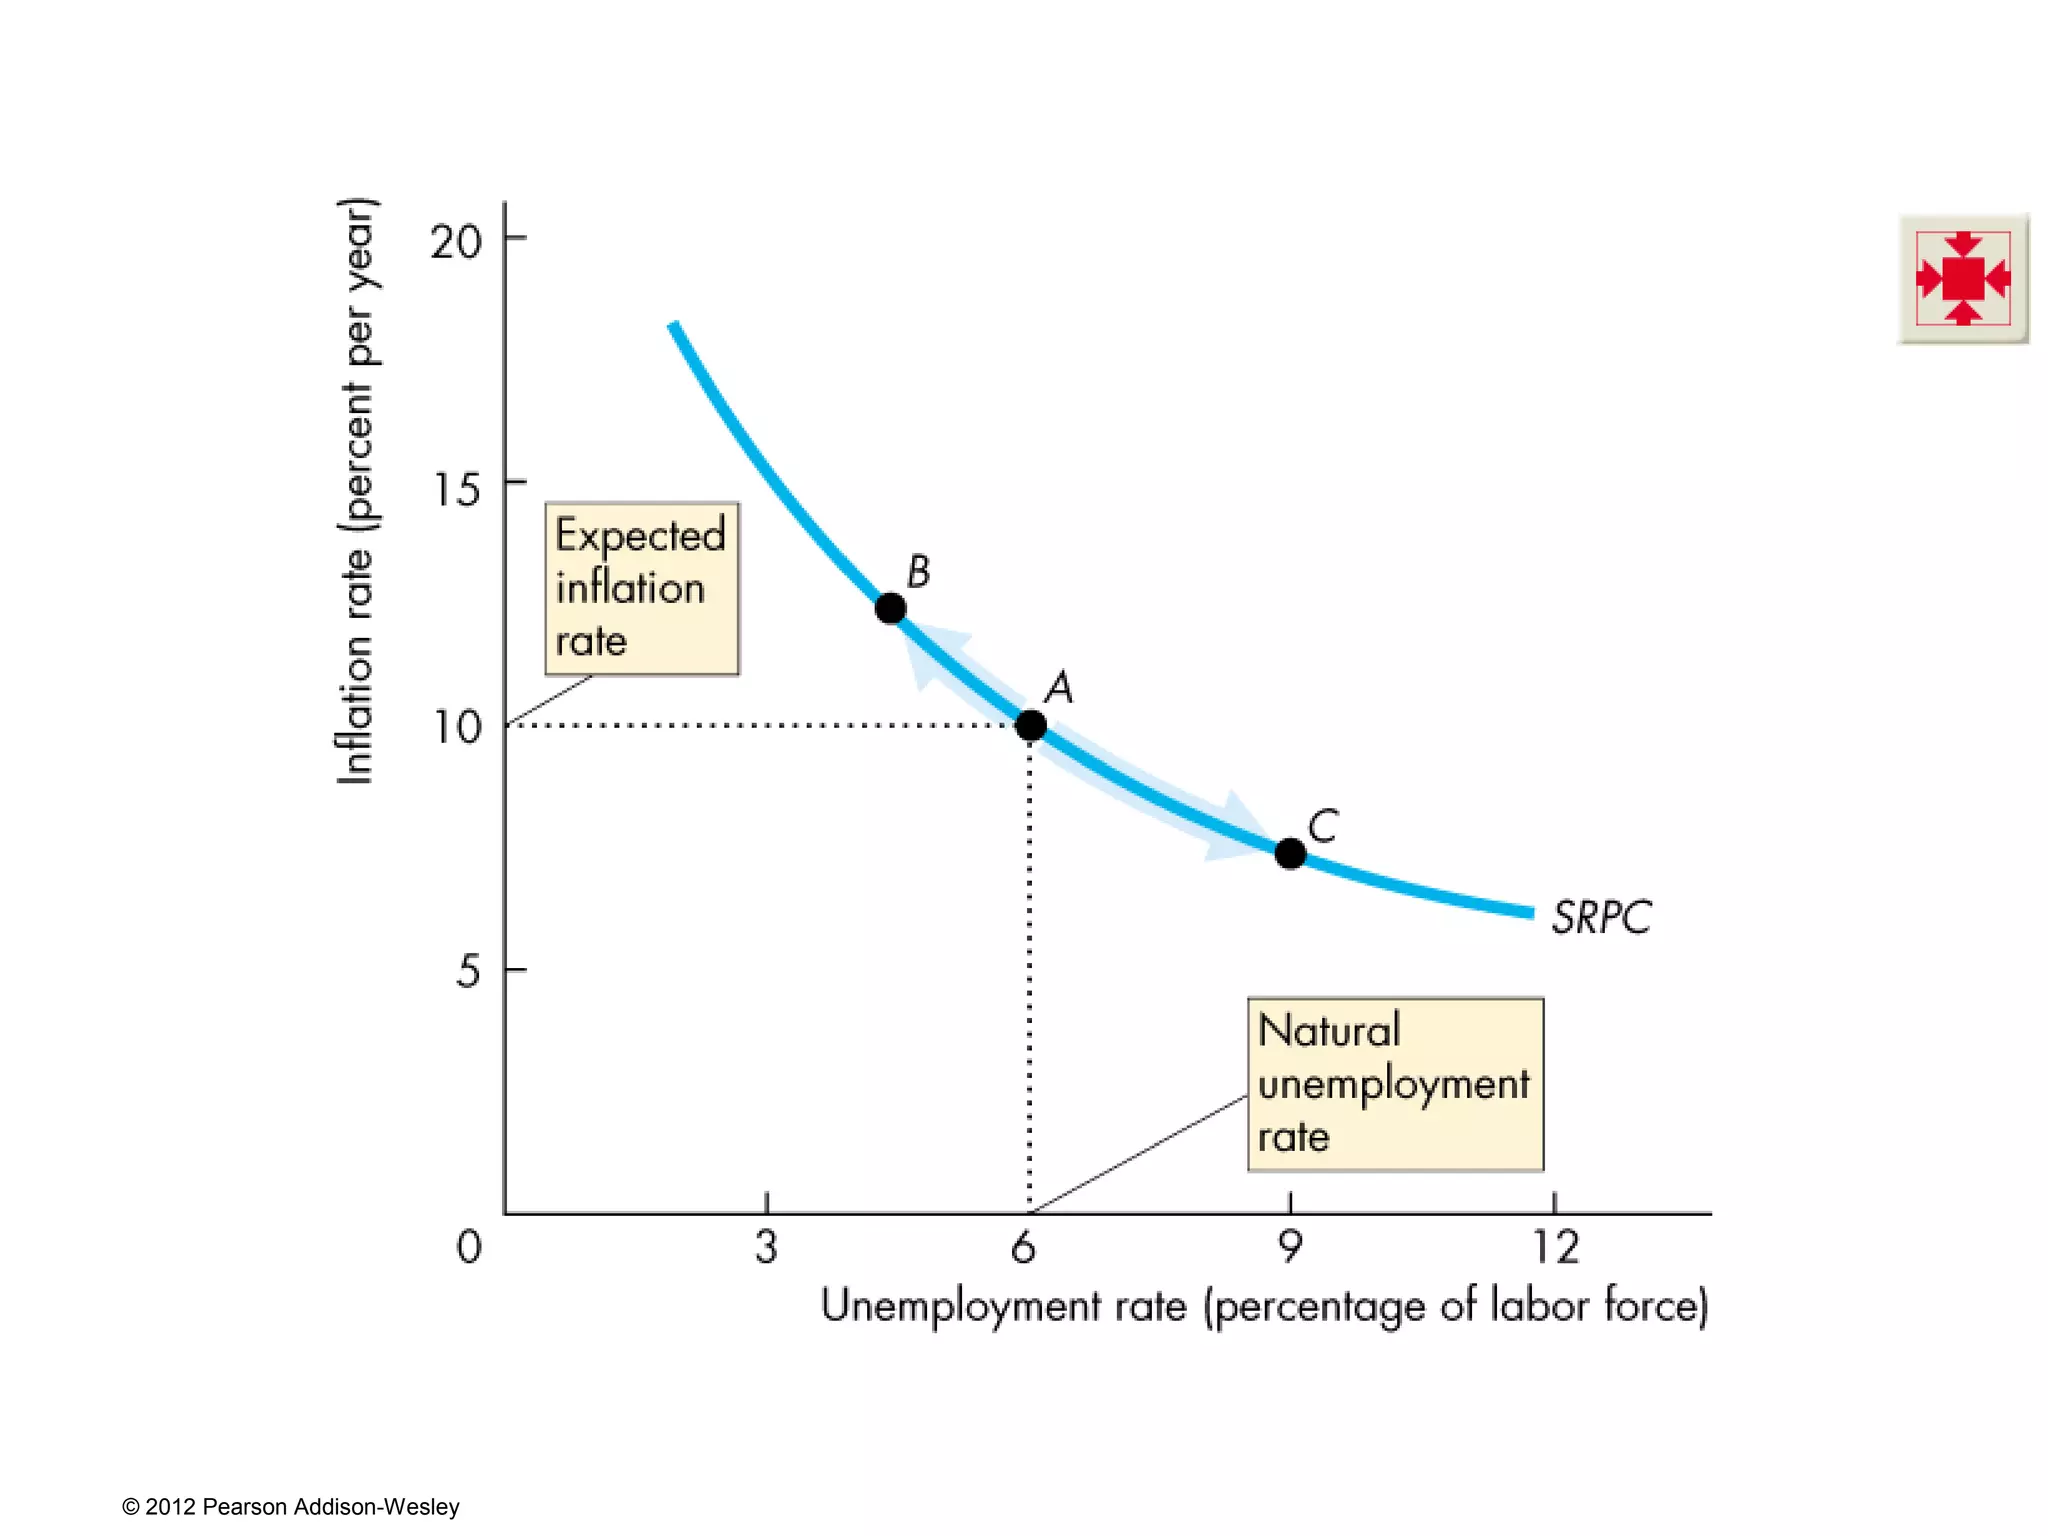
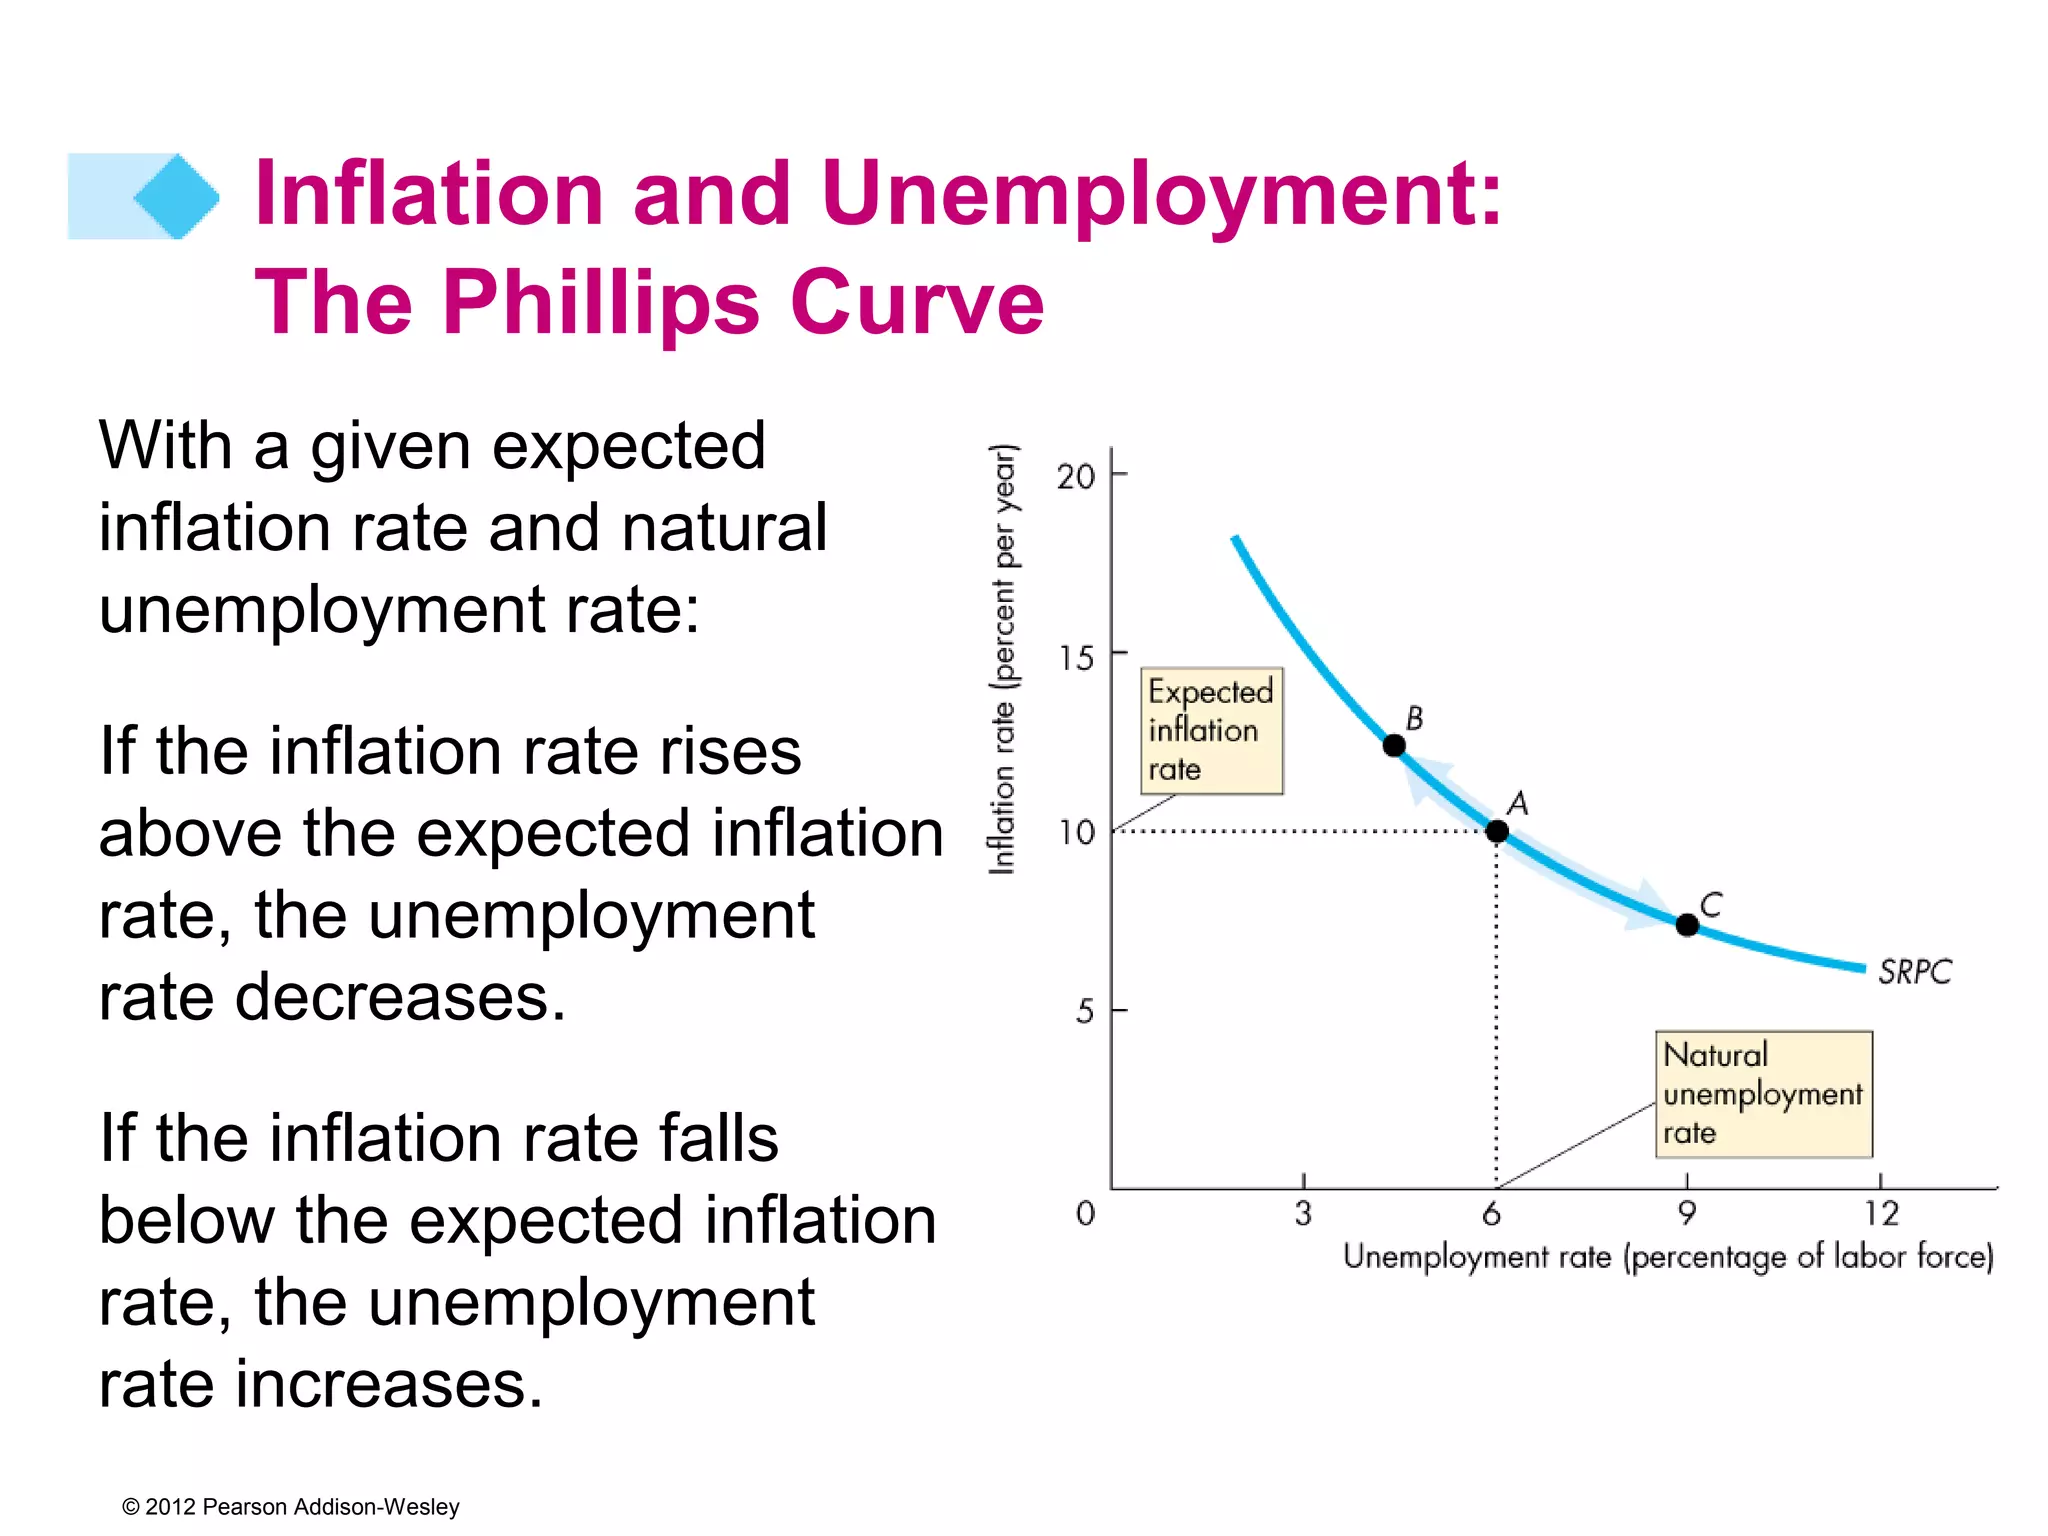
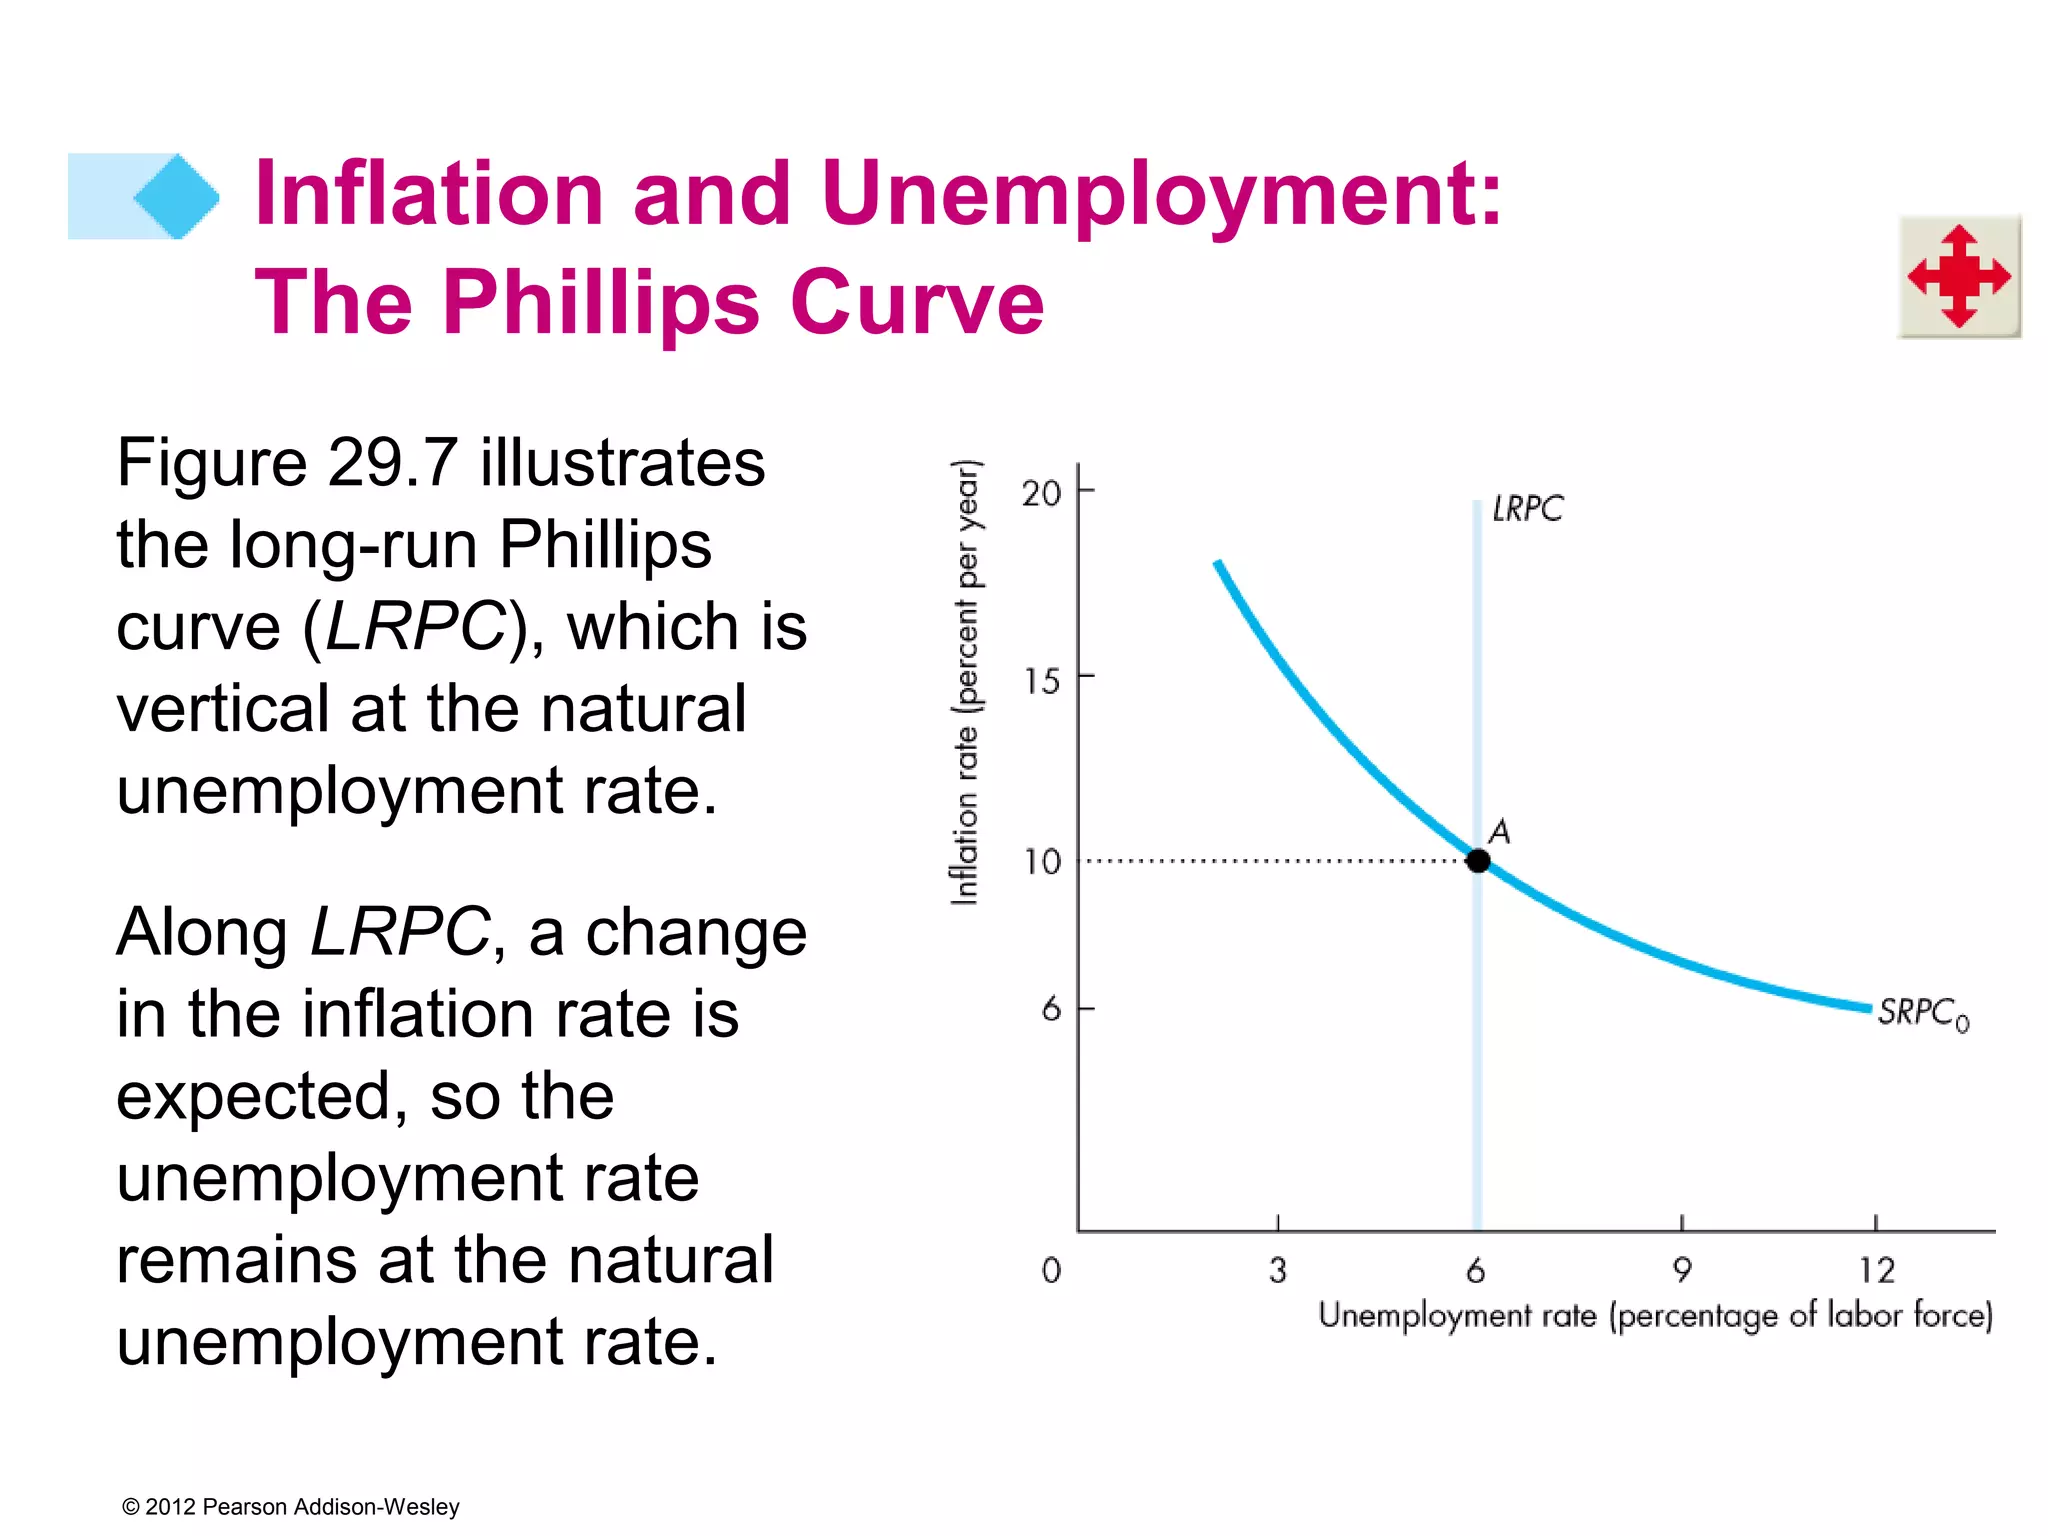
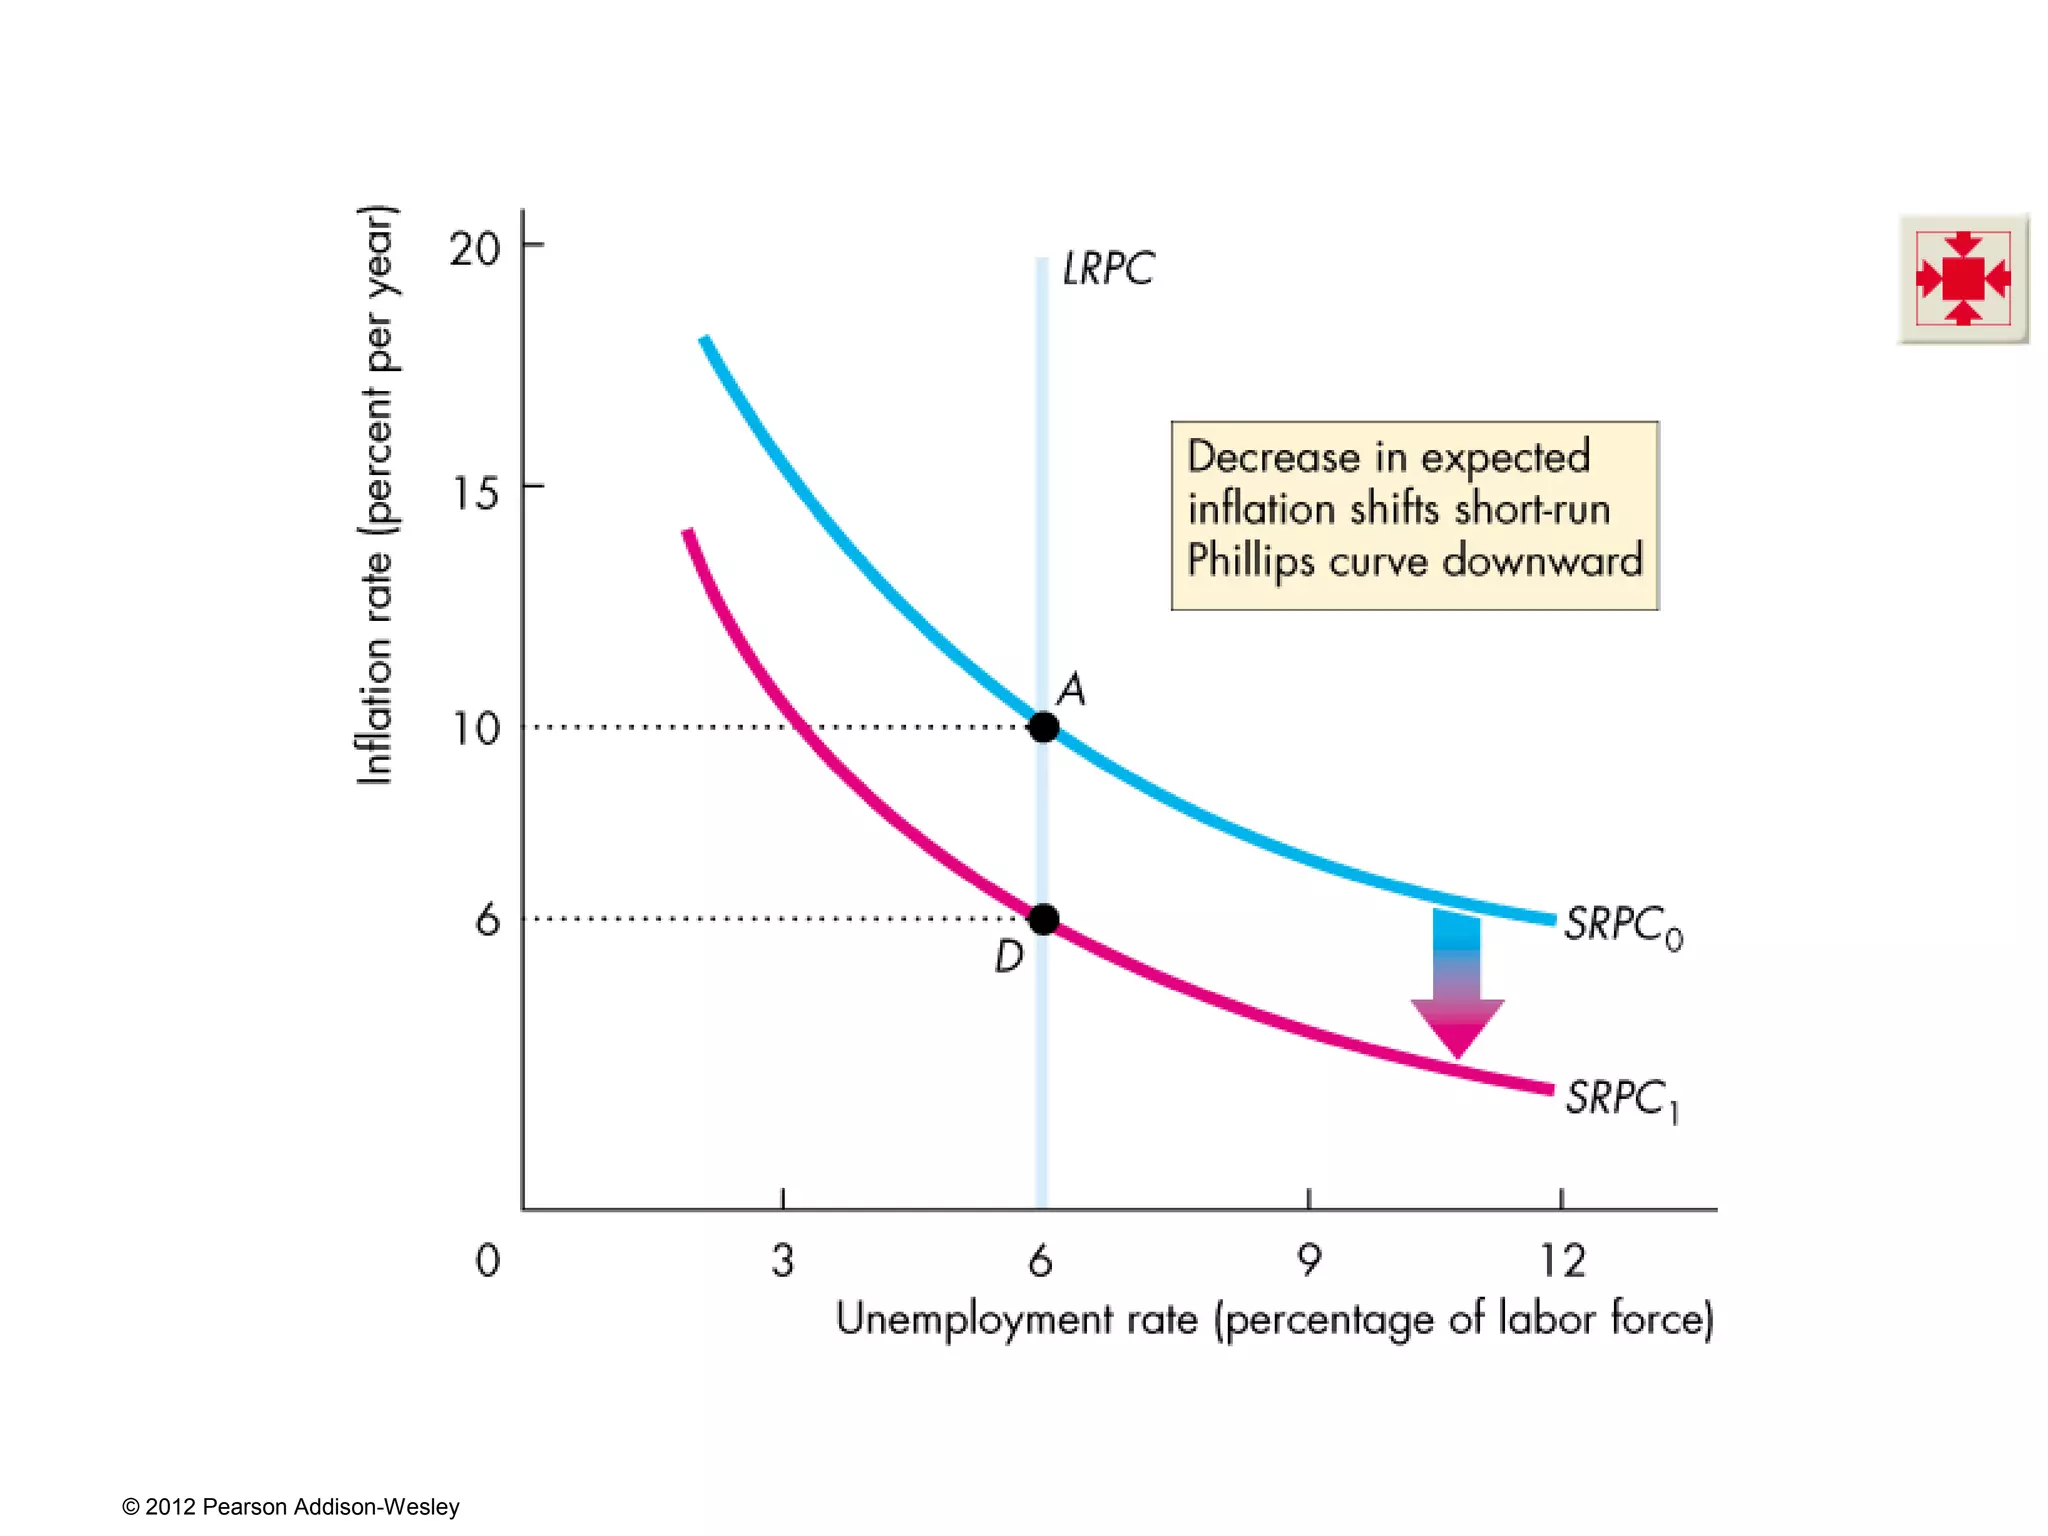
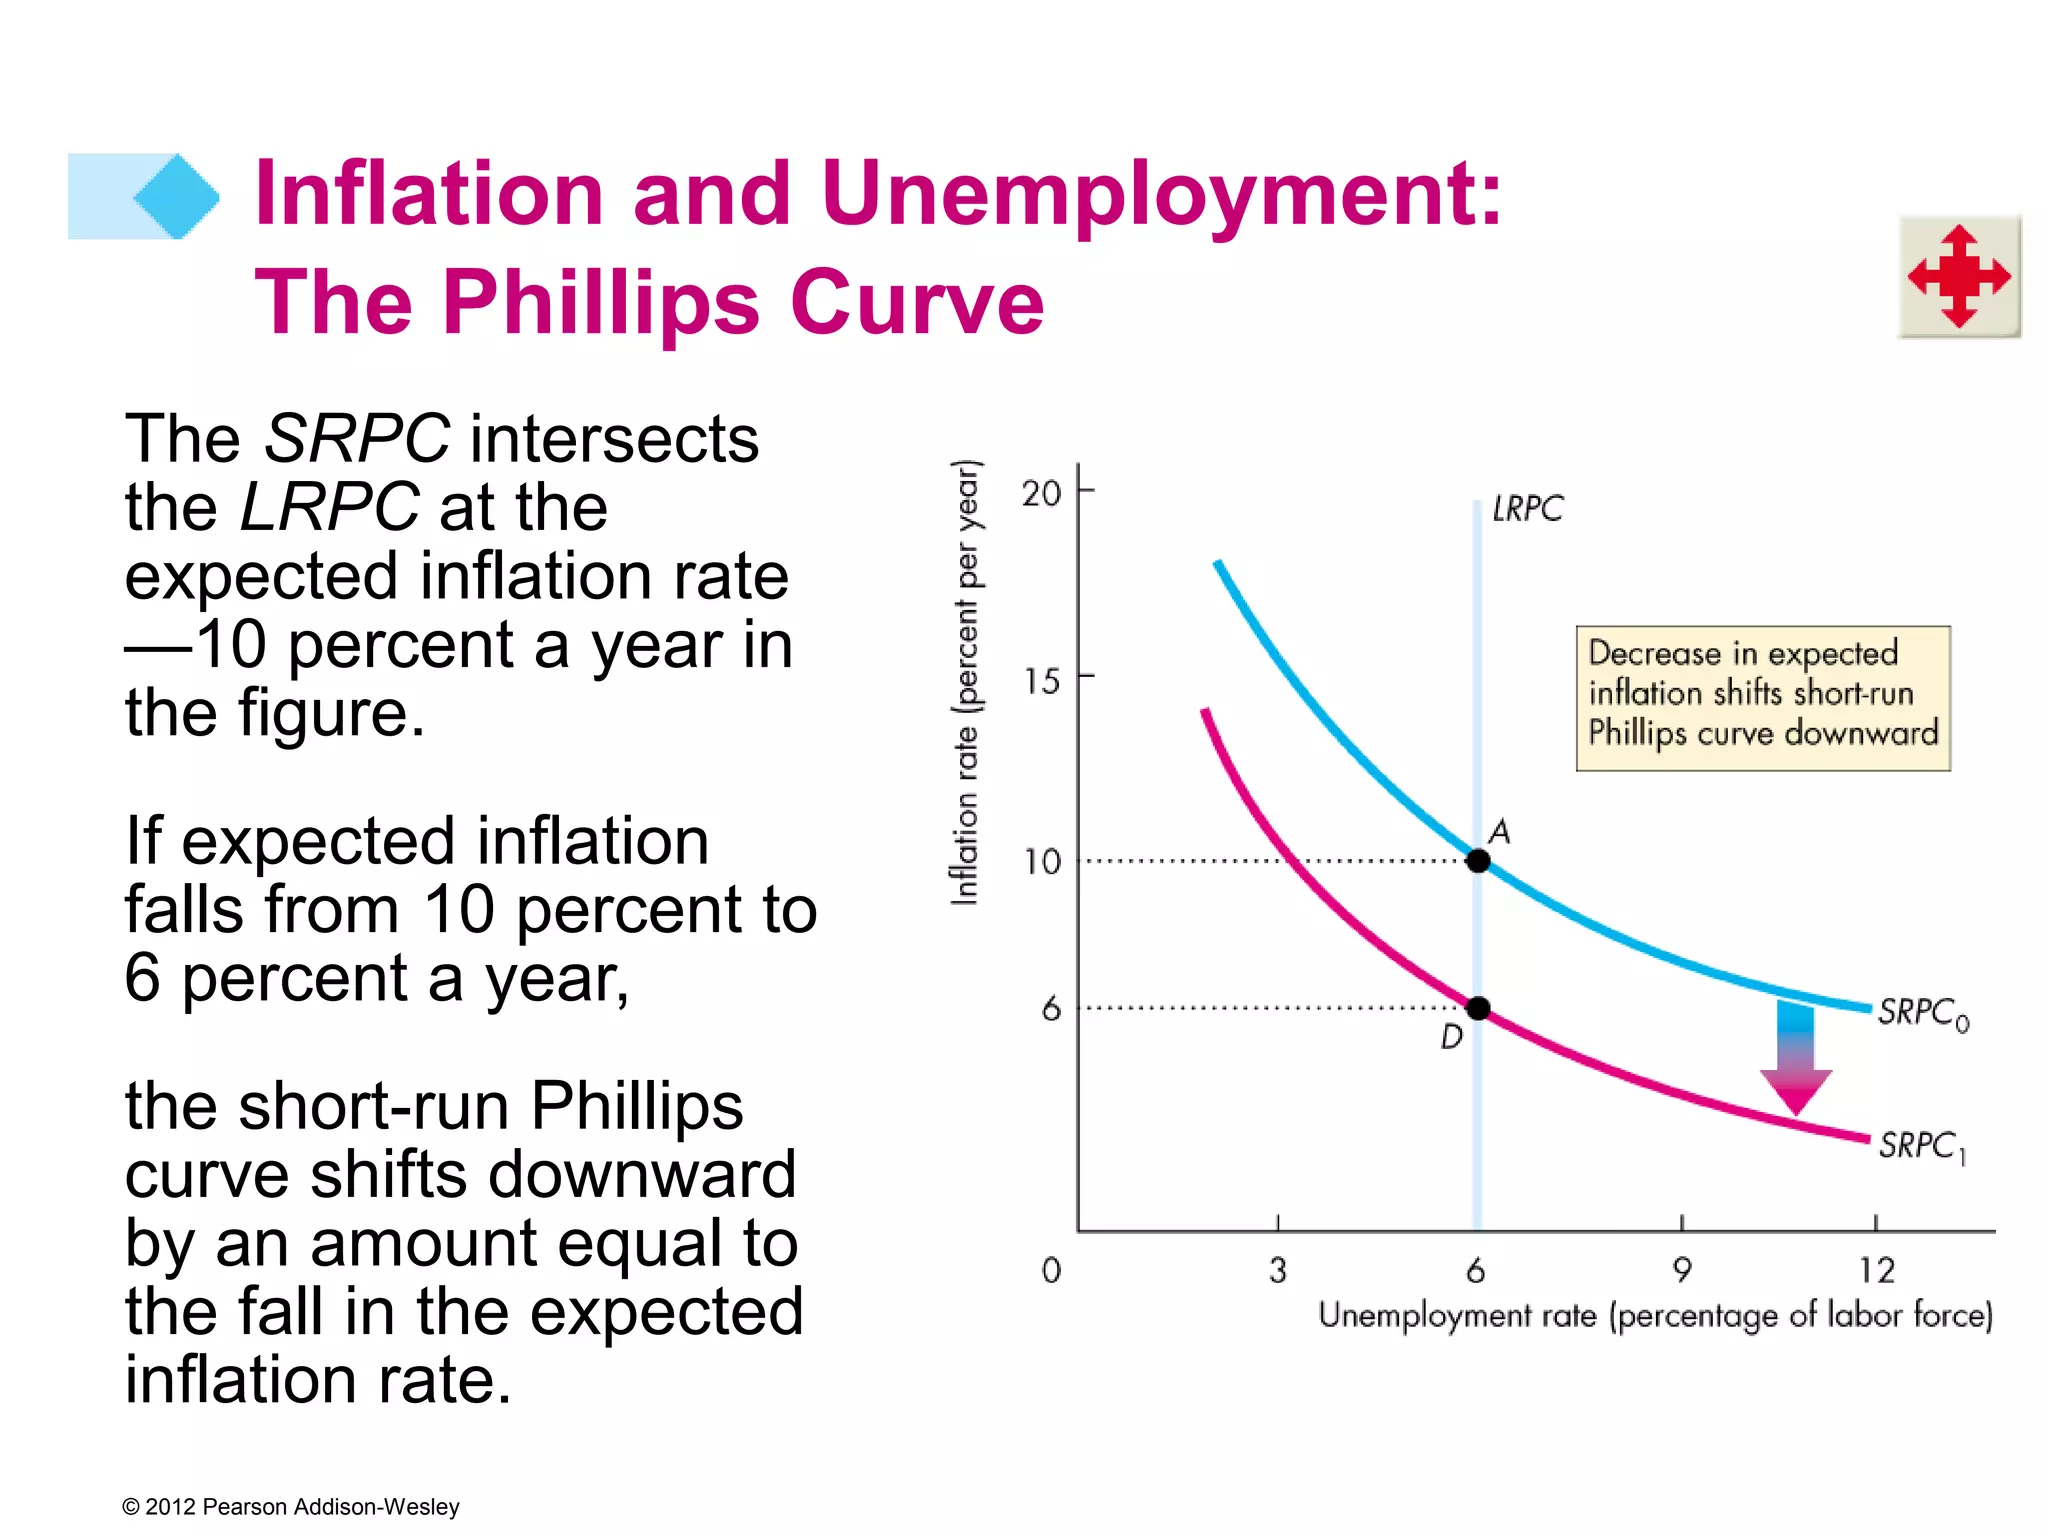
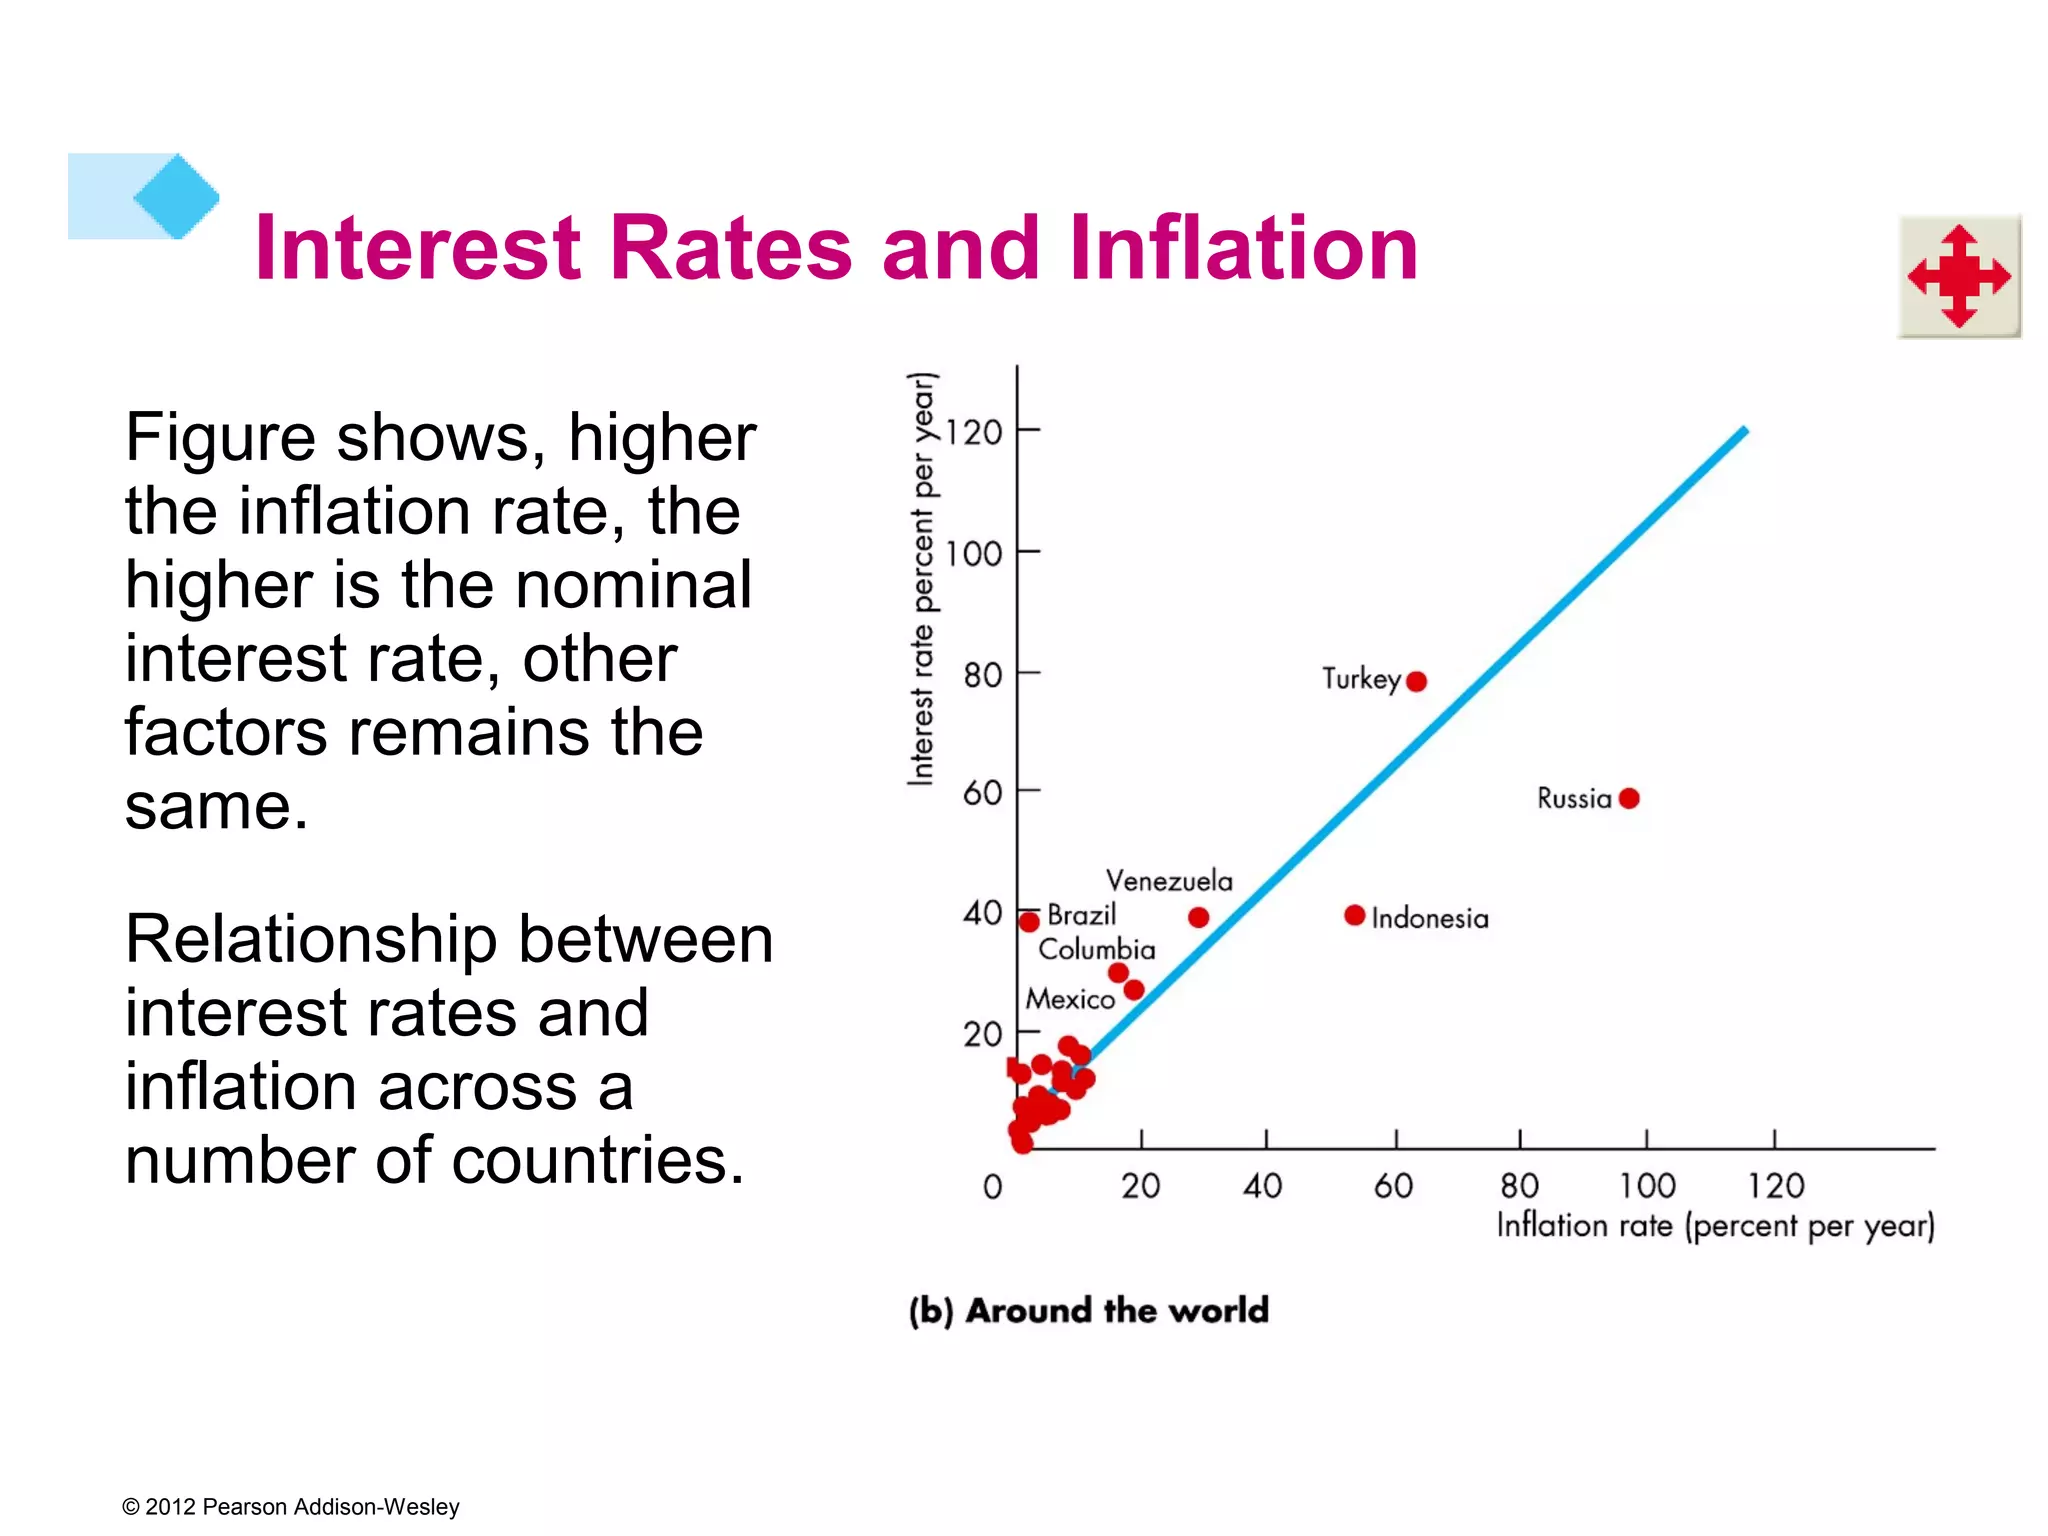
29
INFLATION
            GROUP I
            Osman Khan (12539)
            Haris Mumtaz (12606)
            Zeeshan Valliani (12543)
We will cover
Short-run Phillips curve
Long-run Phillips curve
Inflation & Interest rates
Inflation and Unemployment:
           The Phillips Curve

  A Phillips curve is a curve that shows the relationship
  between the inflation rate and the unemployment rate.
  There are two time frames for Phillips curves:
   The short-run Phillips curve
   The long-run Phillips curve


© 2012 Pearson Addison-Wesley
Inflation and Unemployment:
           The Phillips Curve


The Short-Run Phillips Curve
  The short-run Phillips curve shows the tradeoff between
  the inflation rate and unemployment rate, holding constant
  1. The expected inflation rate
  2. The natural unemployment rate


© 2012 Pearson Addison-Wesley
Inflation and Unemployment:
           The Phillips Curve

  Figure 29.6 illustrates a
  short-run Phillips curve
  (SRPC)—a downward-
  sloping curve.

  It passes through the
  natural unemployment rate
  and the expected inflation
  rate.


© 2012 Pearson Addison-Wesley
Inflation and Unemployment:
           The Phillips Curve
With a given expected
inflation rate and natural
unemployment rate:

If the inflation rate rises
above the expected inflation
rate, the unemployment
rate decreases.

If the inflation rate falls
below the expected inflation
rate, the unemployment
rate increases.
© 2012 Pearson Addison-Wesley
Inflation and Unemployment:
           The Phillips Curve

The Long-Run Phillips Curve
  The long-run Phillips curve shows the relationship
  between inflation and unemployment when the actual
  inflation rate equals the expected inflation rate.


© 2012 Pearson Addison-Wesley
Inflation and Unemployment:
           The Phillips Curve
Figure 29.7 illustrates
the long-run Phillips
curve (LRPC), which is
vertical at the natural
unemployment rate.

Along LRPC, a change
in the inflation rate is
expected, so the
unemployment rate
remains at the natural
unemployment rate.

© 2012 Pearson Addison-Wesley
Inflation and Unemployment:
           The Phillips Curve
The SRPC intersects
the LRPC at the
expected inflation rate
—10 percent a year in
the figure.
If expected inflation
falls from 10 percent to
6 percent a year,
the short-run Phillips
curve shifts downward
by an amount equal to
the fall in the expected
inflation rate.
© 2012 Pearson Addison-Wesley
Interest Rates and Inflation
Why Interest rates and Inflation vary across
countries over time?


How interest rates are determined?


Why Inflation influences Nominal Interest rates?


© 2012 Pearson Addison-Wesley
Interest Rates and Inflation
We know that interest rates vary among countries.
For instance, US has interest rate of around 6% a
year, Russia 60% a year and Turkey 80% a year.
Although US interest rates has never been as high.


Risk differences make real interest rate vary across
countries. Higher-risk countries pay higher interest
rates than do low-risk countries


© 2012 Pearson Addison-Wesley
Interest Rates and Inflation
Figure shows, higher
the inflation rate, the
higher is the nominal
interest rate, other
factors remains the
same.
Relationship between
interest rates and
inflation across a
number of countries.


© 2012 Pearson Addison-Wesley
How interest rates are determined

Real interest rates are determined by investment
demand and savings supply in the global market for
financial capital. It vary around the world-average real
interest rate because of the national differences in
risk.
Nominal interest rates are determined by the demand
and supply of money in each nation’s money market.
Demand for money is determined by nominal interest
rate and the Supply by Central bank – US Fed in
United States.


© 2012 Pearson Addison-Wesley
Why Inflation influences the Nominal
           interest rate
1 percentage point rise in inflation leads to the 1
percentage point rise in the nominal interest rates.
Why?
Because Capital markets and money markets are
closely interconnected. The investment, saving and
the demand for money decisions that people make
are connected and result is that equilibrium nominal
interest rate approximately equals the real interest
rate plus expected inflation rate.


© 2012 Pearson Addison-Wesley
Key Points
The higher the expected inflation rate, the higher is
the nominal interest rate.
As anticipated inflation rises, borrowers willingly pay a
higher interest rate and lenders successfully demand
a higher interest rate.
The nominal rate adjusts to equal the real interest
rate plus the expected inflation rate.


© 2012 Pearson Addison-Wesley
Thank You

               All Questions and Feedbacks are welcome


© 2012 Pearson Addison-Wesley

Phillips Curve, Inflation & Interest Rate

  • 1.
    29 INFLATION GROUP I Osman Khan (12539) Haris Mumtaz (12606) Zeeshan Valliani (12543)
  • 2.
    We will cover Short-runPhillips curve Long-run Phillips curve Inflation & Interest rates
  • 3.
    Inflation and Unemployment: The Phillips Curve A Phillips curve is a curve that shows the relationship between the inflation rate and the unemployment rate. There are two time frames for Phillips curves:  The short-run Phillips curve  The long-run Phillips curve © 2012 Pearson Addison-Wesley
  • 4.
    Inflation and Unemployment: The Phillips Curve The Short-Run Phillips Curve The short-run Phillips curve shows the tradeoff between the inflation rate and unemployment rate, holding constant 1. The expected inflation rate 2. The natural unemployment rate © 2012 Pearson Addison-Wesley
  • 5.
    Inflation and Unemployment: The Phillips Curve Figure 29.6 illustrates a short-run Phillips curve (SRPC)—a downward- sloping curve. It passes through the natural unemployment rate and the expected inflation rate. © 2012 Pearson Addison-Wesley
  • 6.
    © 2012 PearsonAddison-Wesley
  • 7.
    Inflation and Unemployment: The Phillips Curve With a given expected inflation rate and natural unemployment rate: If the inflation rate rises above the expected inflation rate, the unemployment rate decreases. If the inflation rate falls below the expected inflation rate, the unemployment rate increases. © 2012 Pearson Addison-Wesley
  • 8.
    Inflation and Unemployment: The Phillips Curve The Long-Run Phillips Curve The long-run Phillips curve shows the relationship between inflation and unemployment when the actual inflation rate equals the expected inflation rate. © 2012 Pearson Addison-Wesley
  • 9.
    Inflation and Unemployment: The Phillips Curve Figure 29.7 illustrates the long-run Phillips curve (LRPC), which is vertical at the natural unemployment rate. Along LRPC, a change in the inflation rate is expected, so the unemployment rate remains at the natural unemployment rate. © 2012 Pearson Addison-Wesley
  • 10.
    © 2012 PearsonAddison-Wesley
  • 11.
    Inflation and Unemployment: The Phillips Curve The SRPC intersects the LRPC at the expected inflation rate —10 percent a year in the figure. If expected inflation falls from 10 percent to 6 percent a year, the short-run Phillips curve shifts downward by an amount equal to the fall in the expected inflation rate. © 2012 Pearson Addison-Wesley
  • 12.
    Interest Rates andInflation Why Interest rates and Inflation vary across countries over time? How interest rates are determined? Why Inflation influences Nominal Interest rates? © 2012 Pearson Addison-Wesley
  • 13.
    Interest Rates andInflation We know that interest rates vary among countries. For instance, US has interest rate of around 6% a year, Russia 60% a year and Turkey 80% a year. Although US interest rates has never been as high. Risk differences make real interest rate vary across countries. Higher-risk countries pay higher interest rates than do low-risk countries © 2012 Pearson Addison-Wesley
  • 14.
    Interest Rates andInflation Figure shows, higher the inflation rate, the higher is the nominal interest rate, other factors remains the same. Relationship between interest rates and inflation across a number of countries. © 2012 Pearson Addison-Wesley
  • 15.
    How interest ratesare determined Real interest rates are determined by investment demand and savings supply in the global market for financial capital. It vary around the world-average real interest rate because of the national differences in risk. Nominal interest rates are determined by the demand and supply of money in each nation’s money market. Demand for money is determined by nominal interest rate and the Supply by Central bank – US Fed in United States. © 2012 Pearson Addison-Wesley
  • 16.
    Why Inflation influencesthe Nominal interest rate 1 percentage point rise in inflation leads to the 1 percentage point rise in the nominal interest rates. Why? Because Capital markets and money markets are closely interconnected. The investment, saving and the demand for money decisions that people make are connected and result is that equilibrium nominal interest rate approximately equals the real interest rate plus expected inflation rate. © 2012 Pearson Addison-Wesley
  • 17.
    Key Points The higherthe expected inflation rate, the higher is the nominal interest rate. As anticipated inflation rises, borrowers willingly pay a higher interest rate and lenders successfully demand a higher interest rate. The nominal rate adjusts to equal the real interest rate plus the expected inflation rate. © 2012 Pearson Addison-Wesley
  • 18.
    Thank You All Questions and Feedbacks are welcome © 2012 Pearson Addison-Wesley

Editor's Notes

  • #4 The Phillips curve story nicely illustrates how progress is made in economics. The story starts in 1958 when Bill Phillips published his famous paper. At that time the mainstream economic model was the aggregate expenditure model presented in Chapter 25. The model was based on the assumption that the price level was constant, making the inflation rate zero. This assumption was not too unrealistic immediately after World War II. By 1955, though, the inflation rate began to creep higher and averaged 2.7 percent per year between 1956 and 1959. Inflation was beginning to be perceived as a problem, one that a model with a “fixed price level assumption” was poorly suited to solve. In this environment, economists gladly welcomed the simple, short-run Phillips curve, for it gave them a handle on inflation. They believed that they could predict the unemployment rate from their standard model and then combine this unemployment rate with the Phillips curve to determine the resulting inflation rate. The vital assumption in this procedure is that the Phillips curve captures a fixed tradeoff between the actual inflation rate and the unemployment rate that is part of the economy’s structure. This type of analysis reached its peak of popularity during the early and middle 1960s. But by 1967 it was under attack. On a theoretical level, Ned Phelps and Milton Friedman pointed out the flimsy justification behind the simple, fixed Phillips curve assumption. On an empirical level, the fixed Phillips curve failed as the inflation rate rose toward the end of the 1960s and into the 1970s: the unemployment rate did not fall as predicted by the fixed Phillips curve. At this point the idea of a long-run Phillips curve (as distinct from the short-run one) was developed. The concept that aggregate supply is an important component of macroeconomics was taking hold, as was the idea that short-run Phillips curves shift because of changes in people’s expectations. Thus the profession advanced significantly between the initial discussion of the Phillips curve and what students learn today. This advance was the result of the interaction between theory, suggesting that the idea of a fixed short-run Phillips curve was inadequate, and empirical work that reinforced the point that the simple, early approach was deficient.