Download to read offline

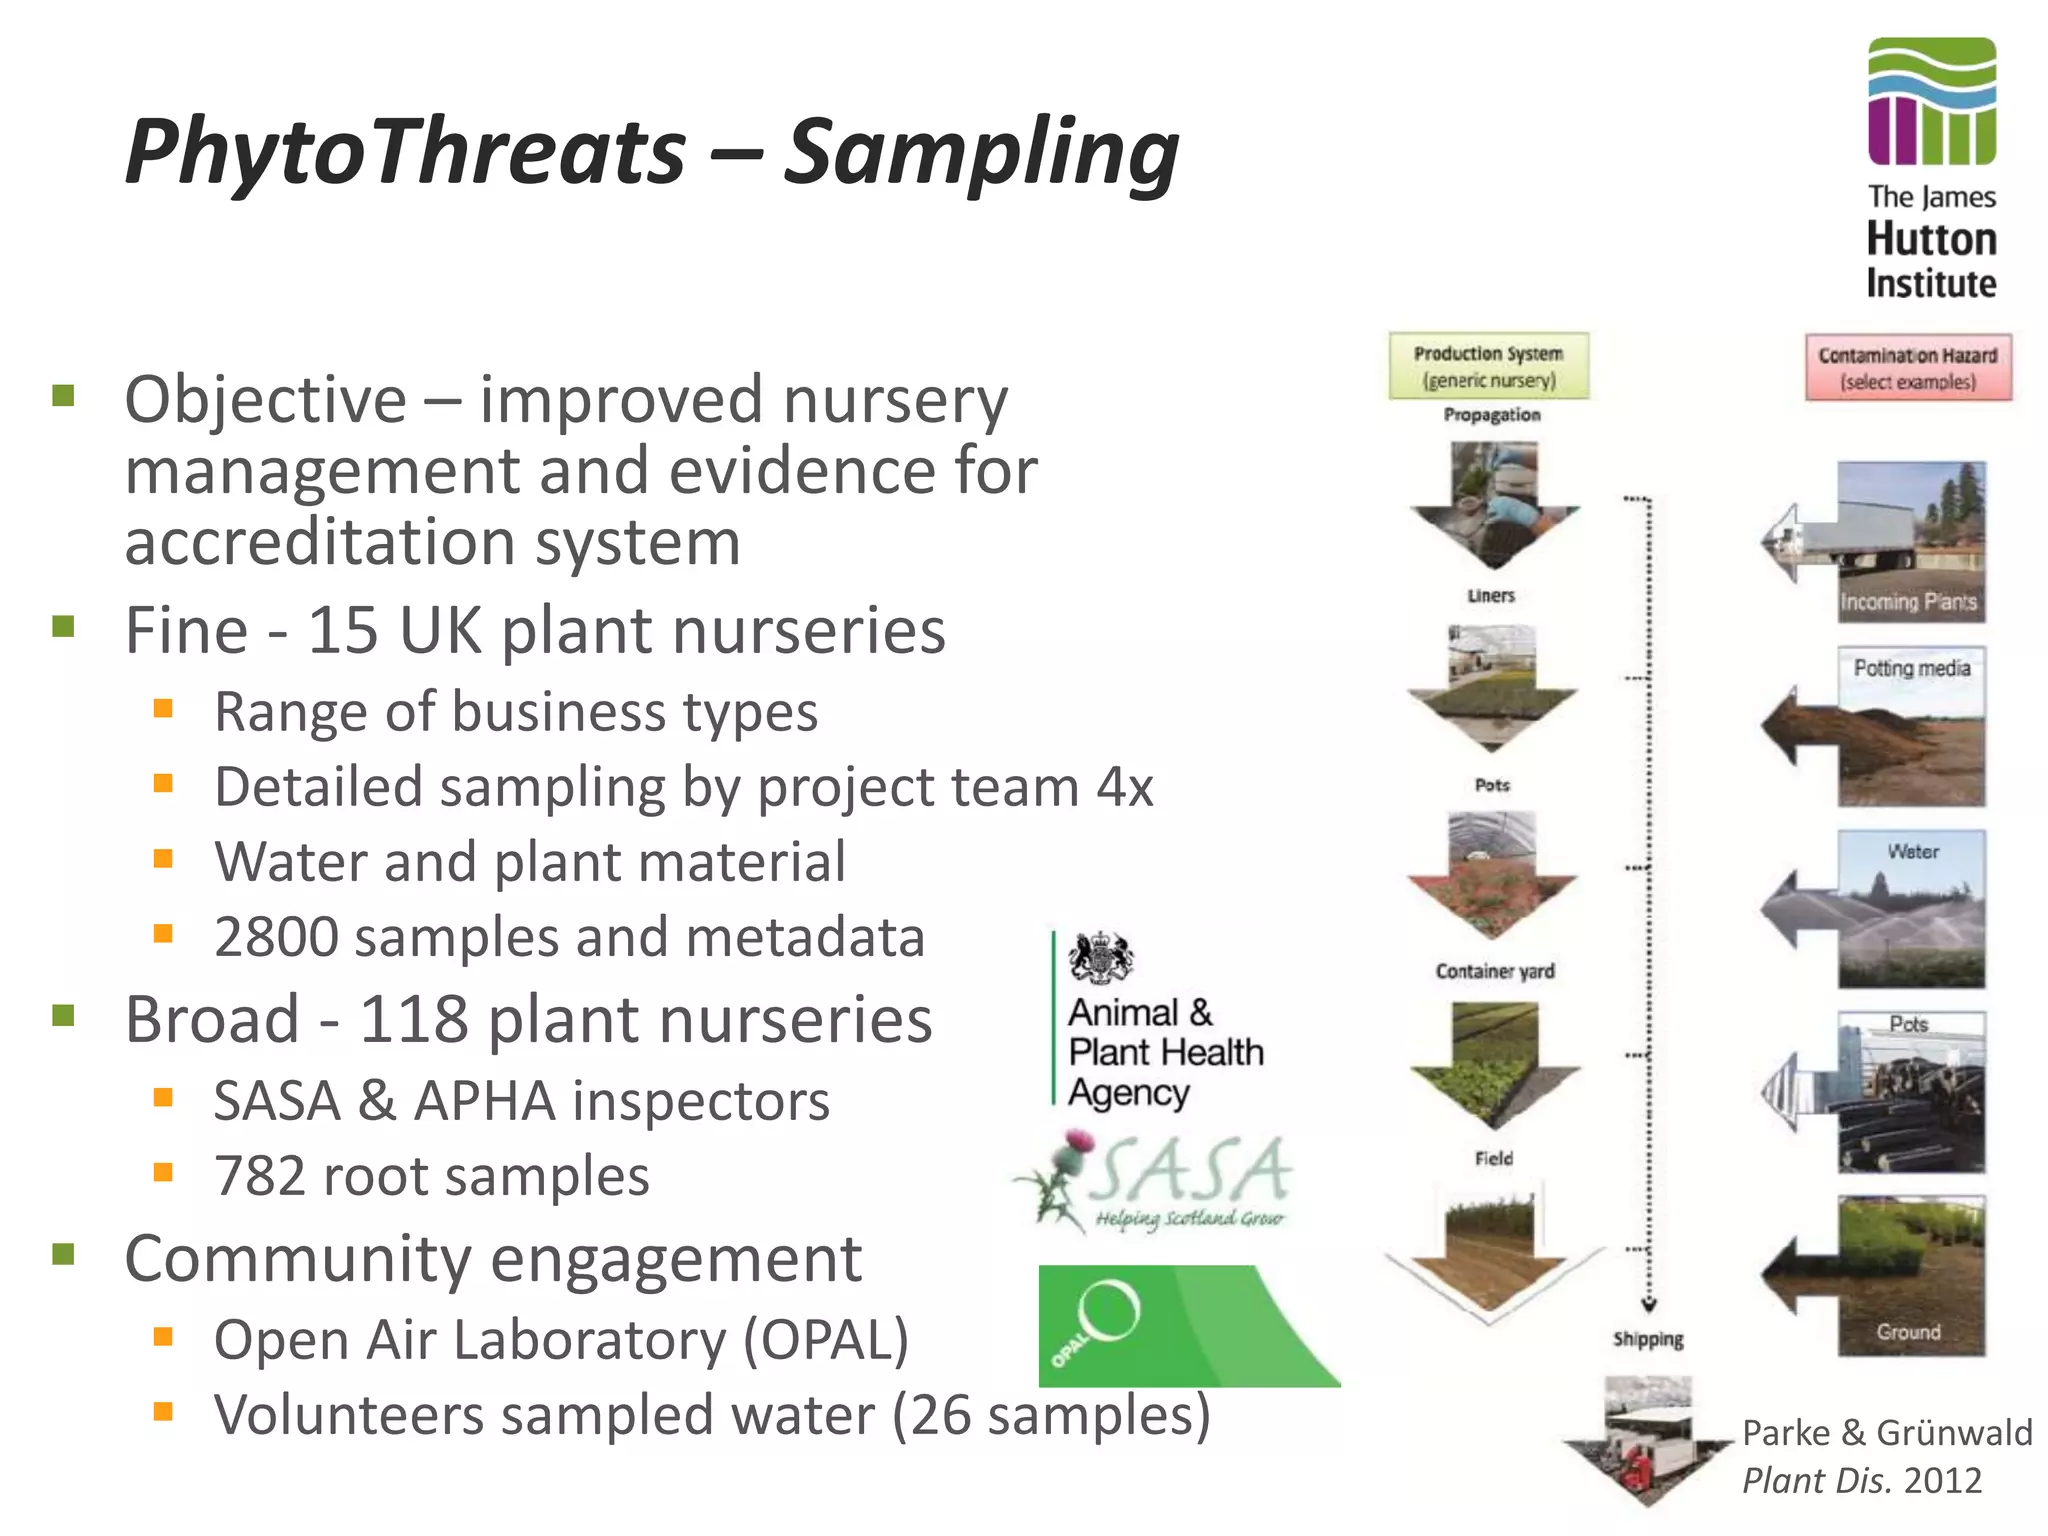


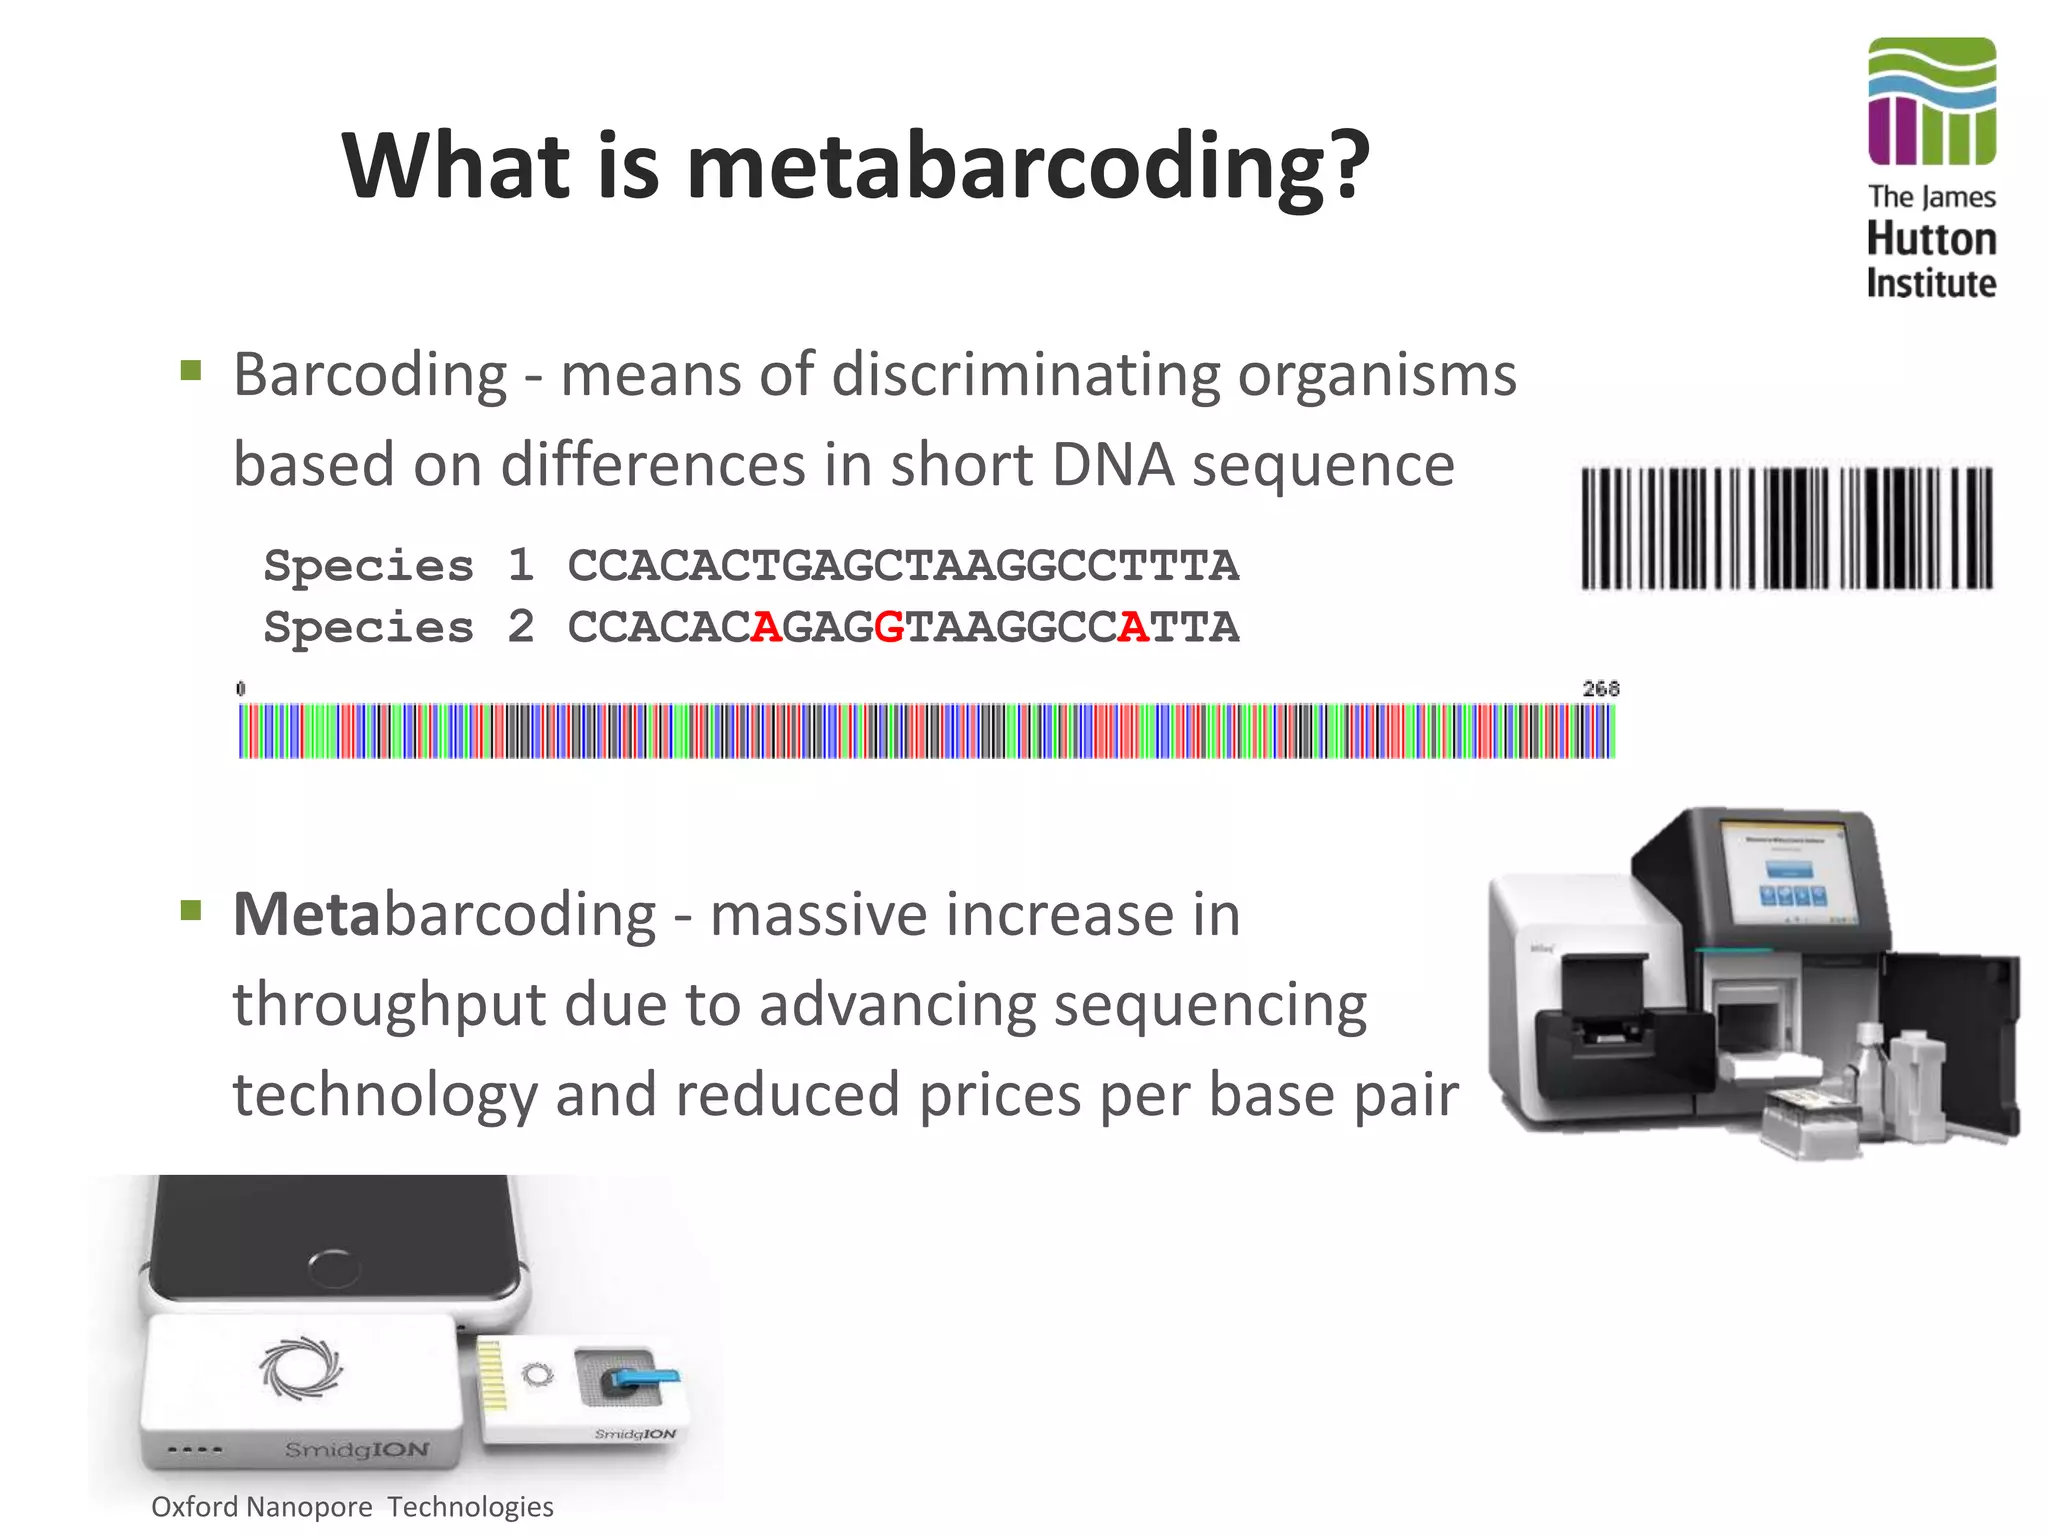

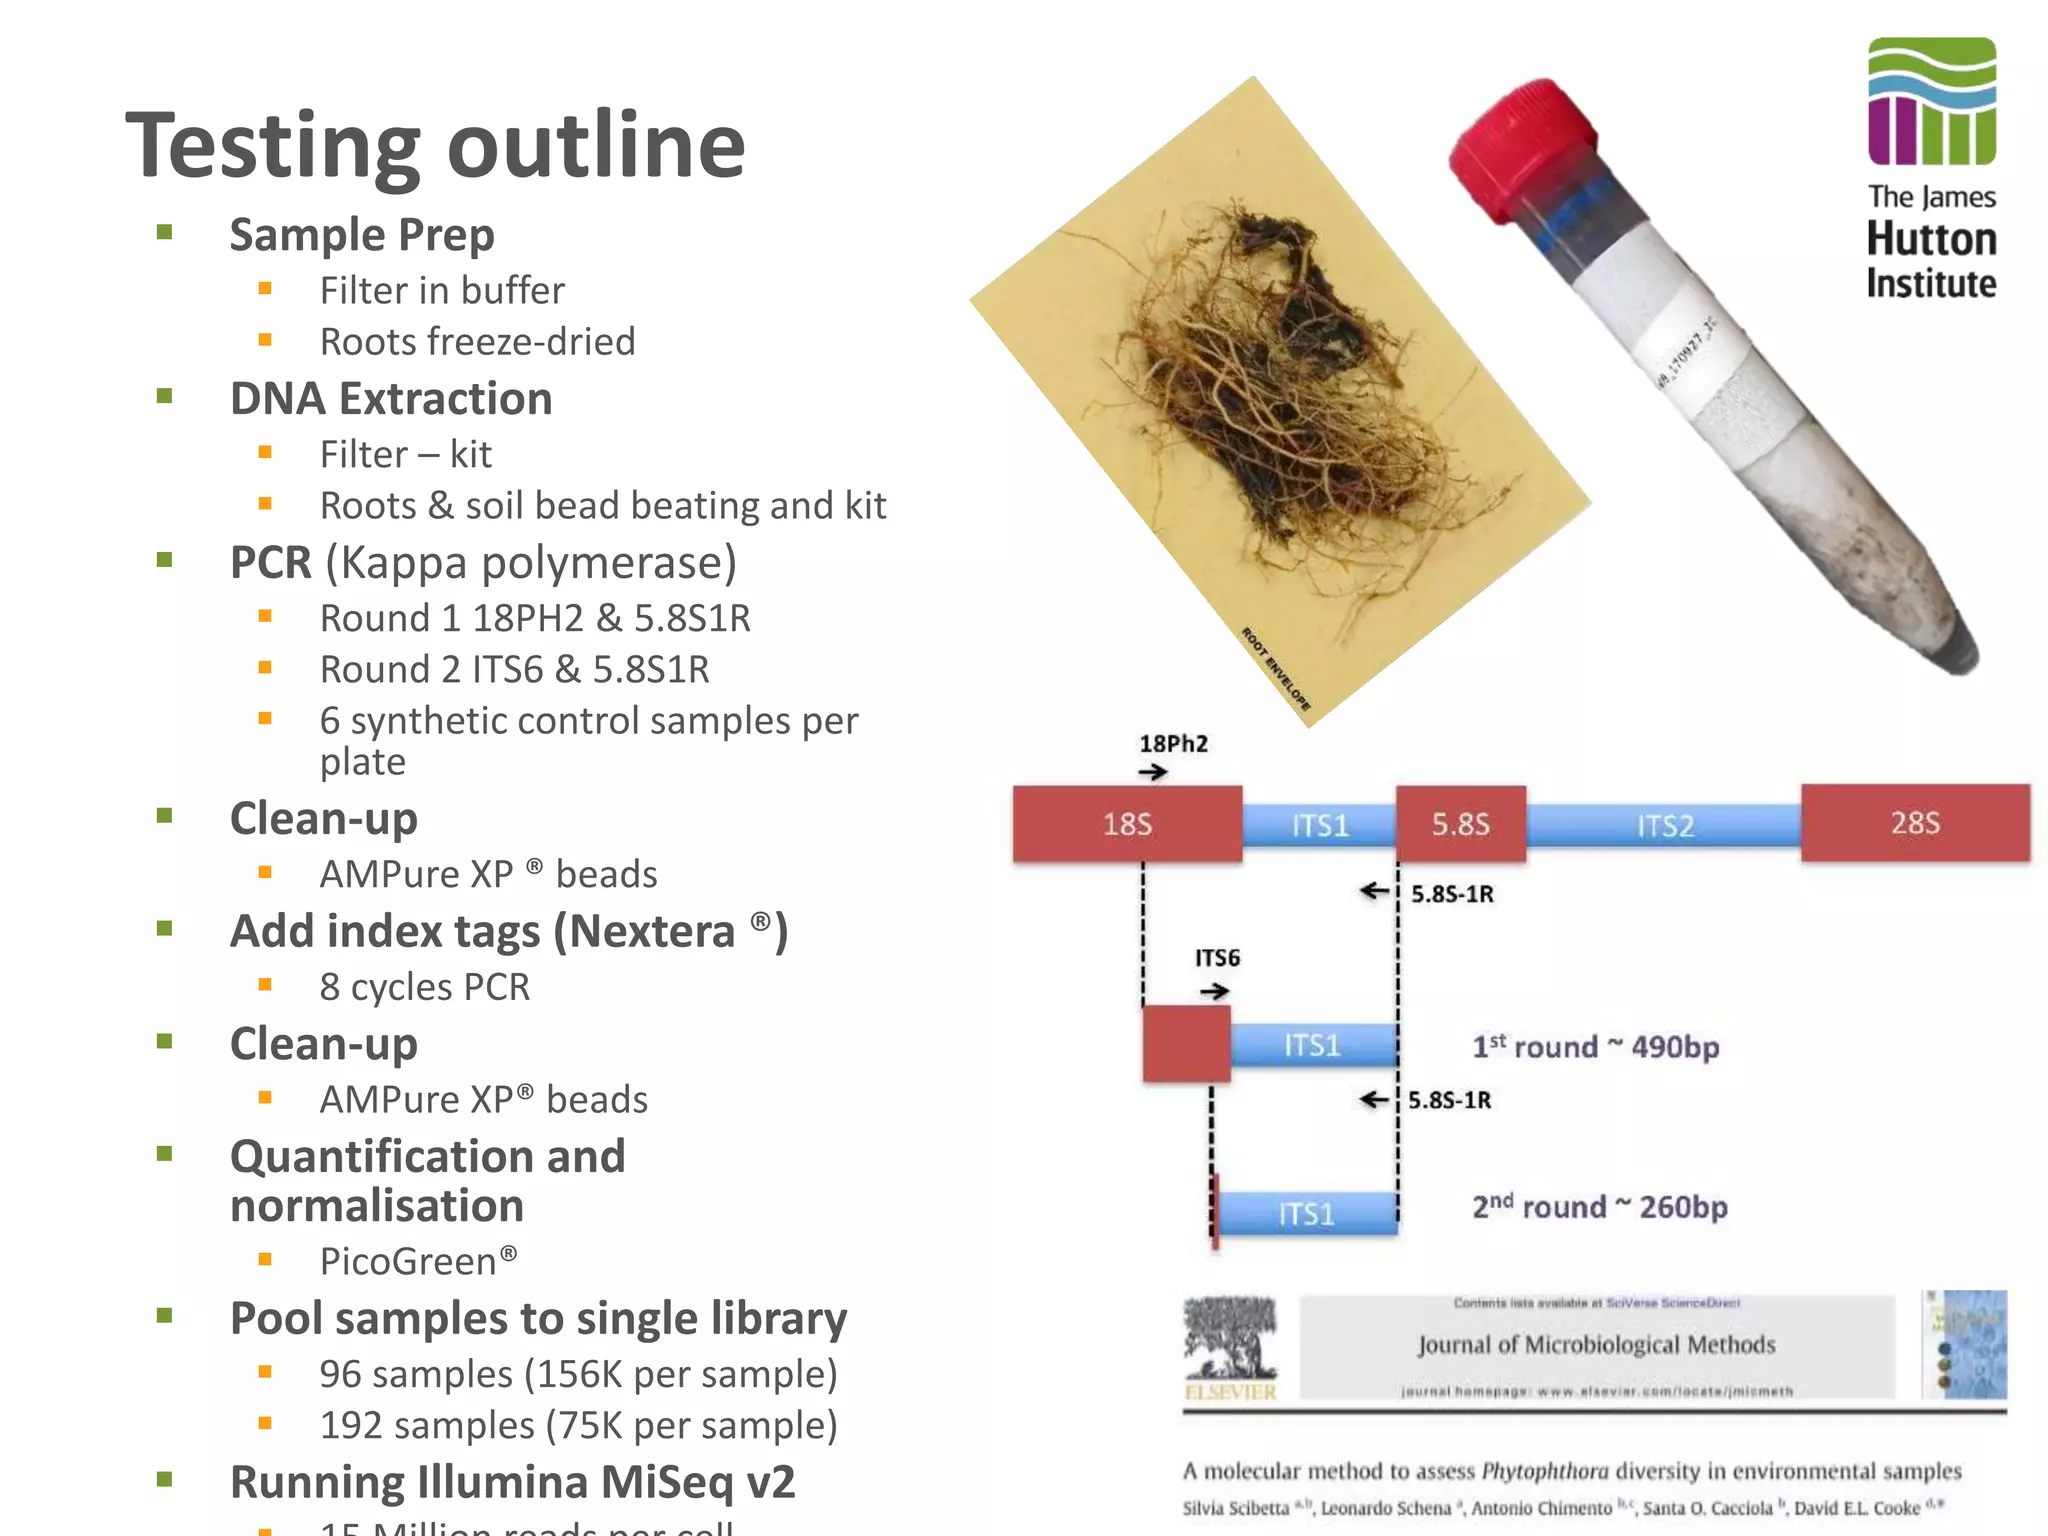
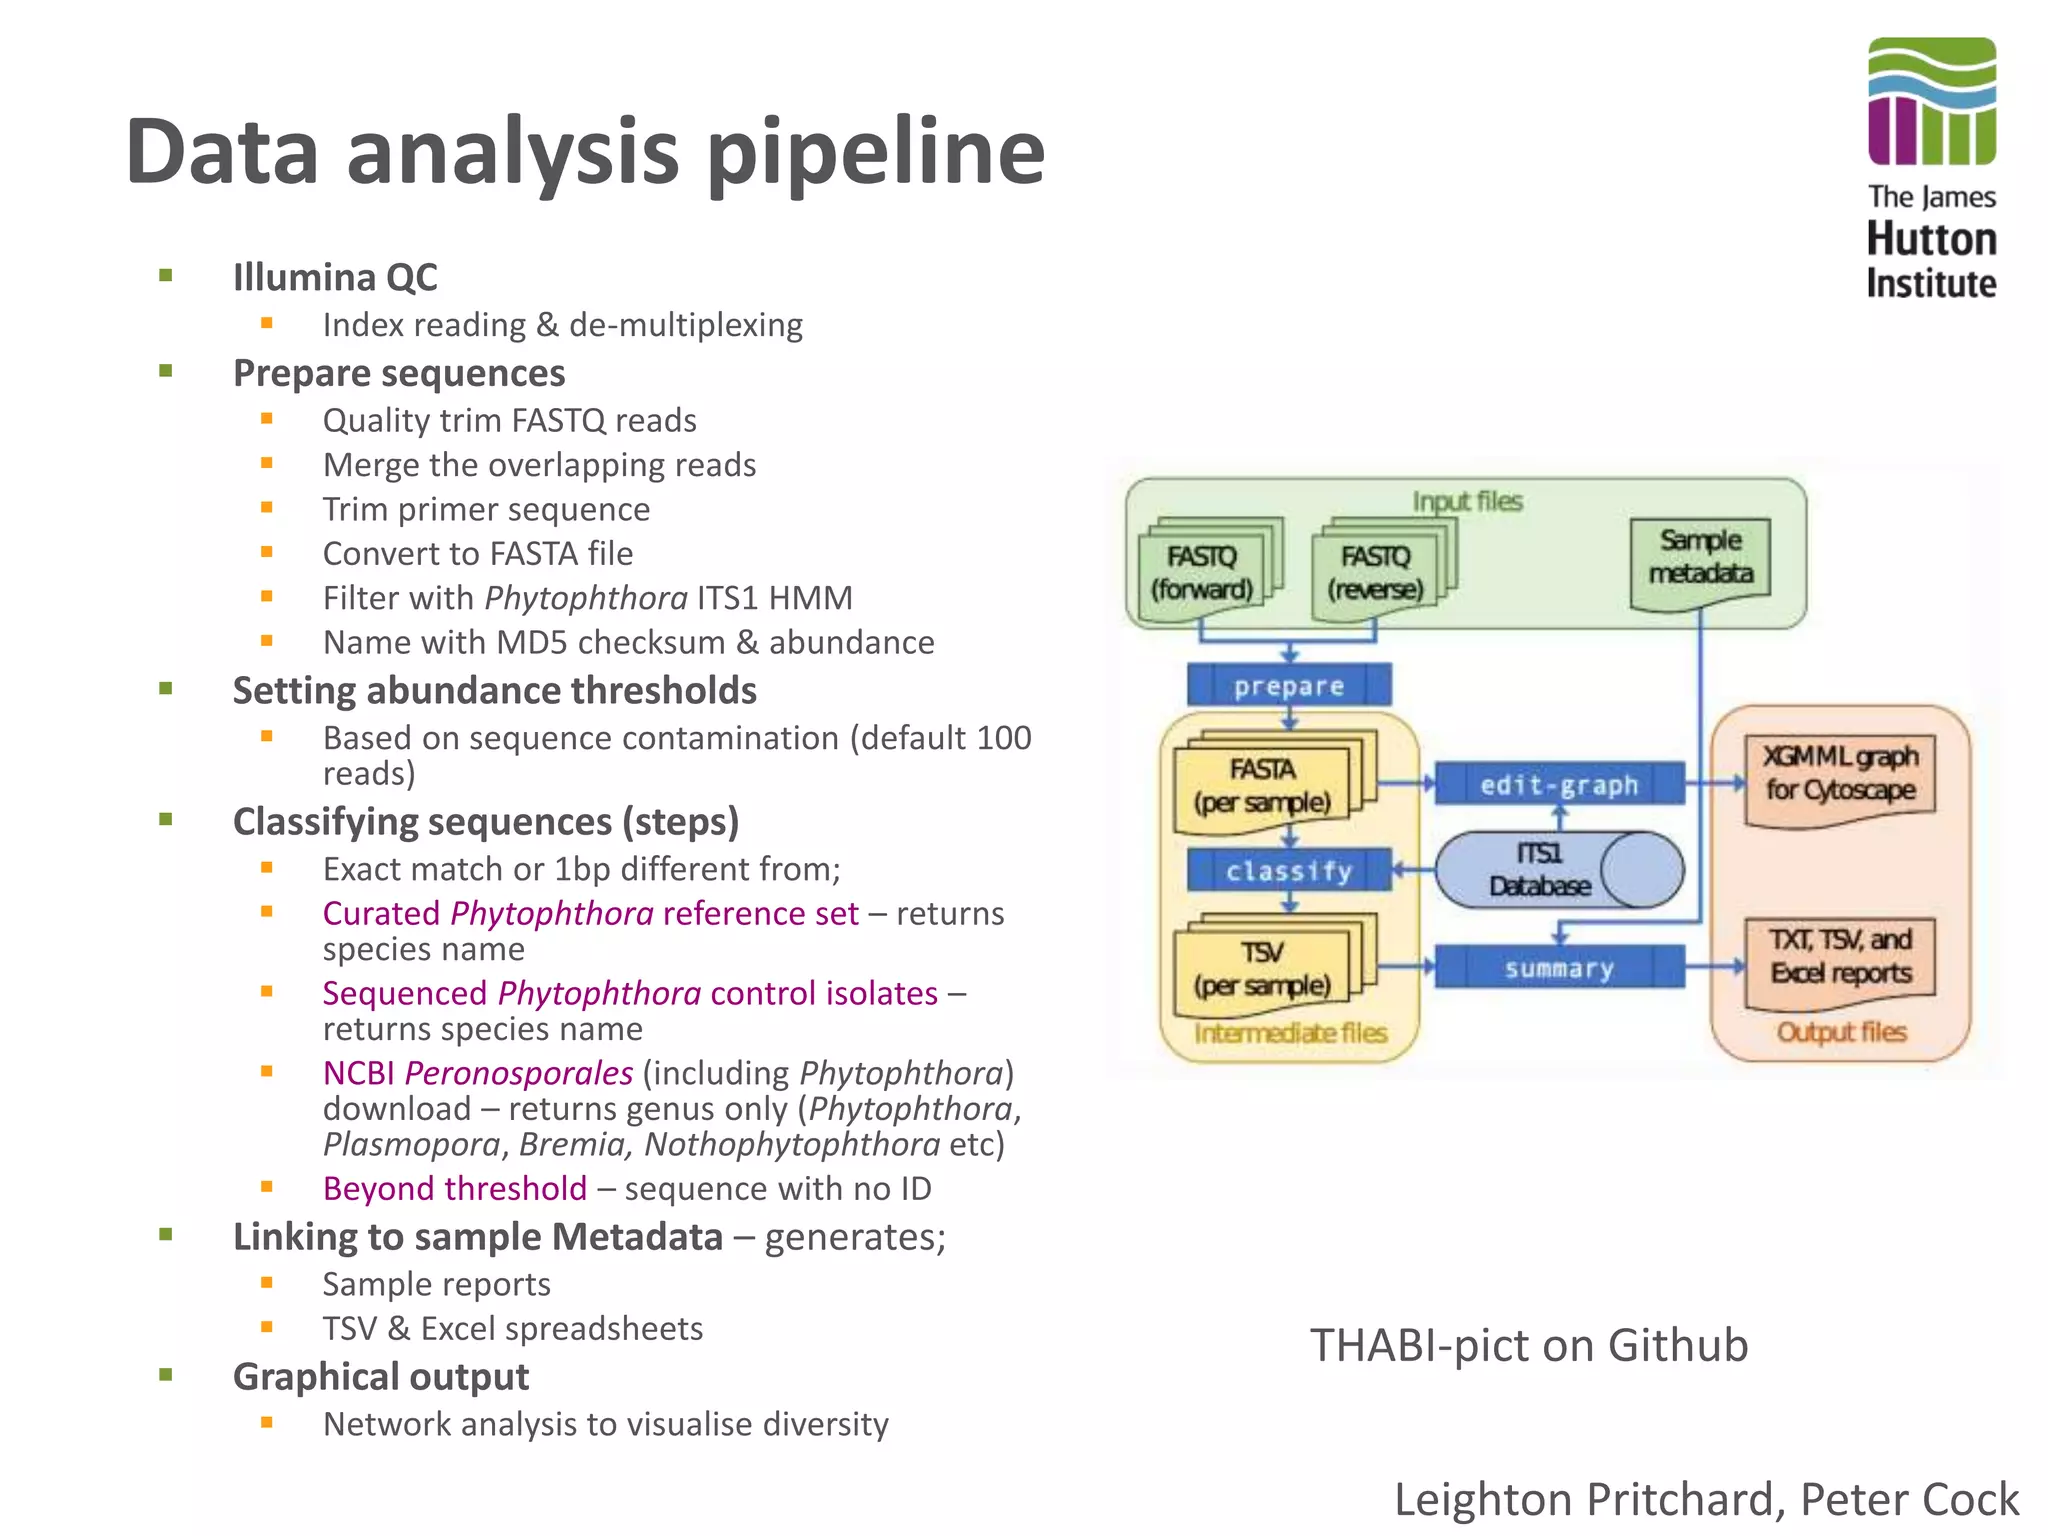

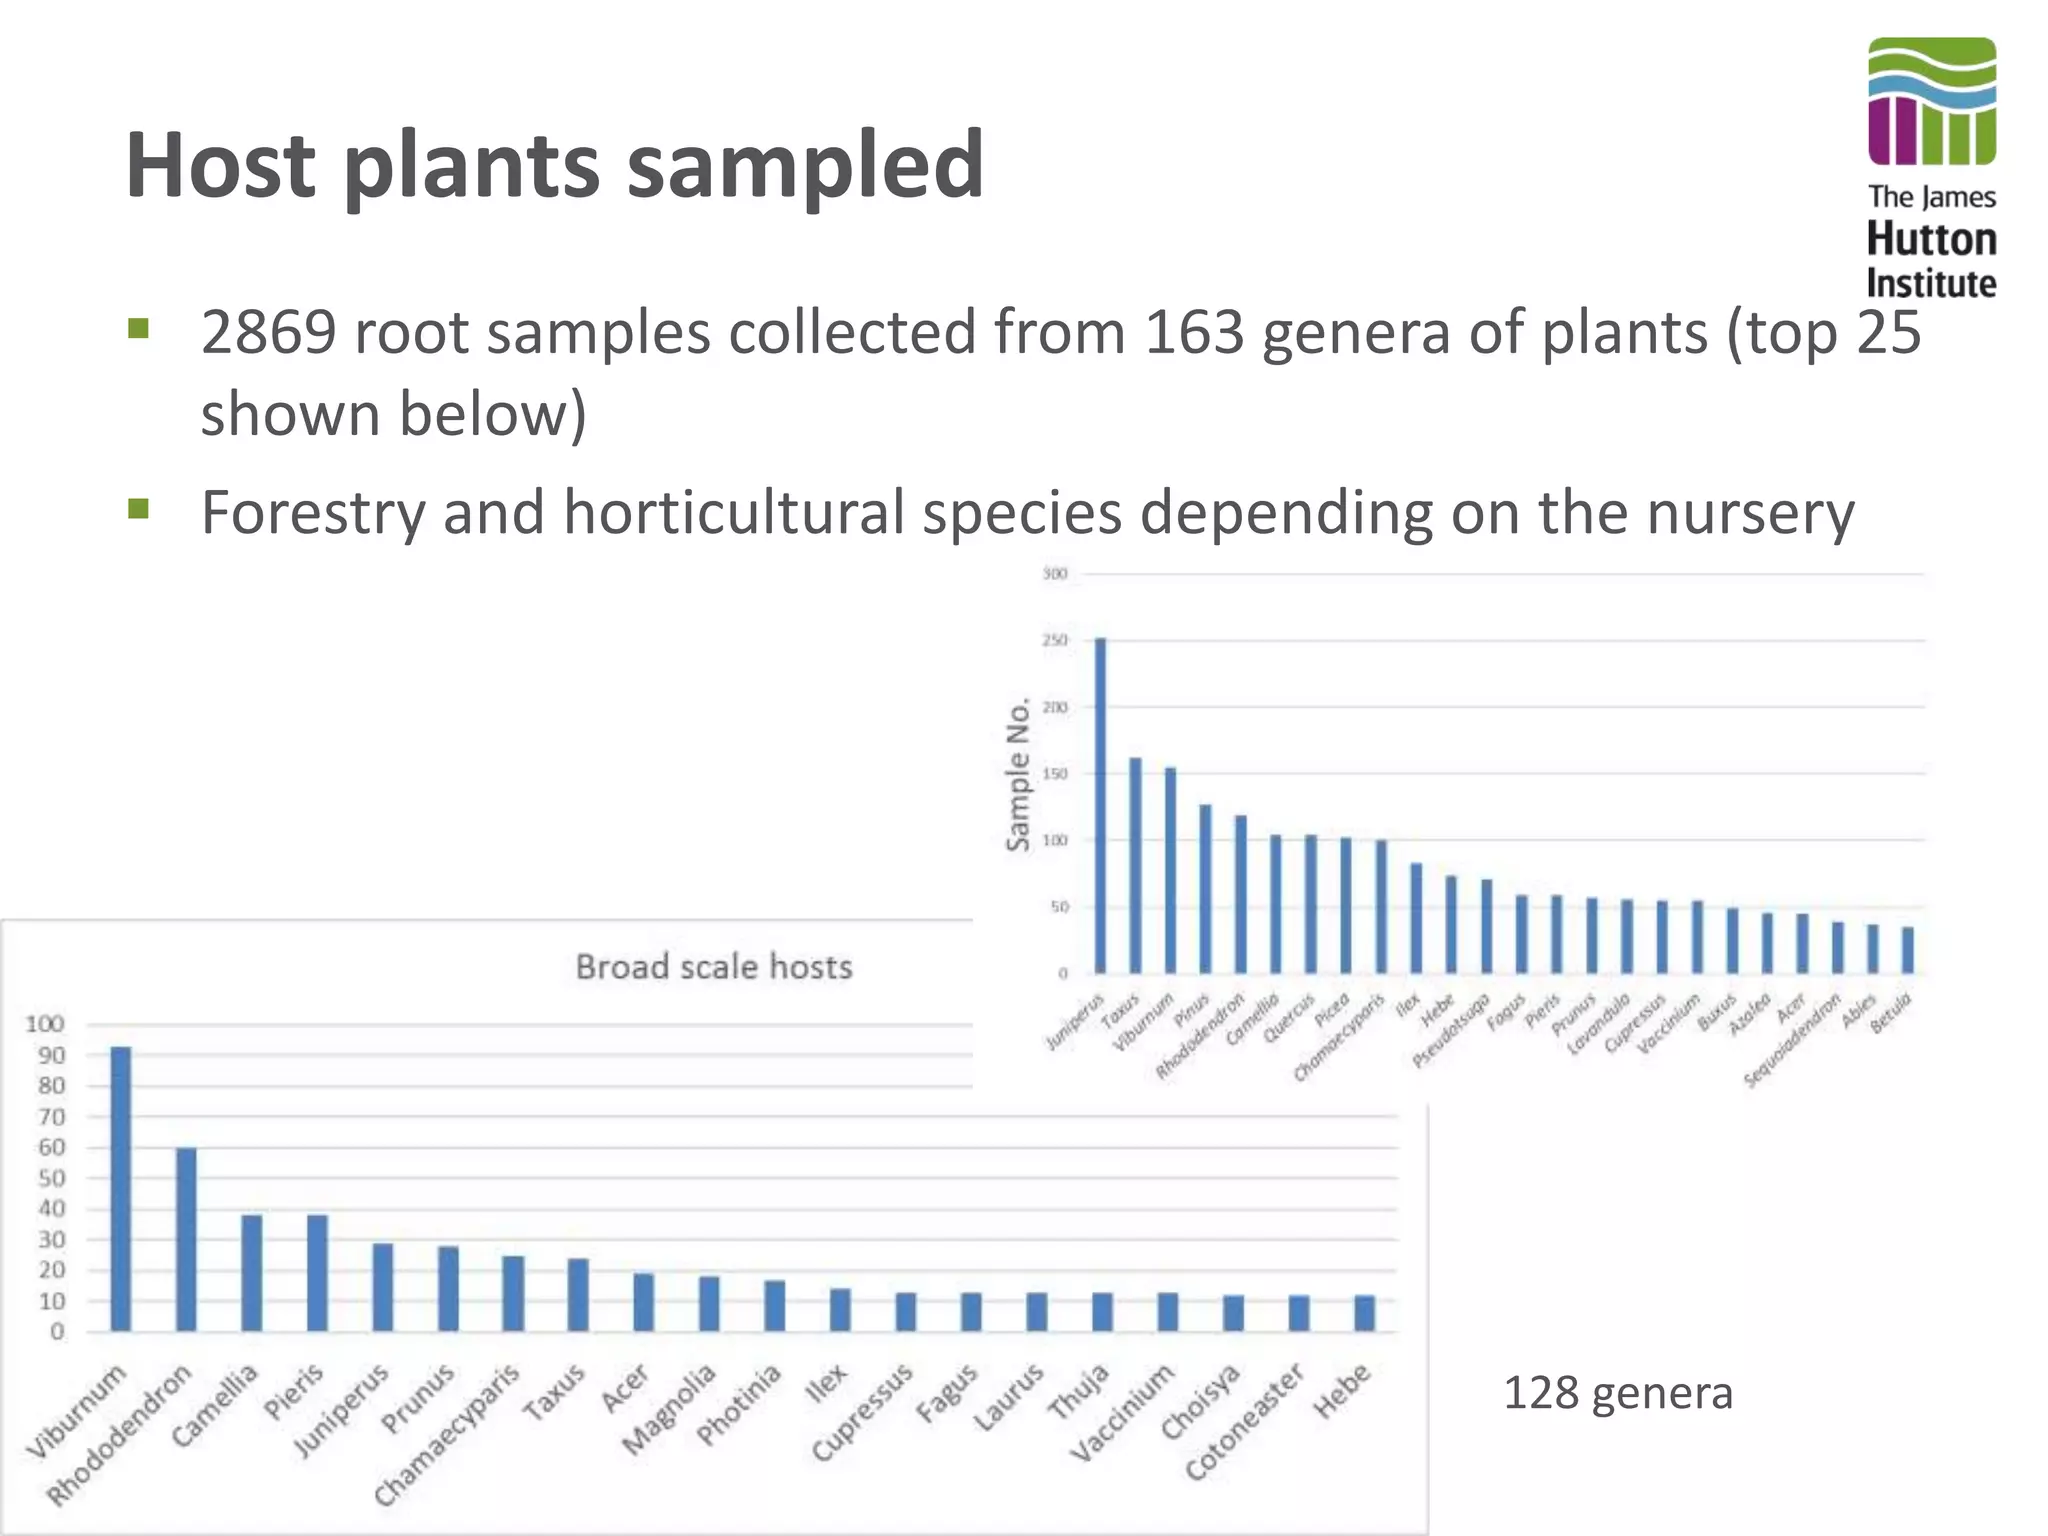
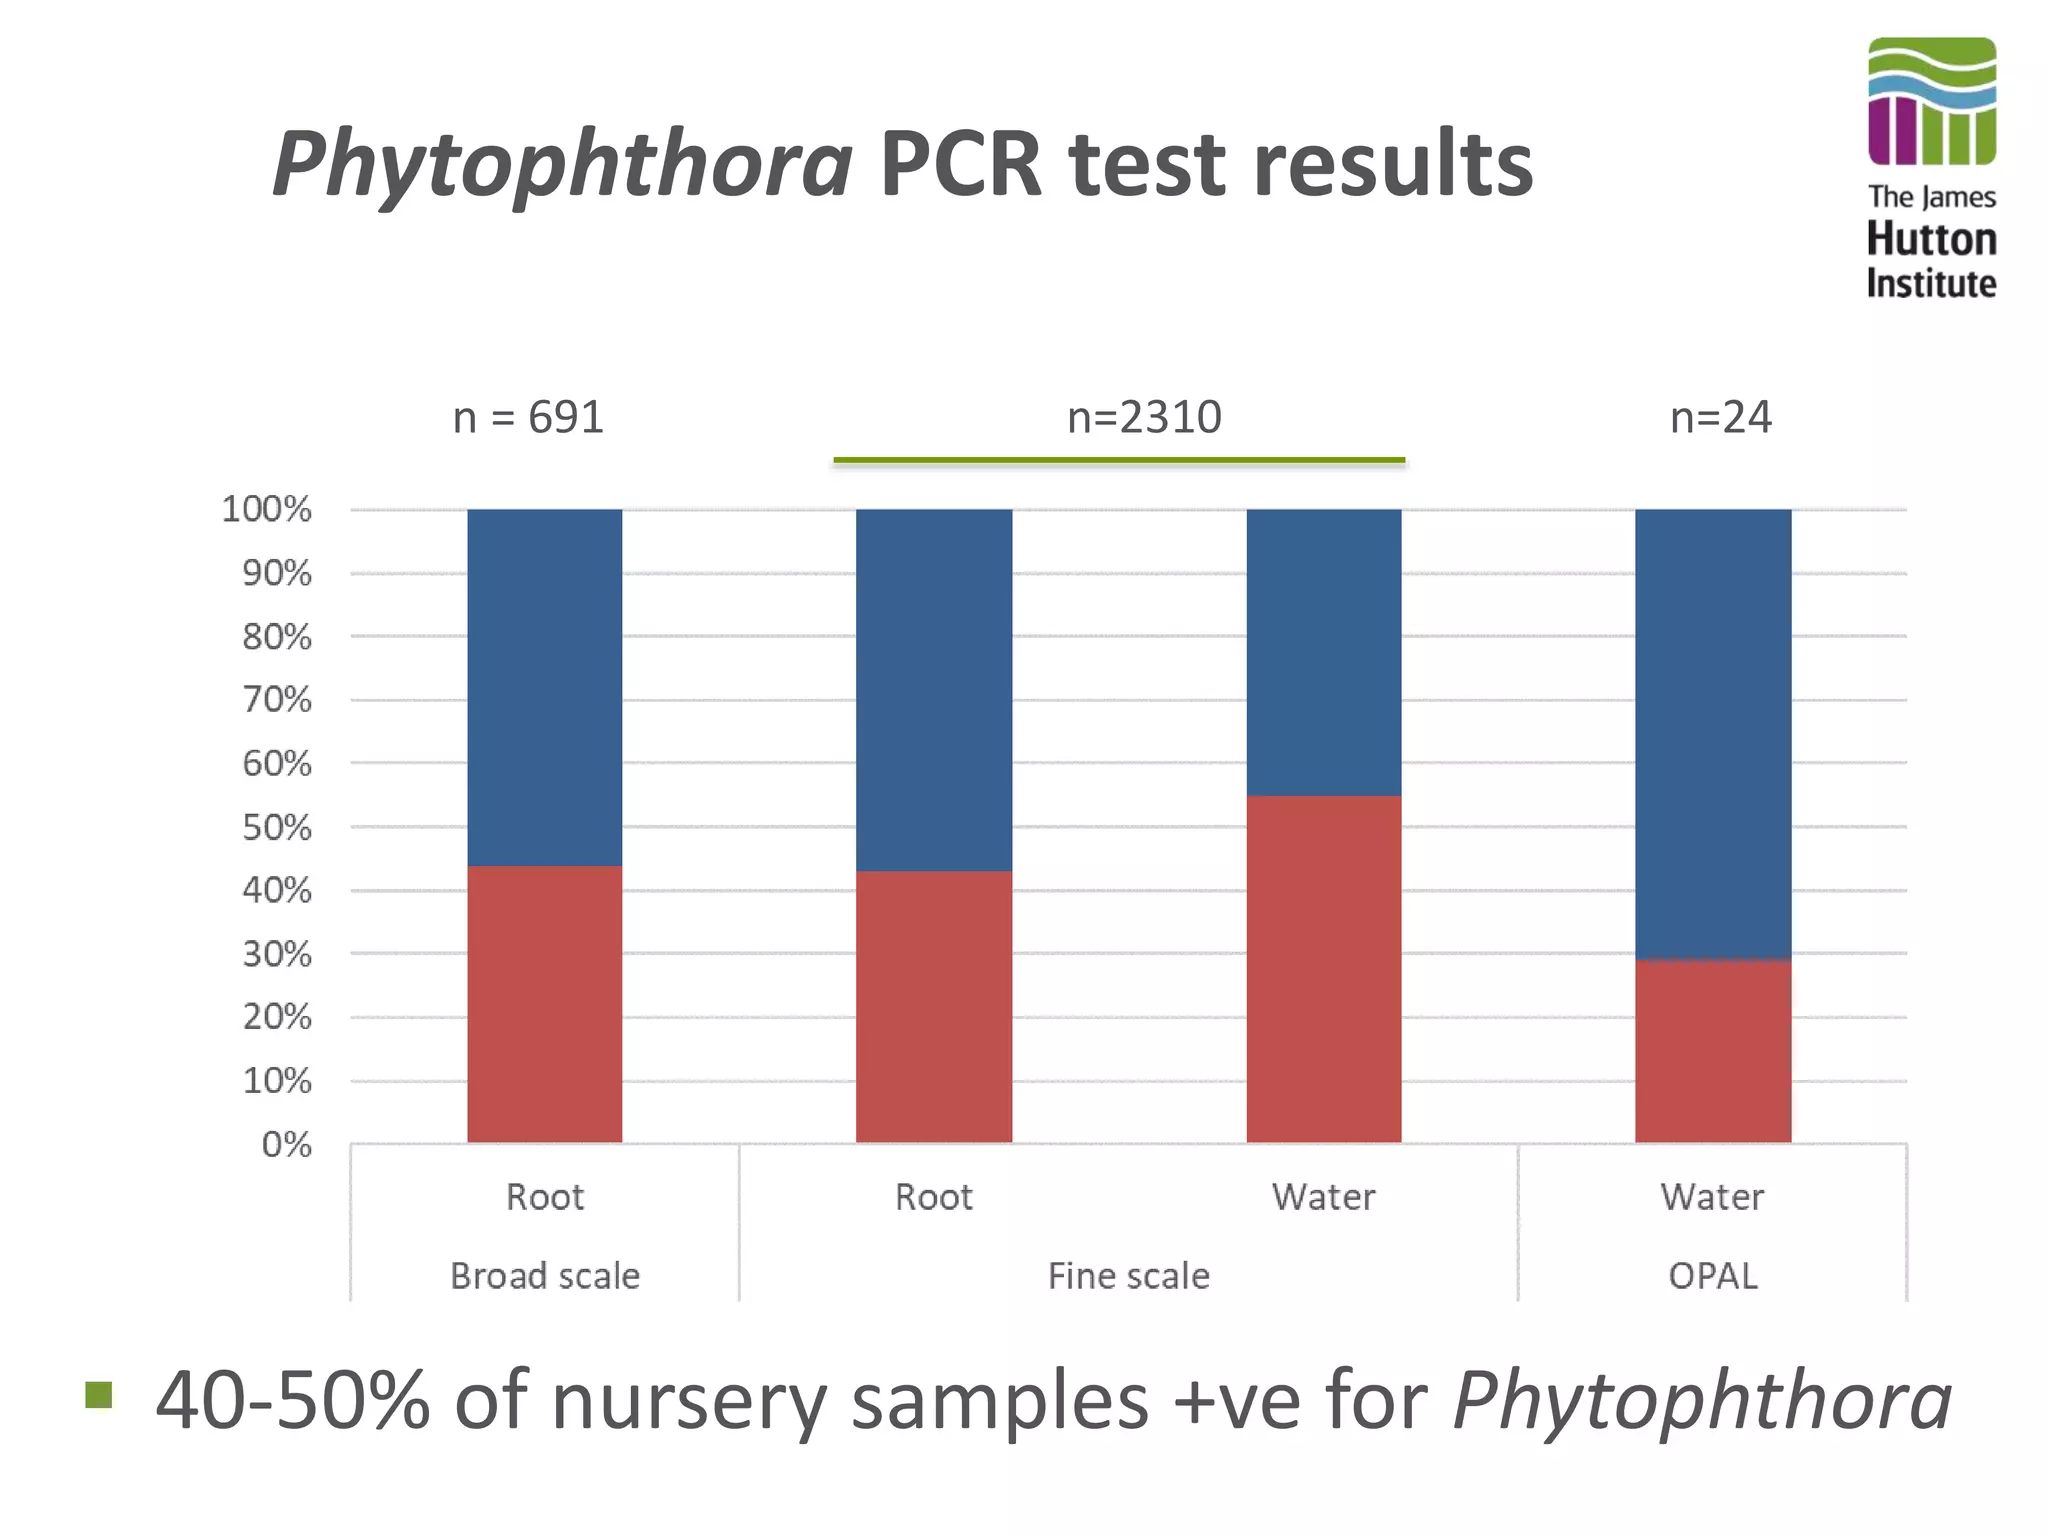


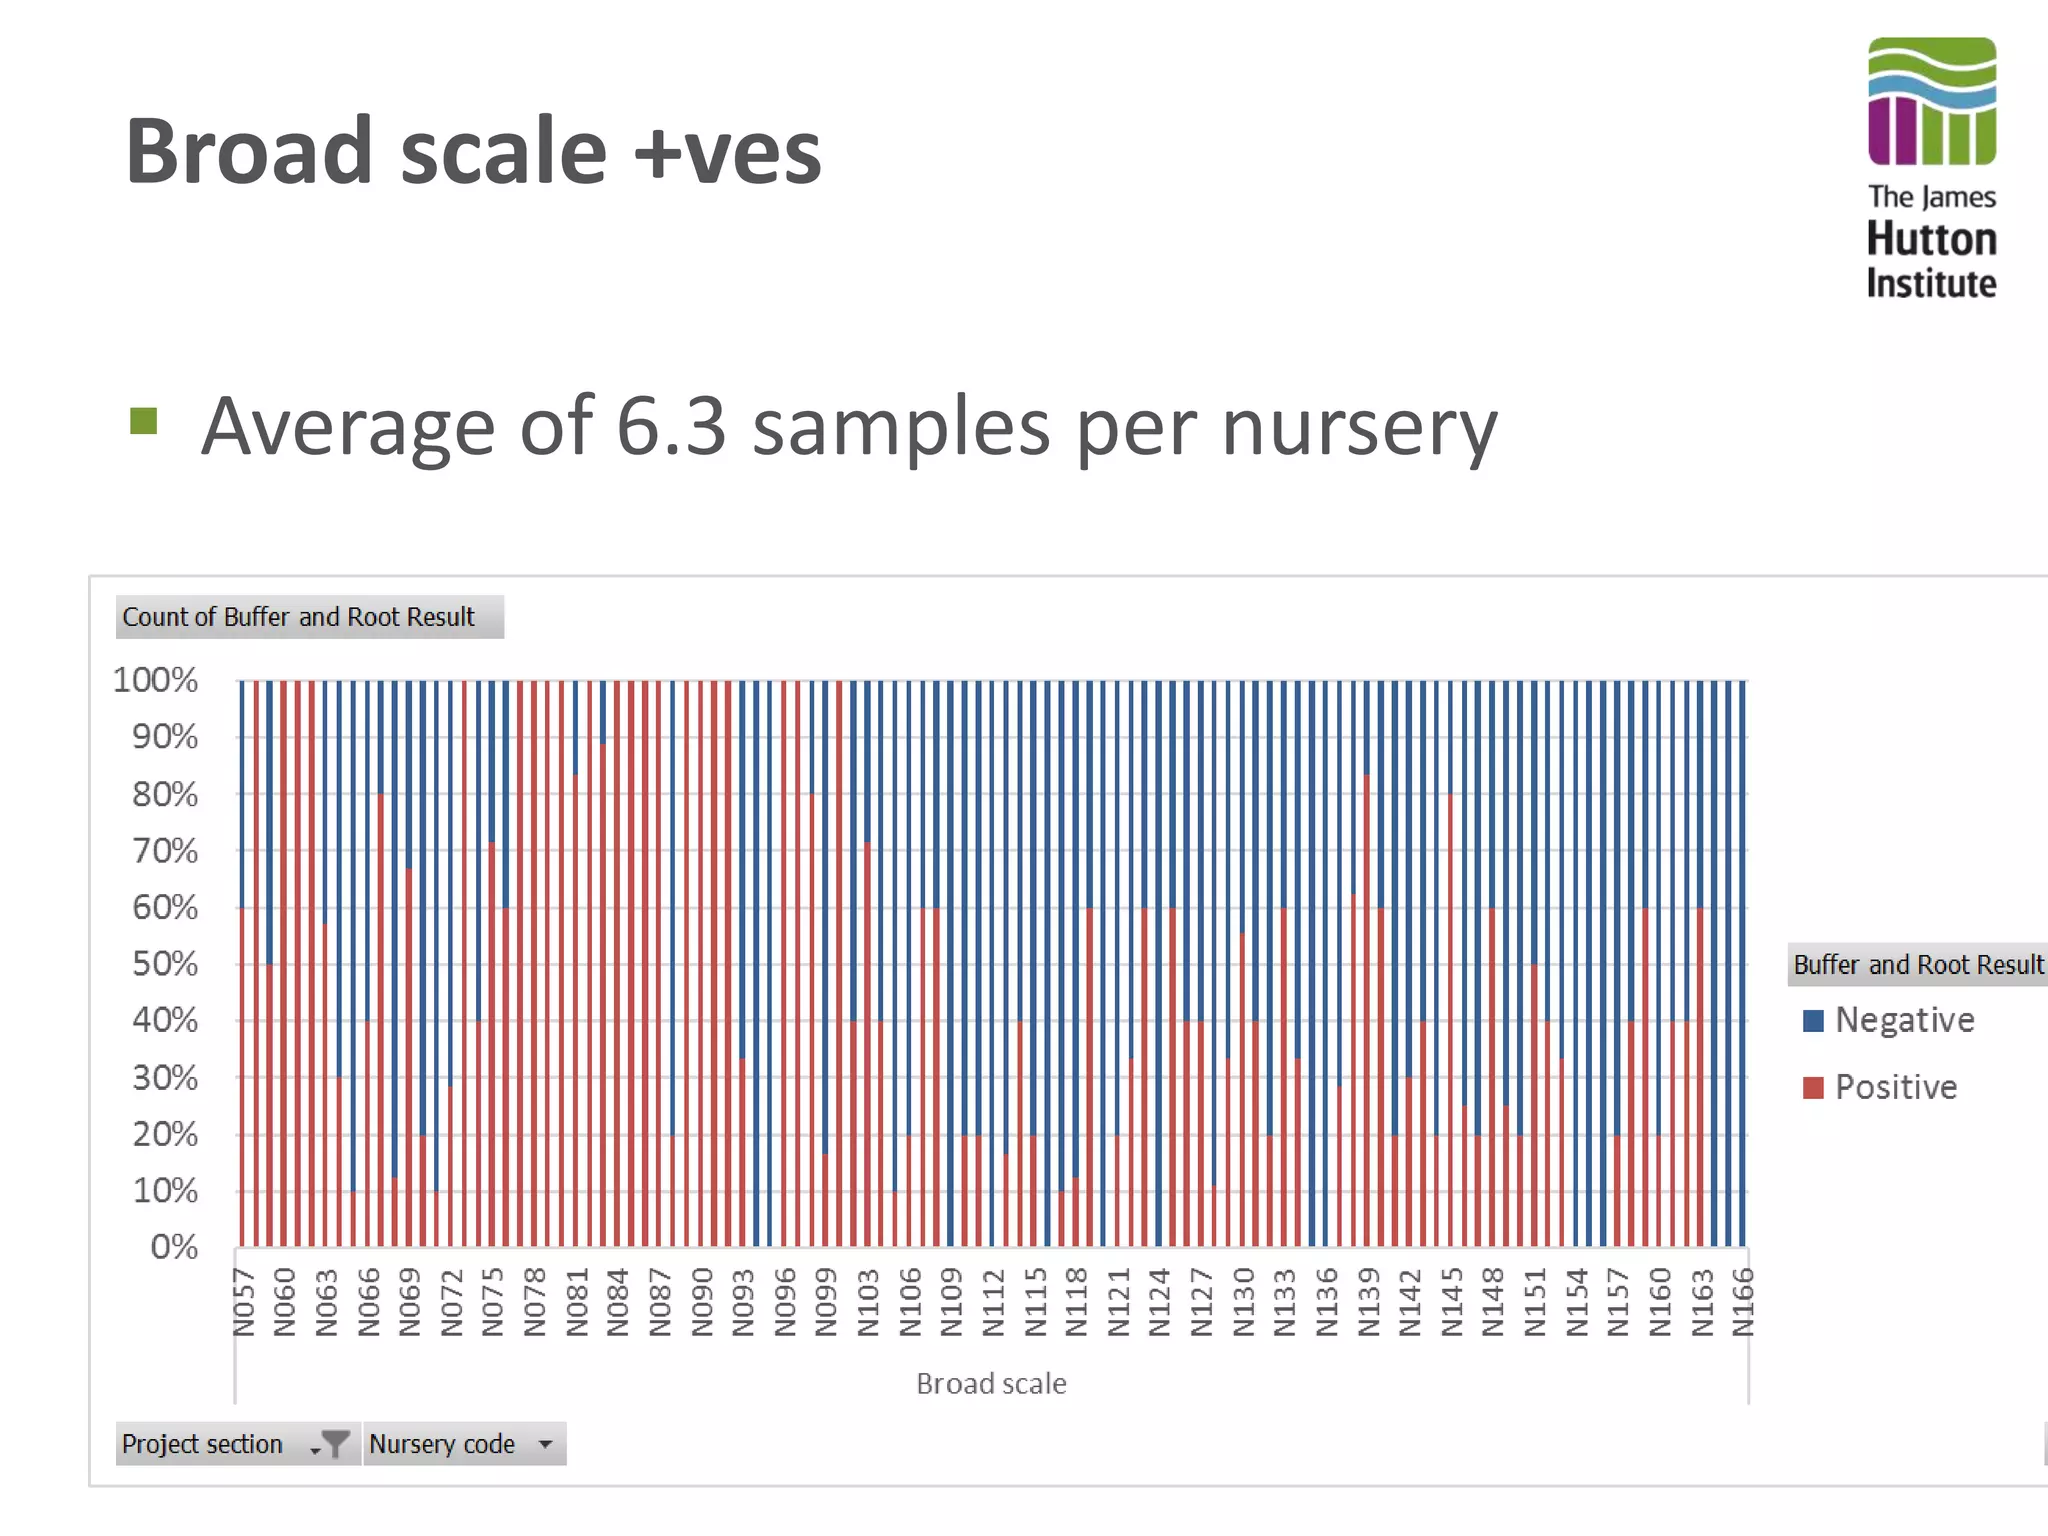


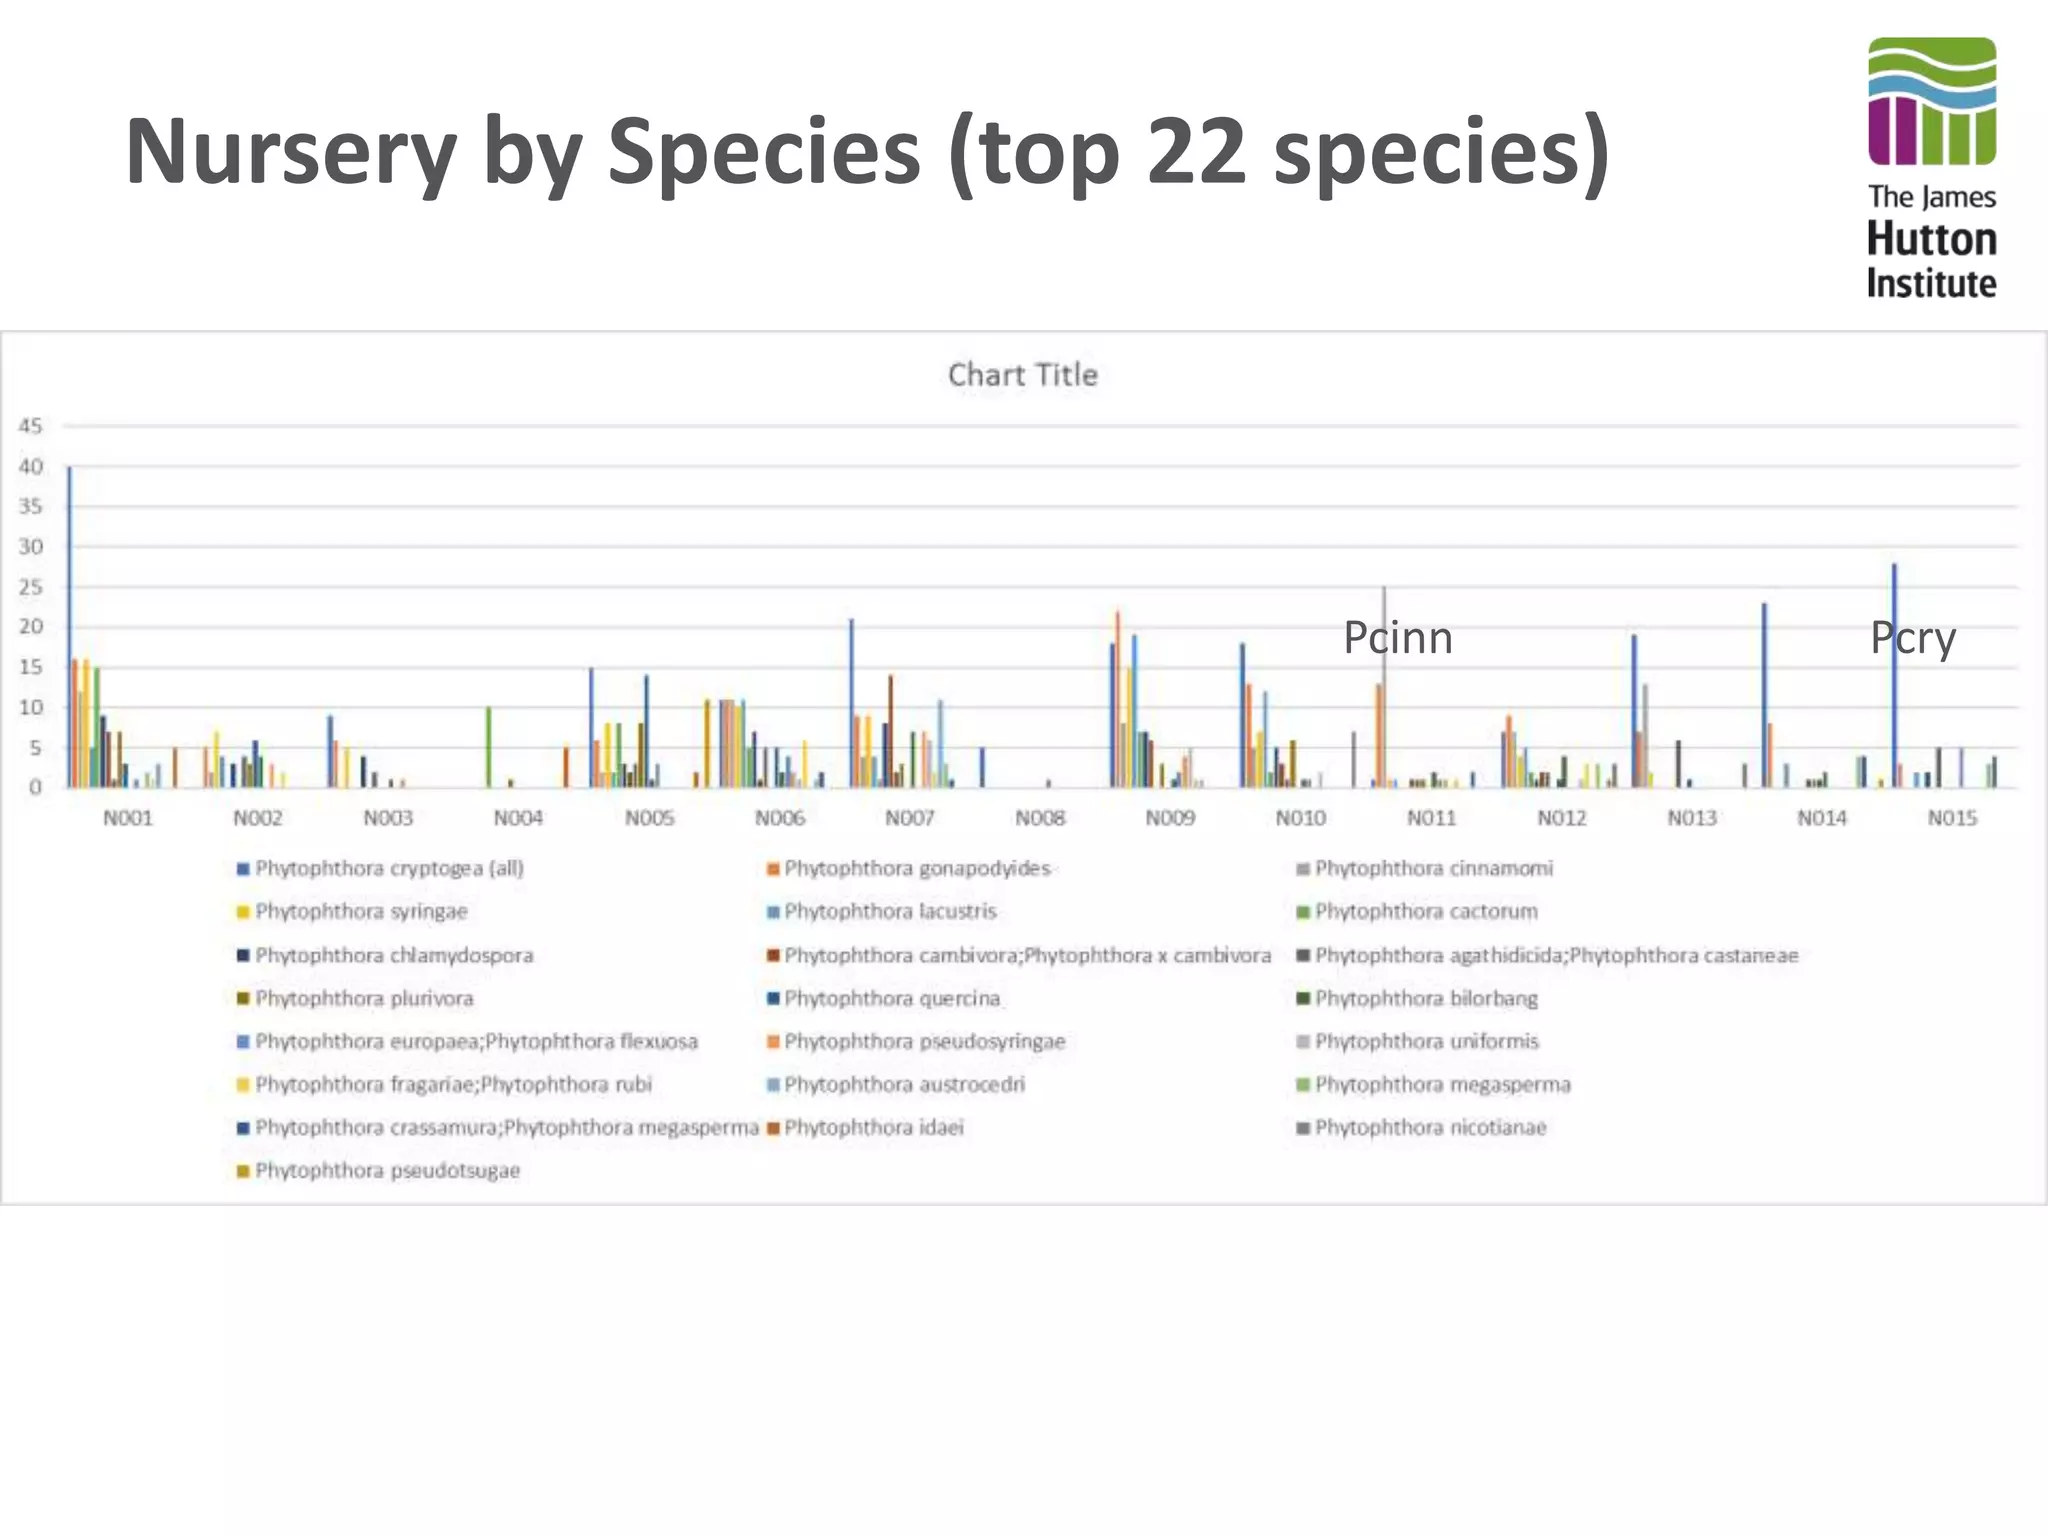


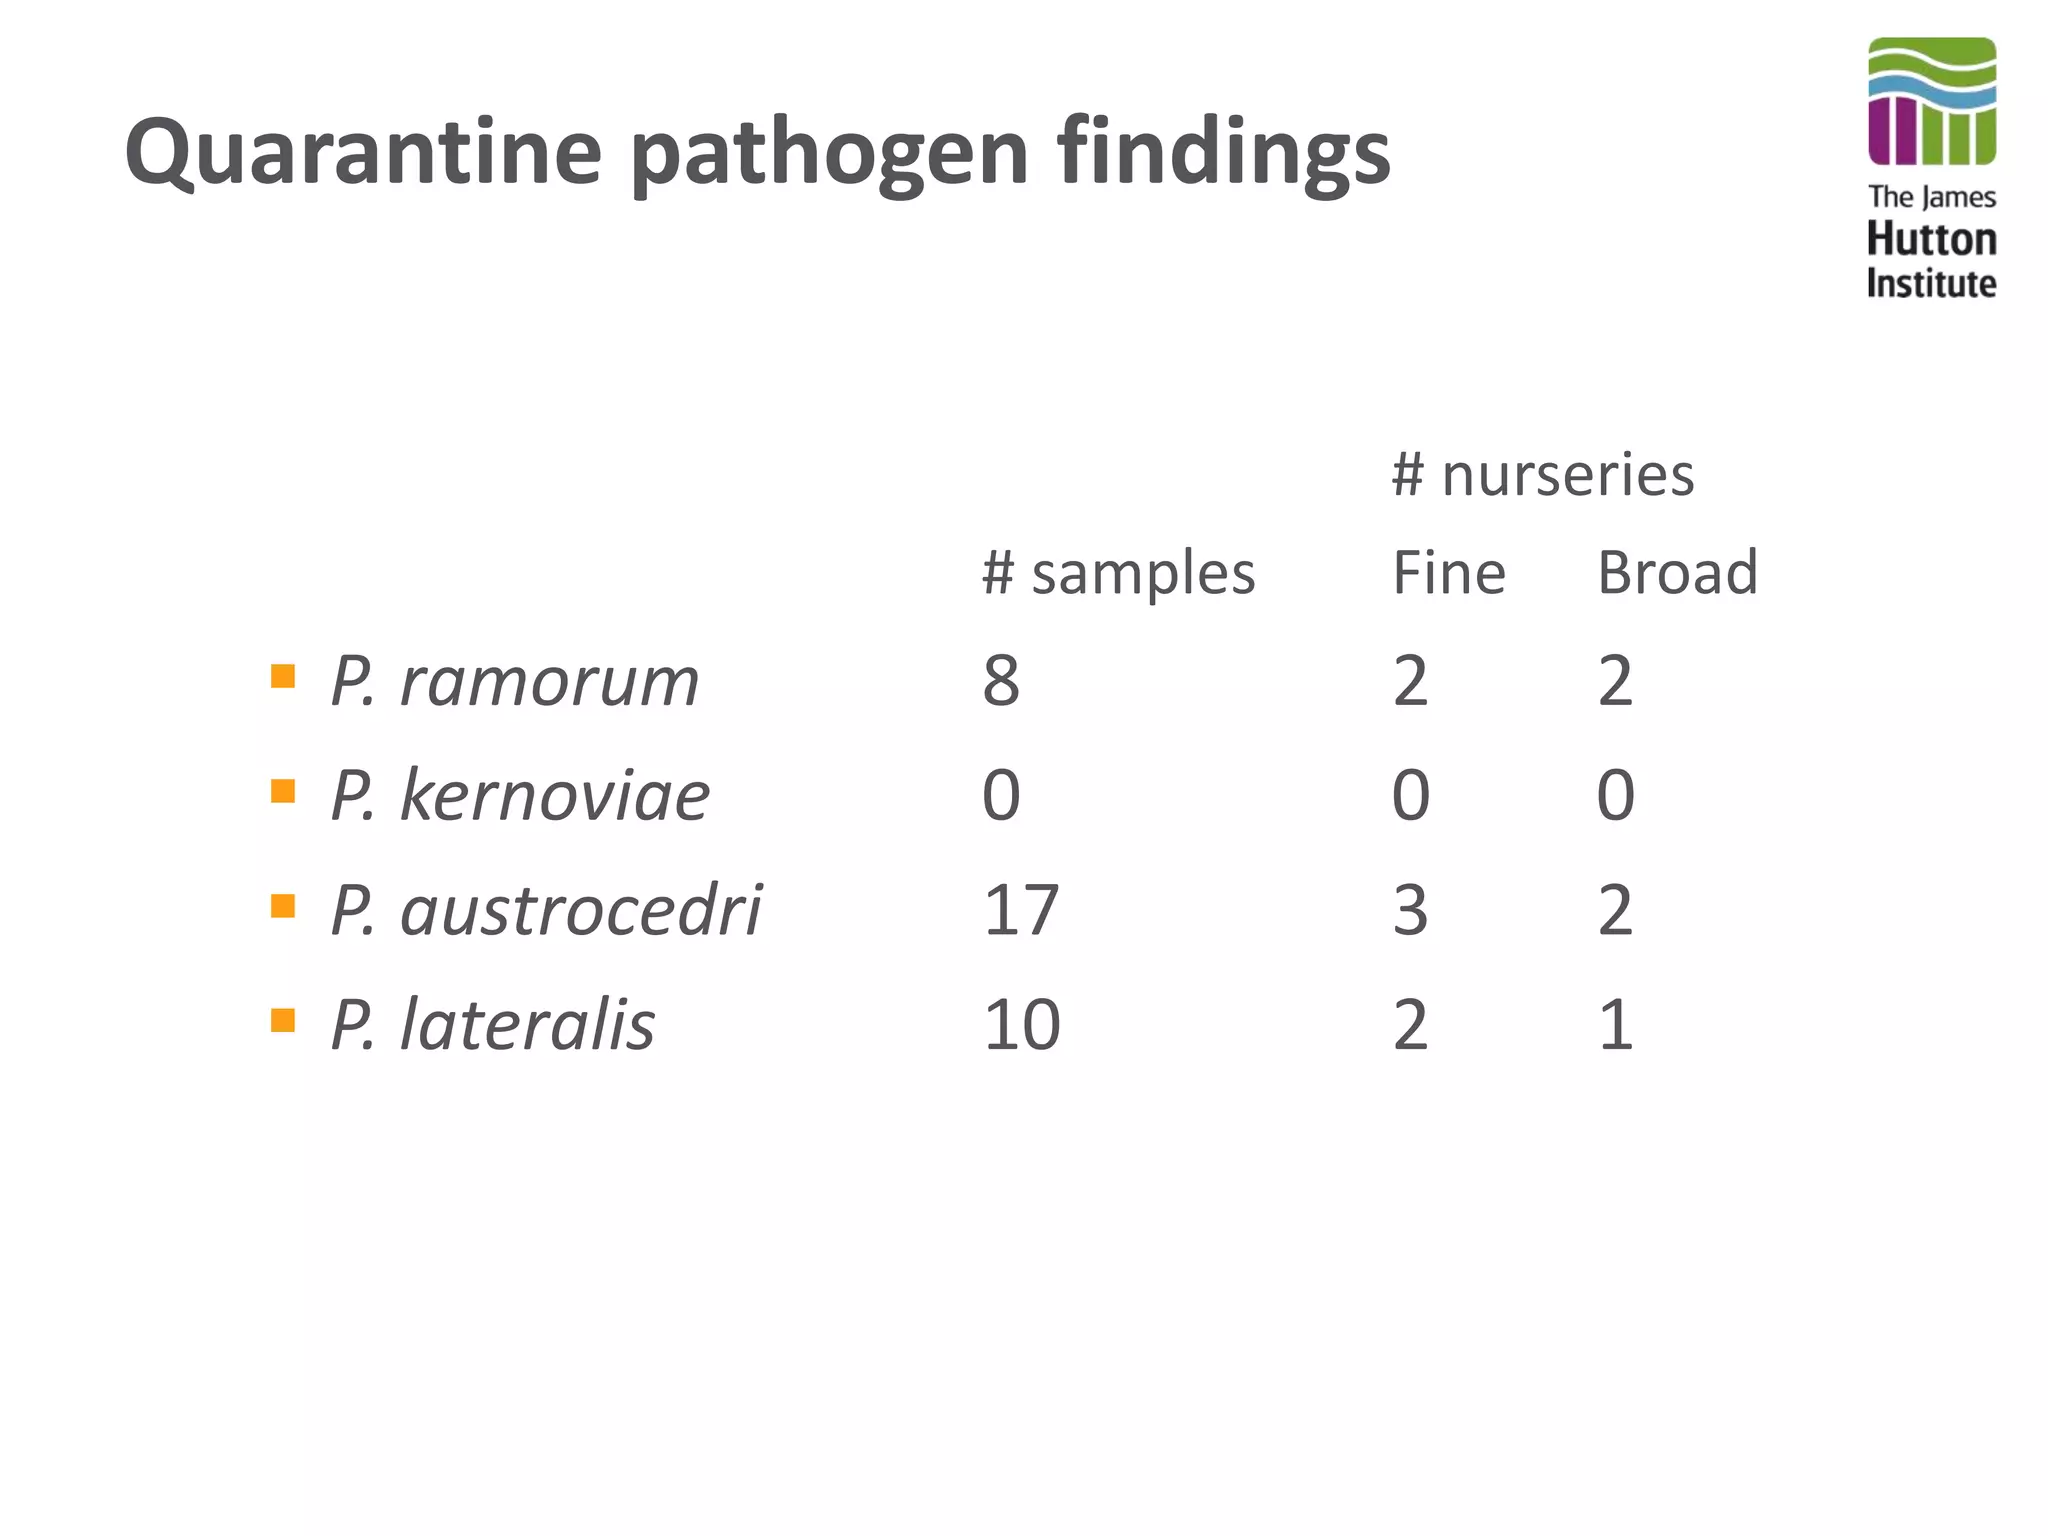


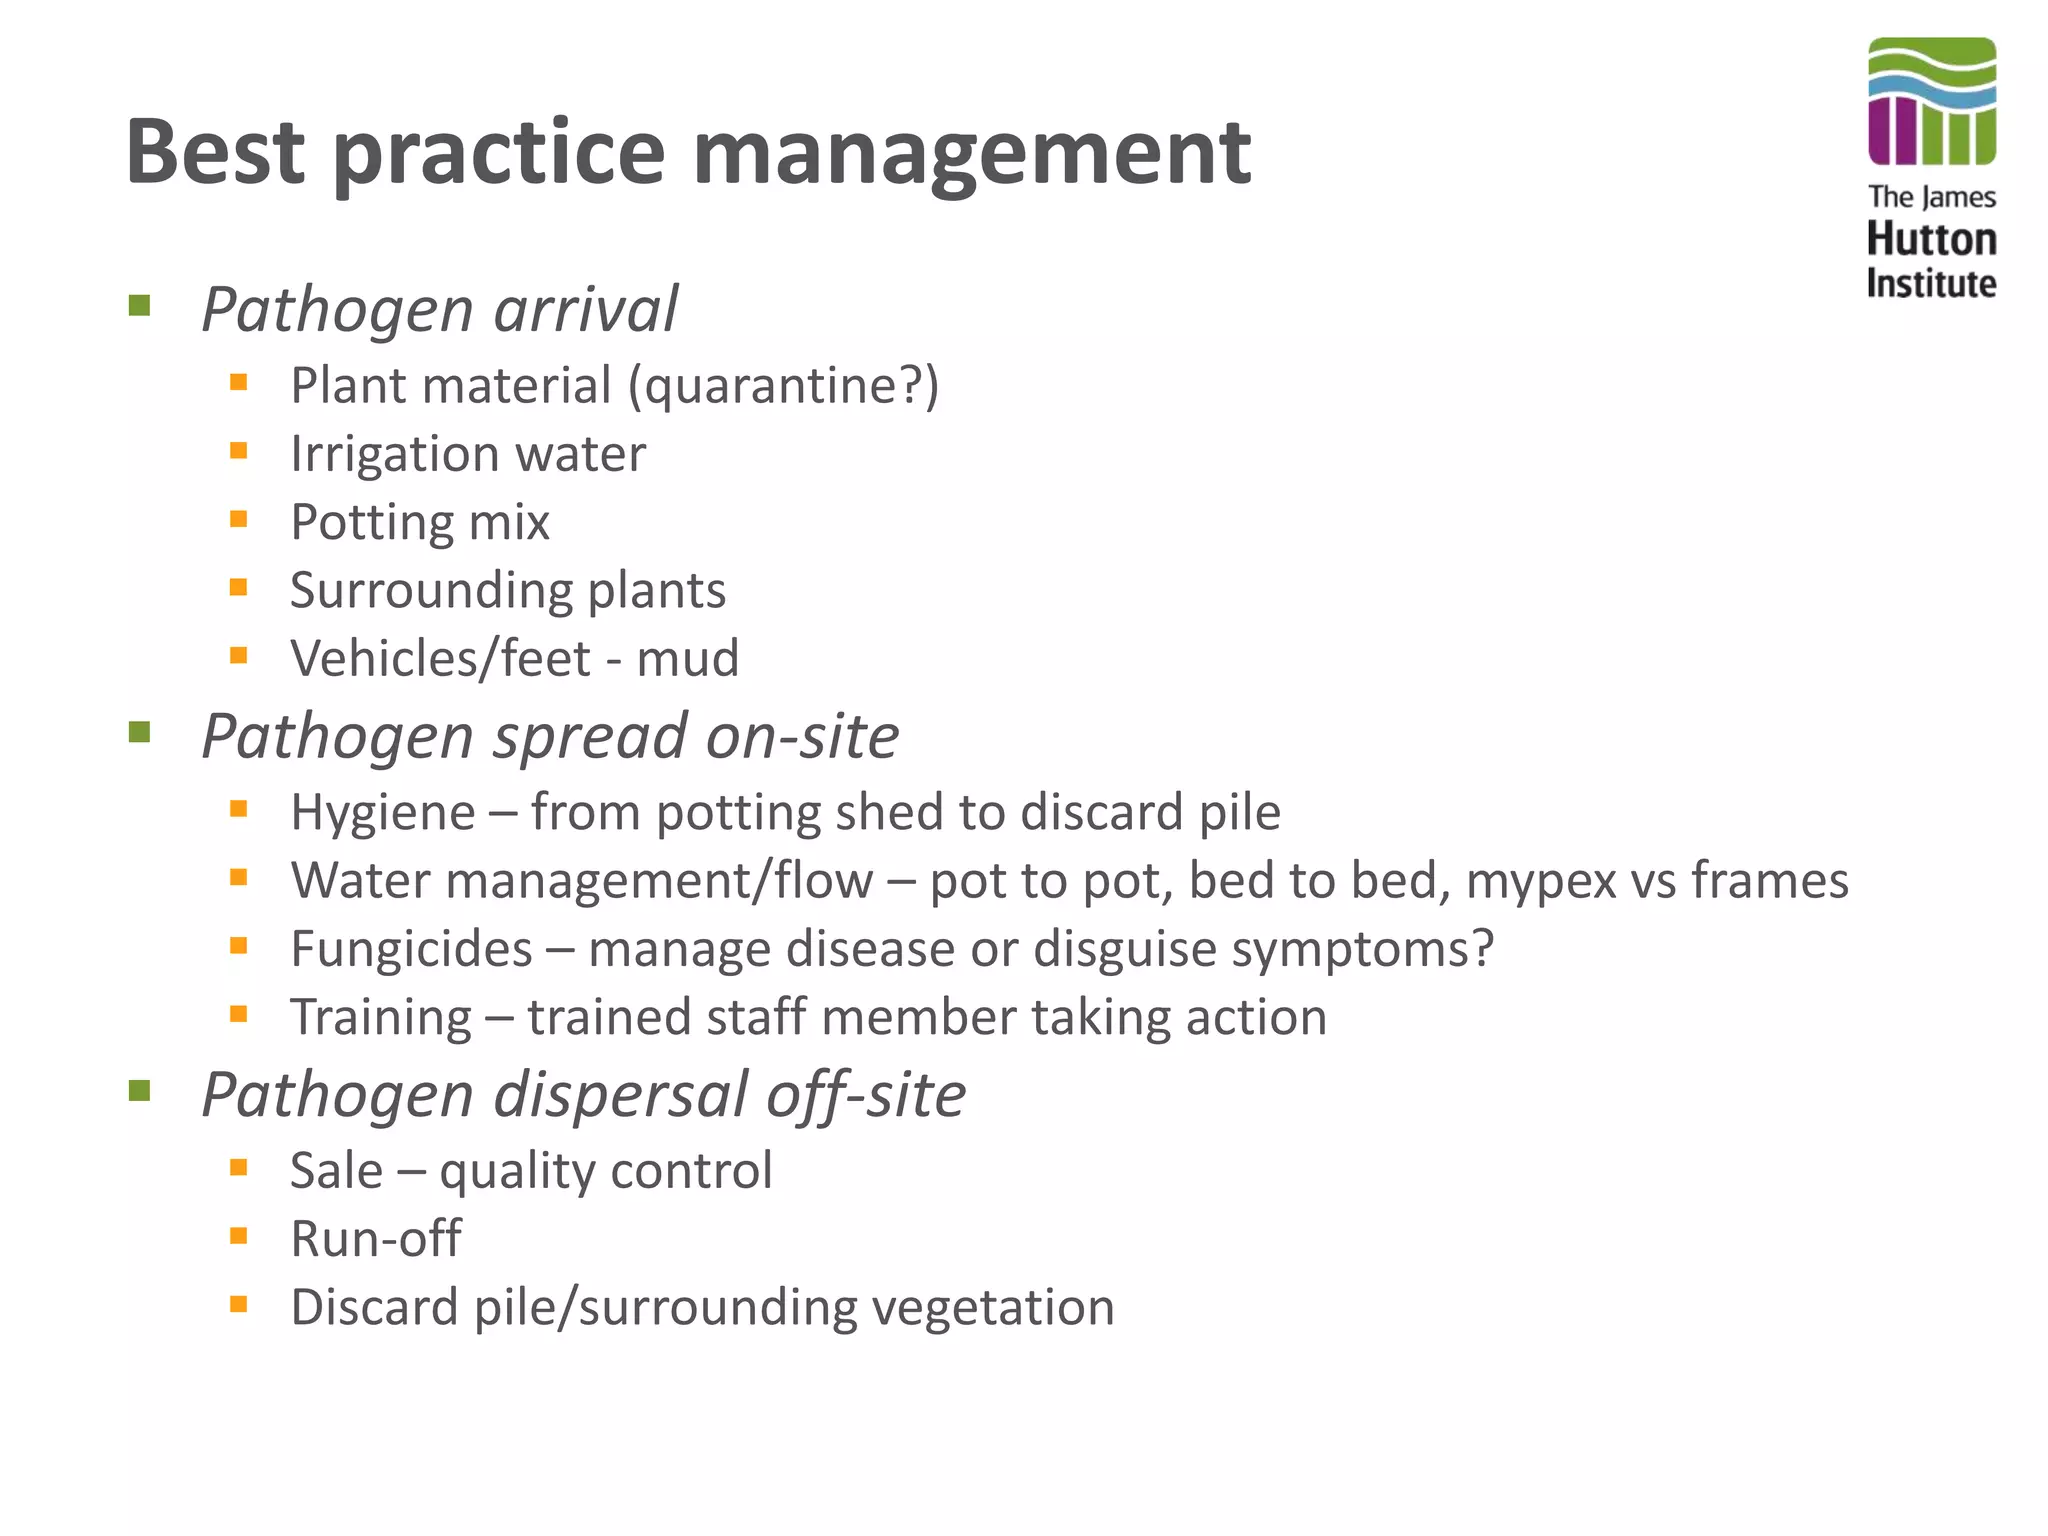
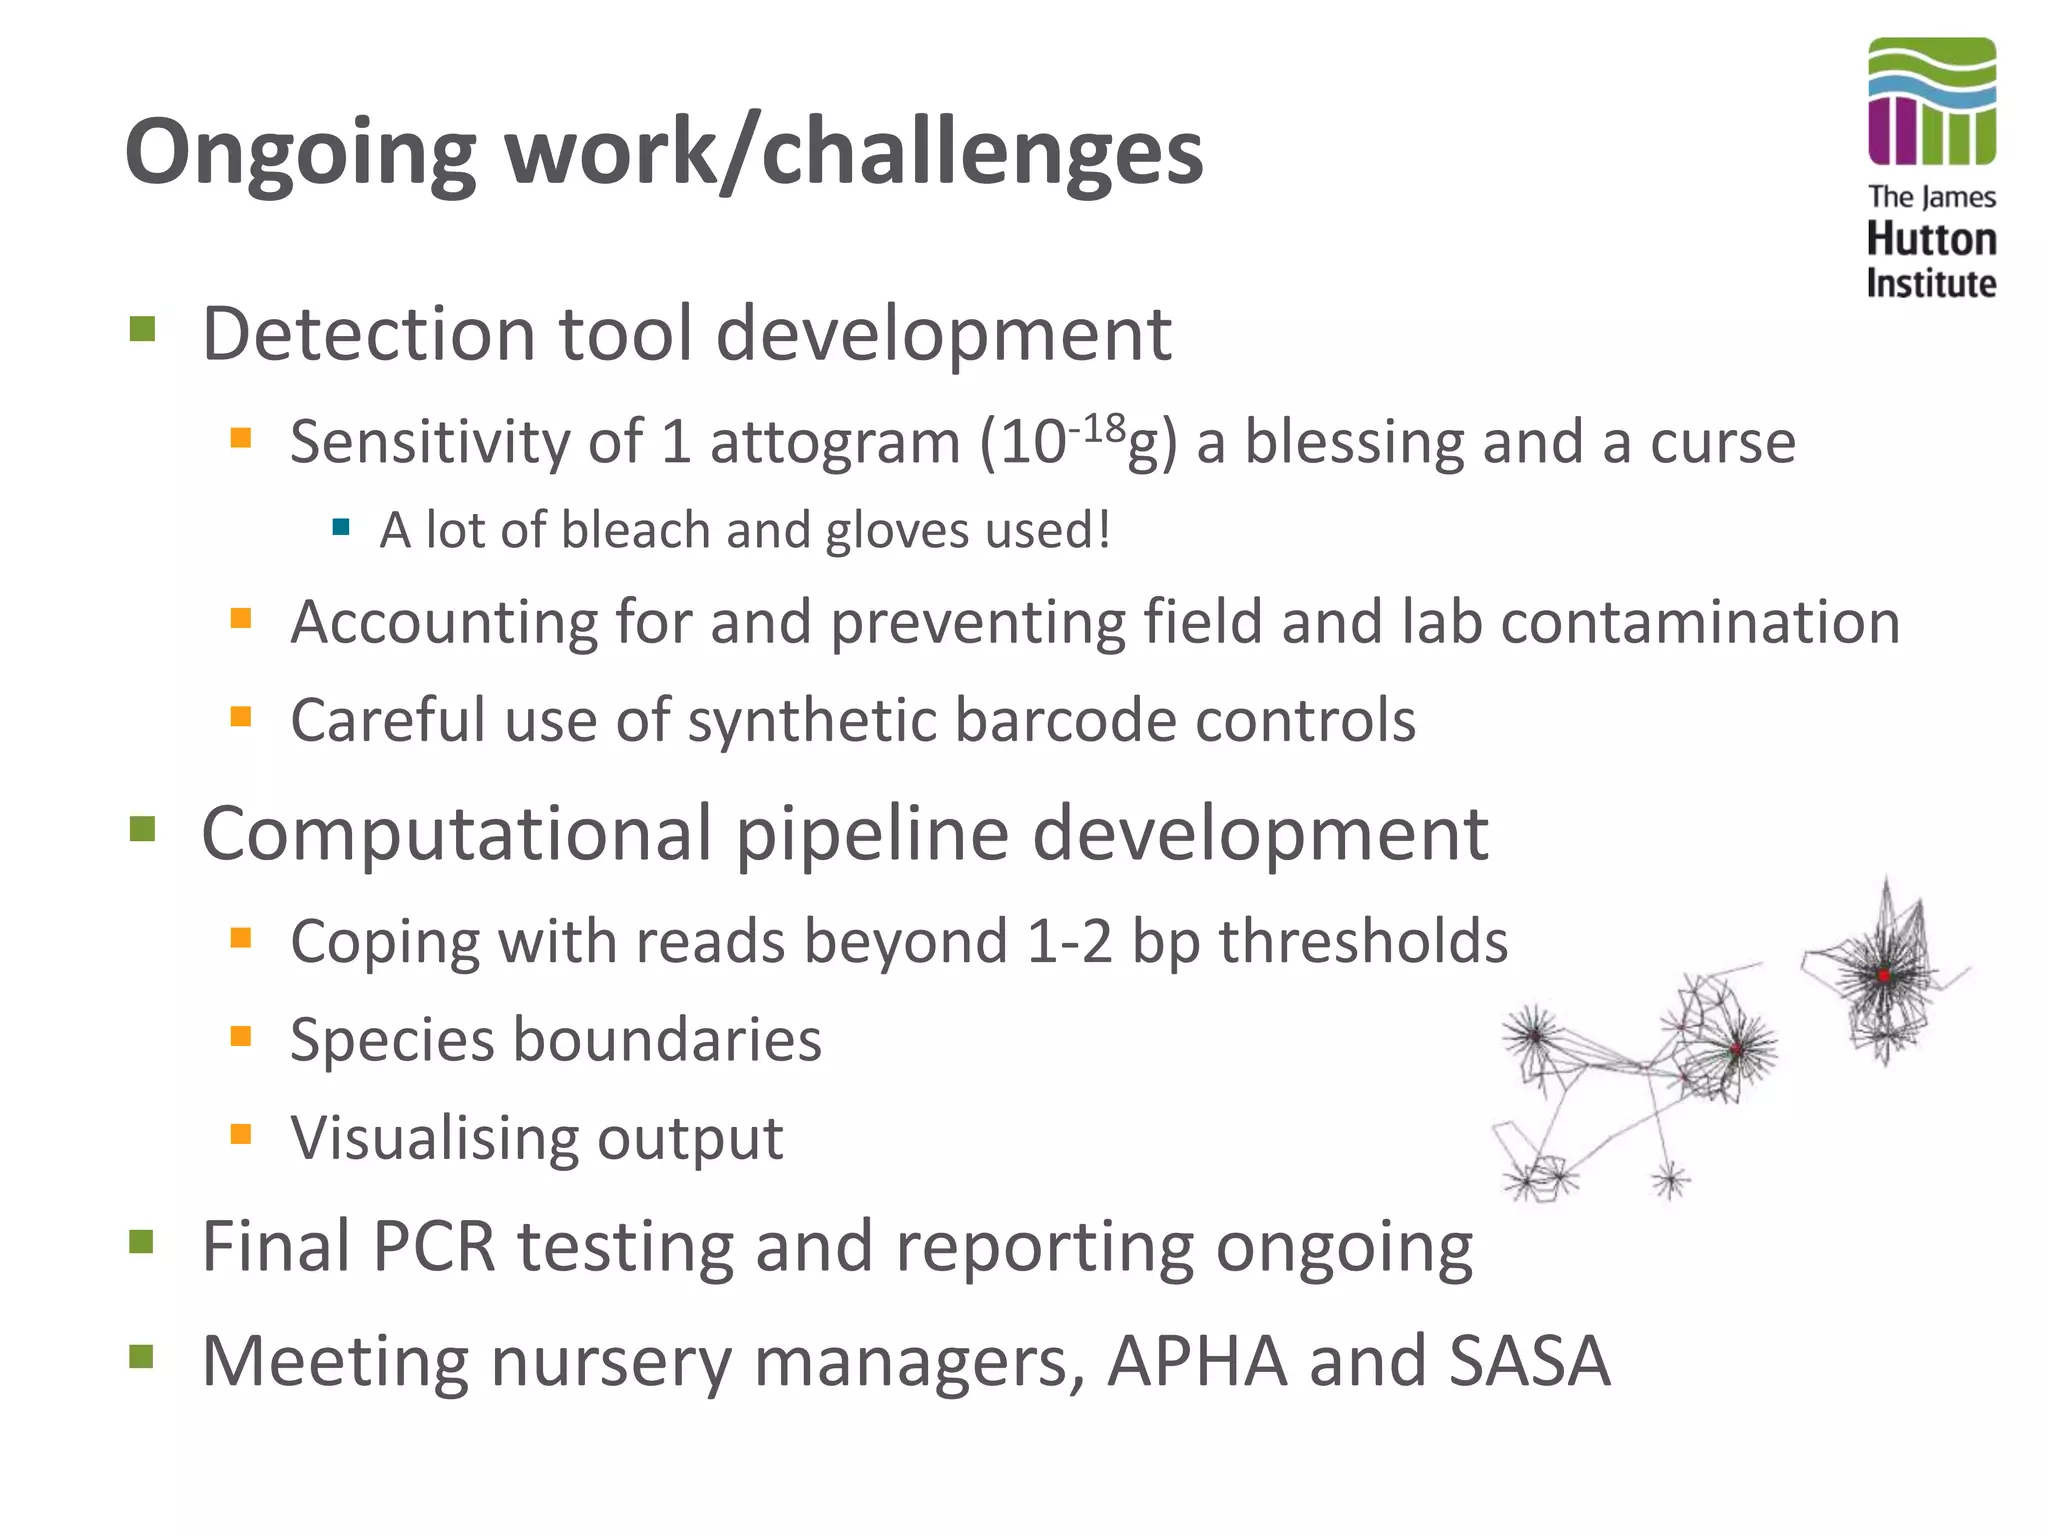

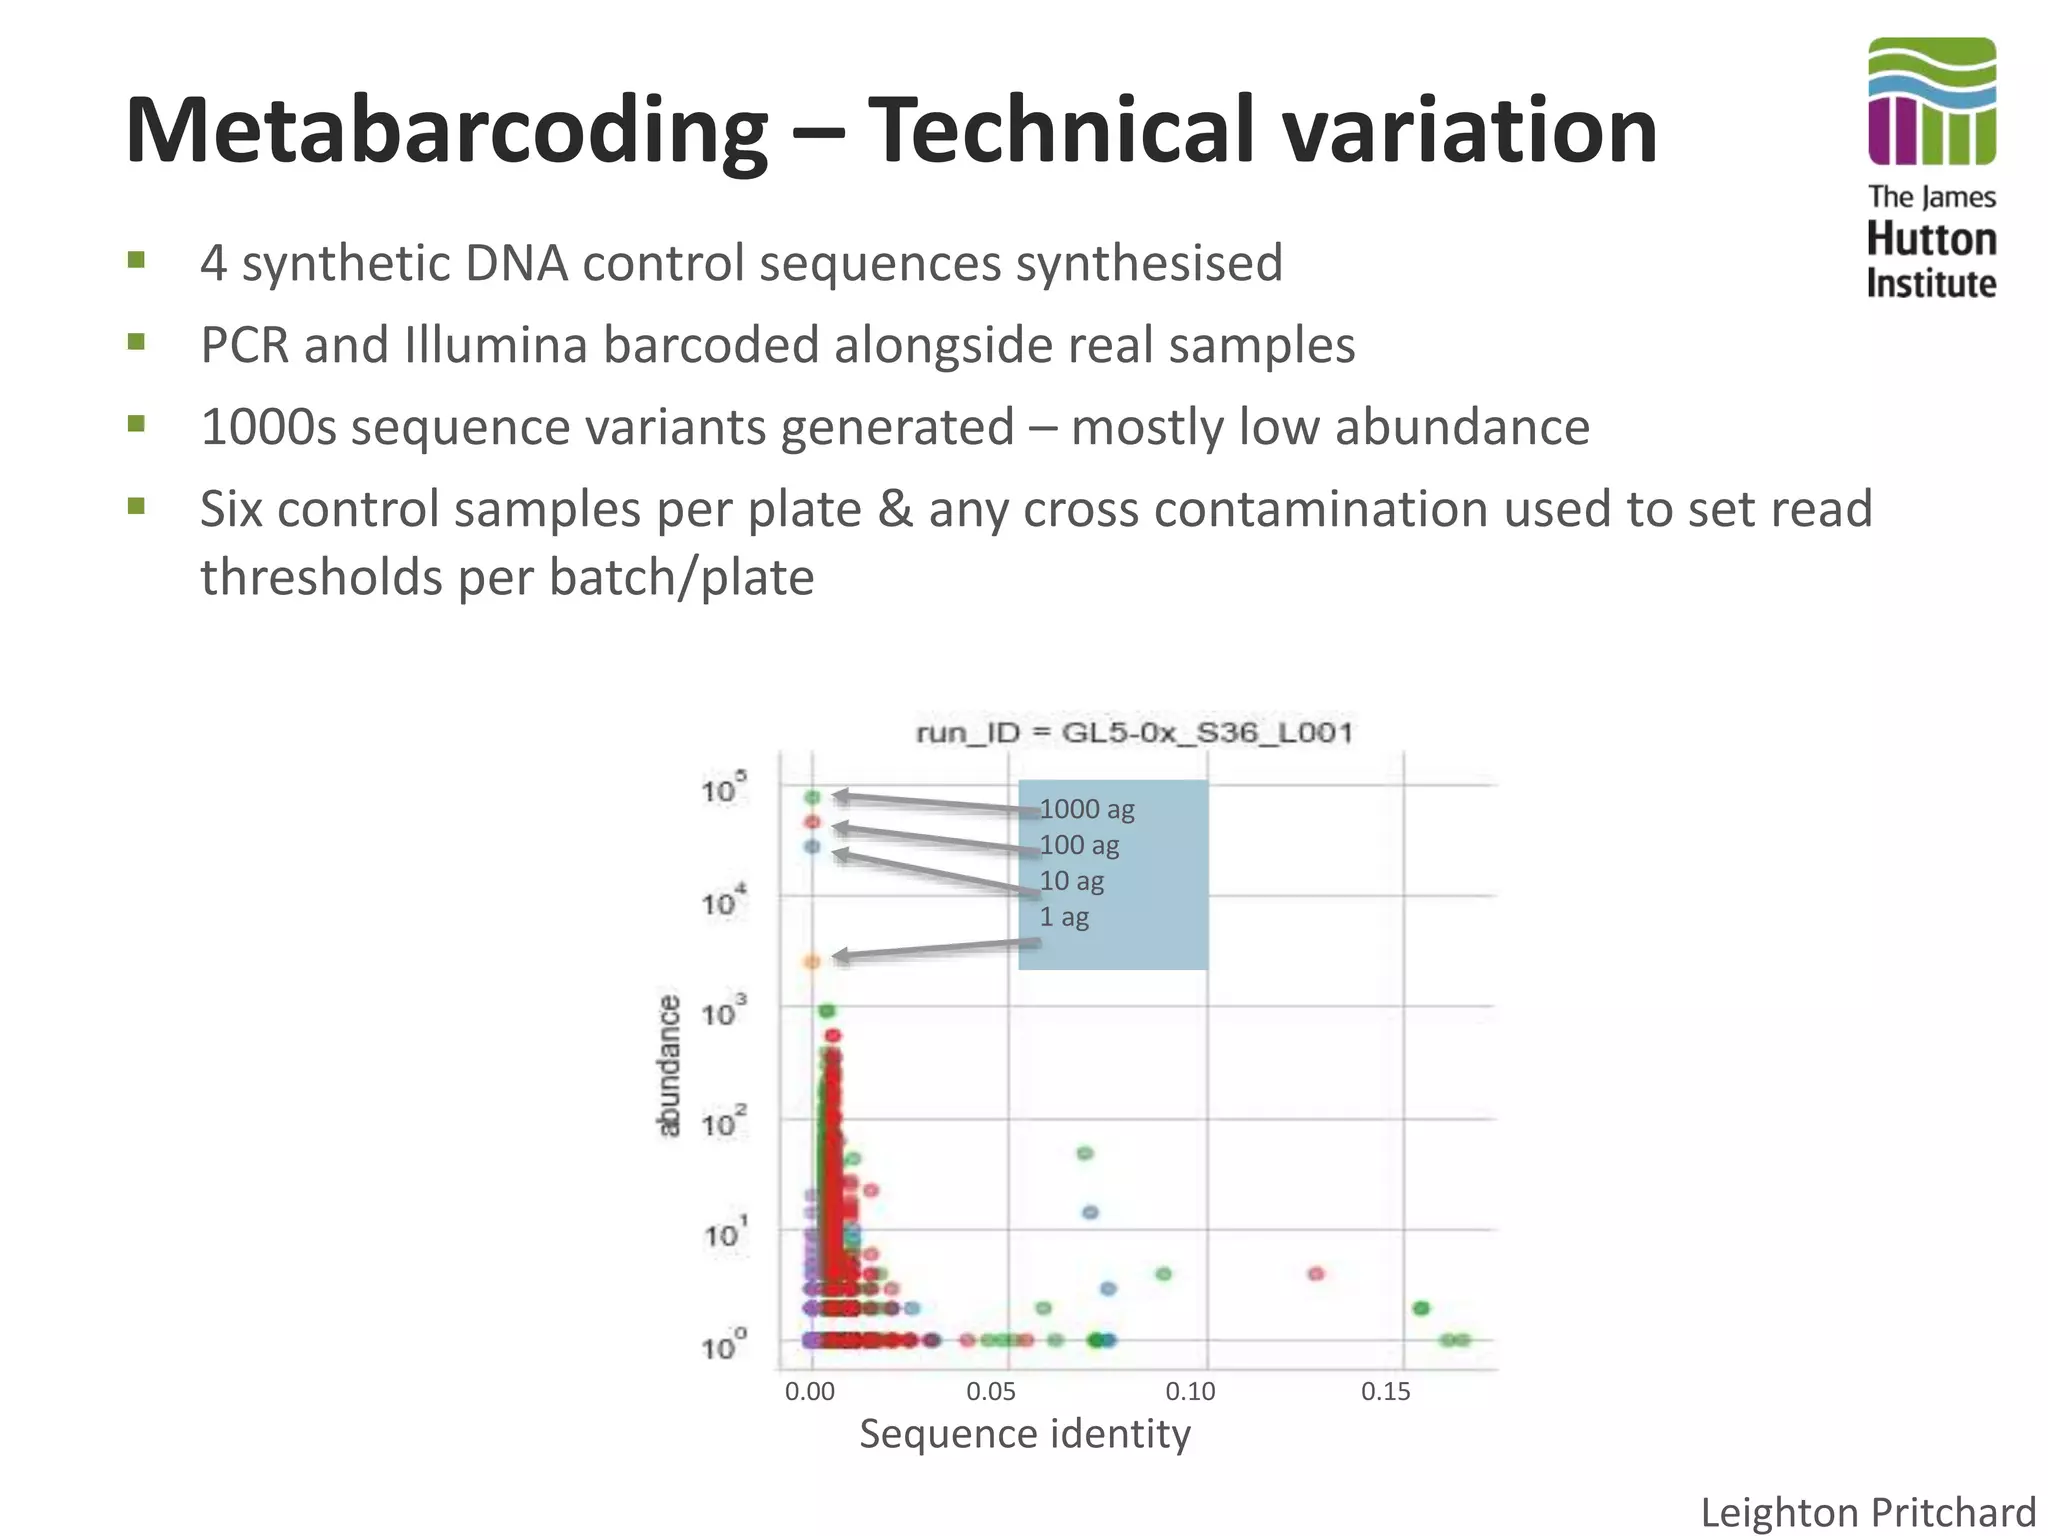


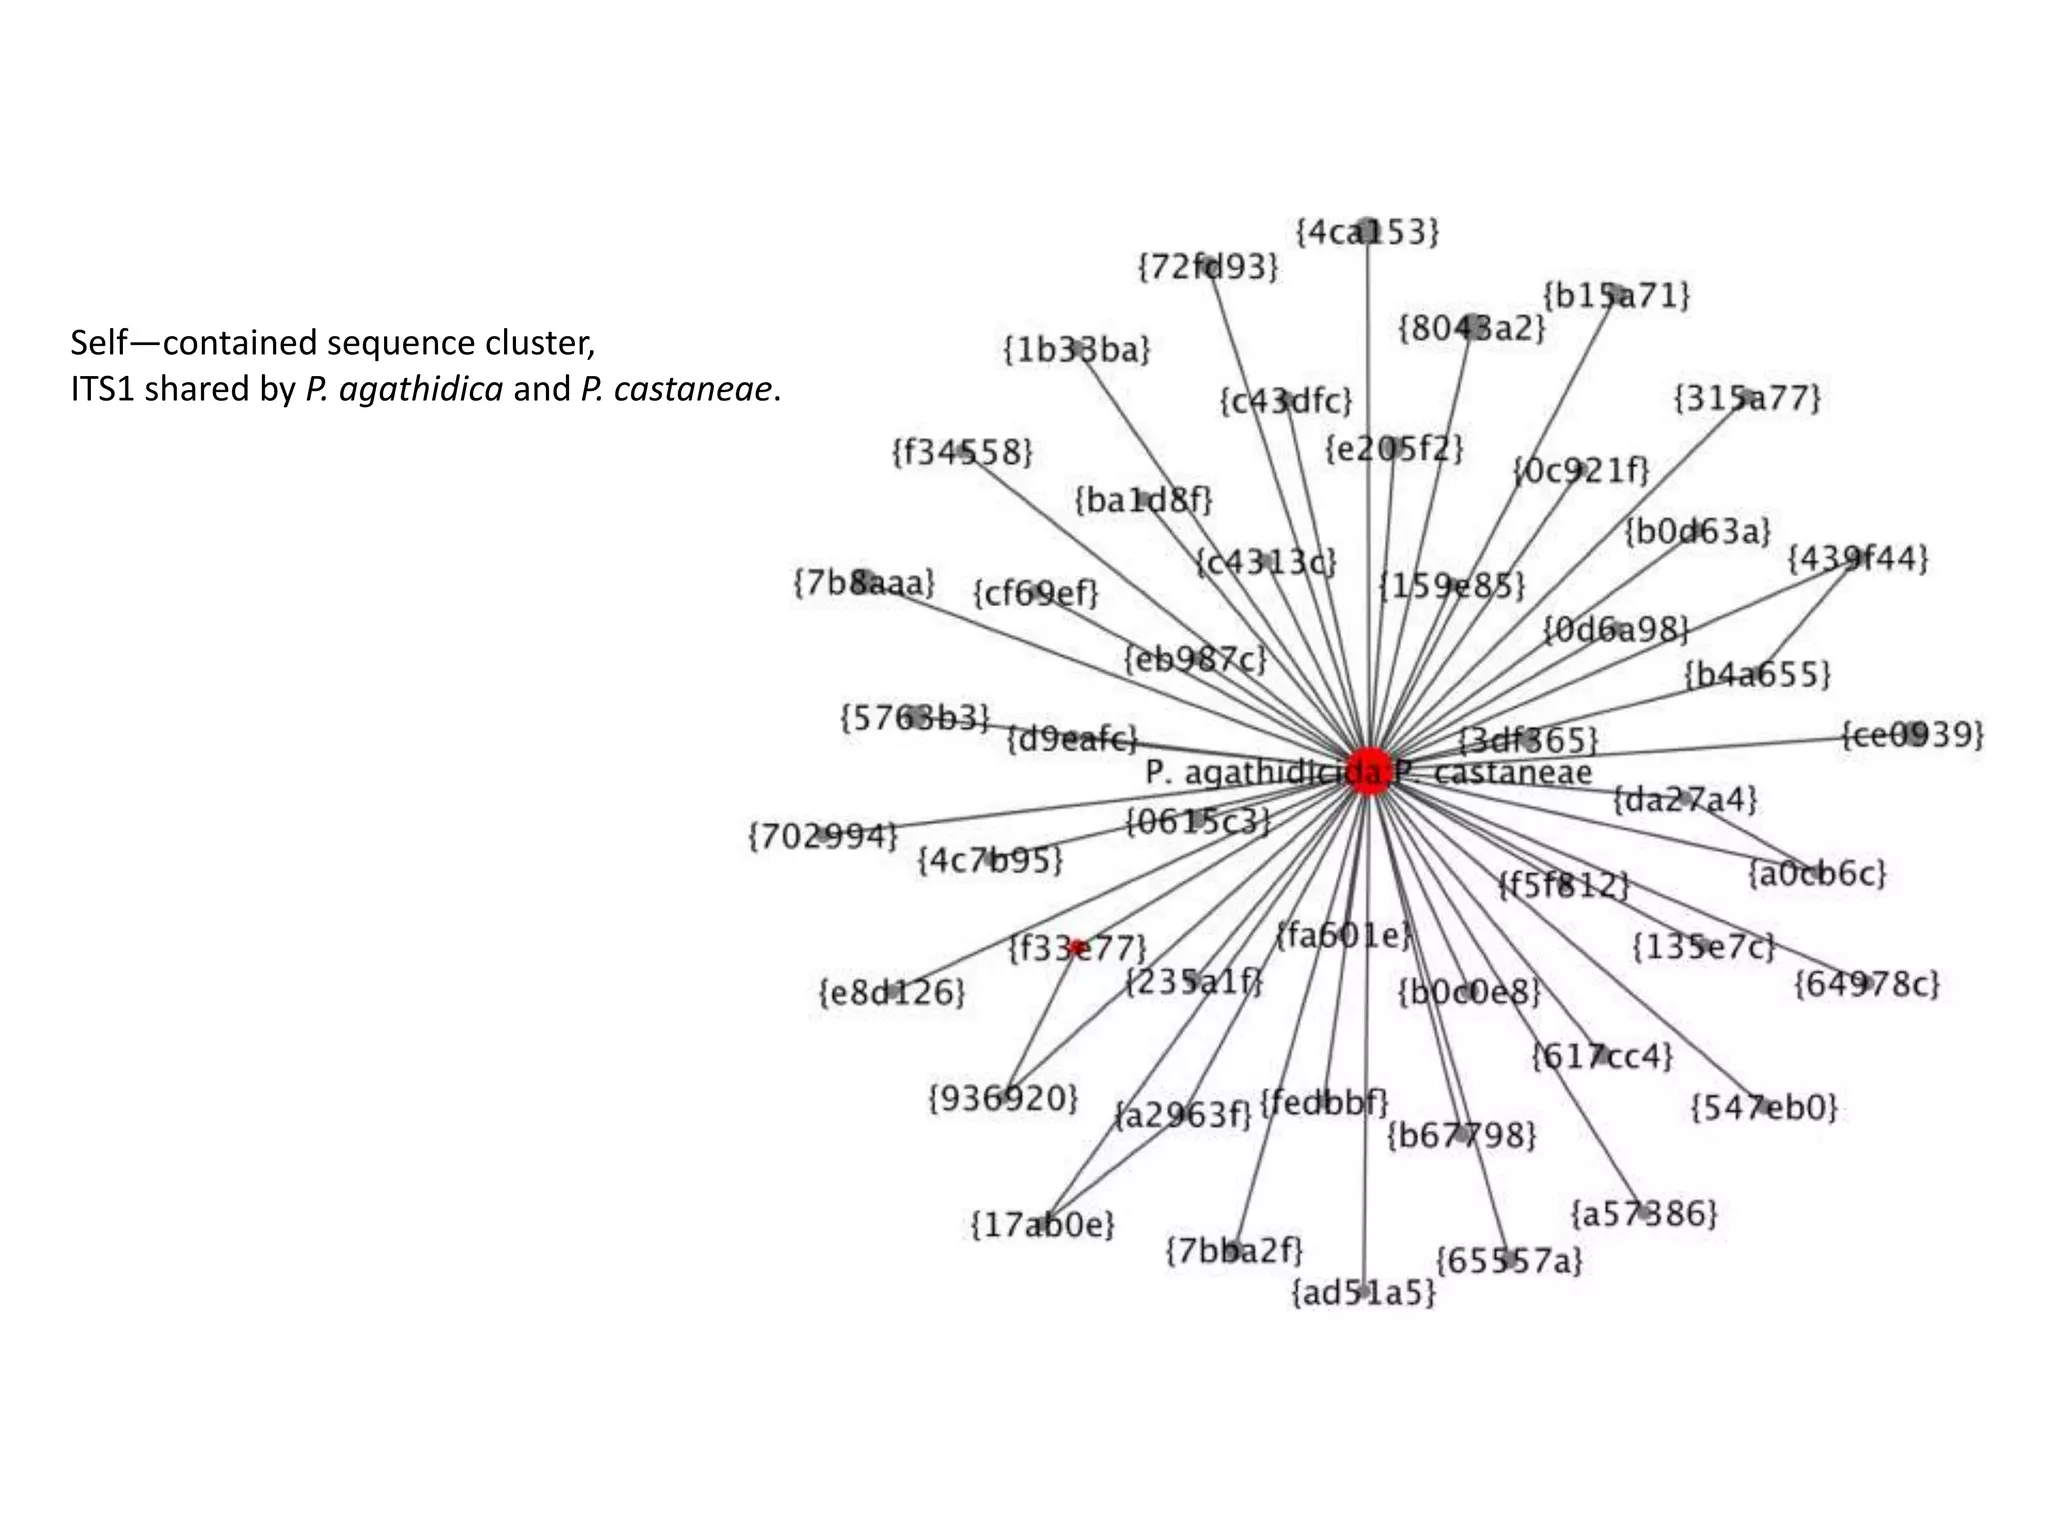
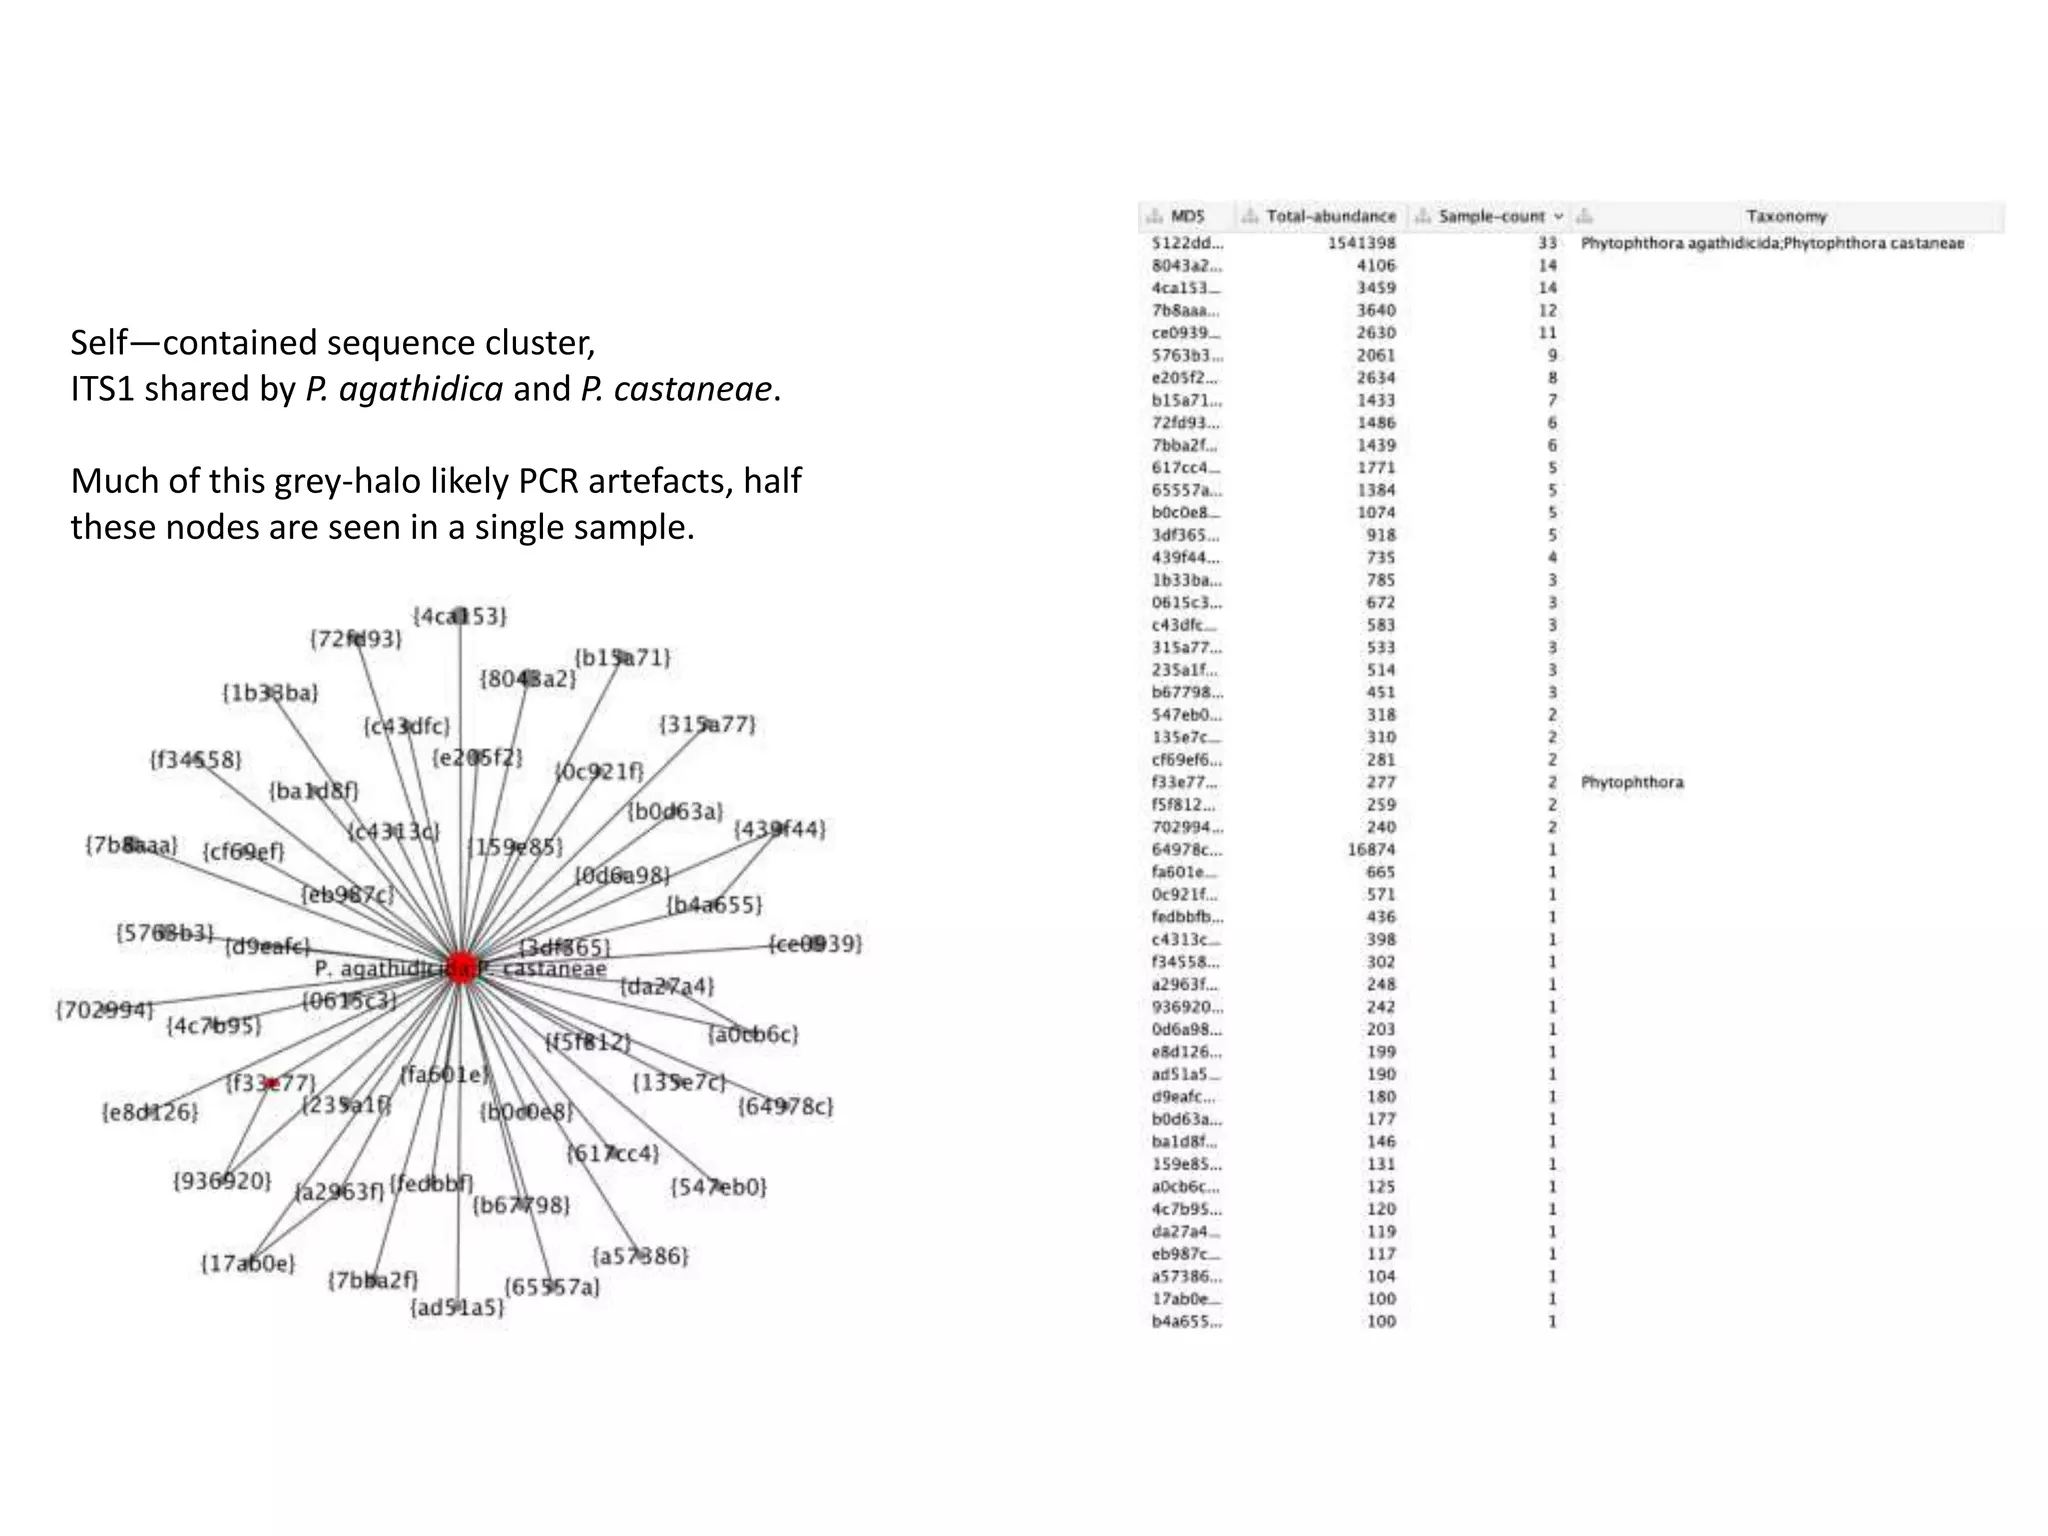

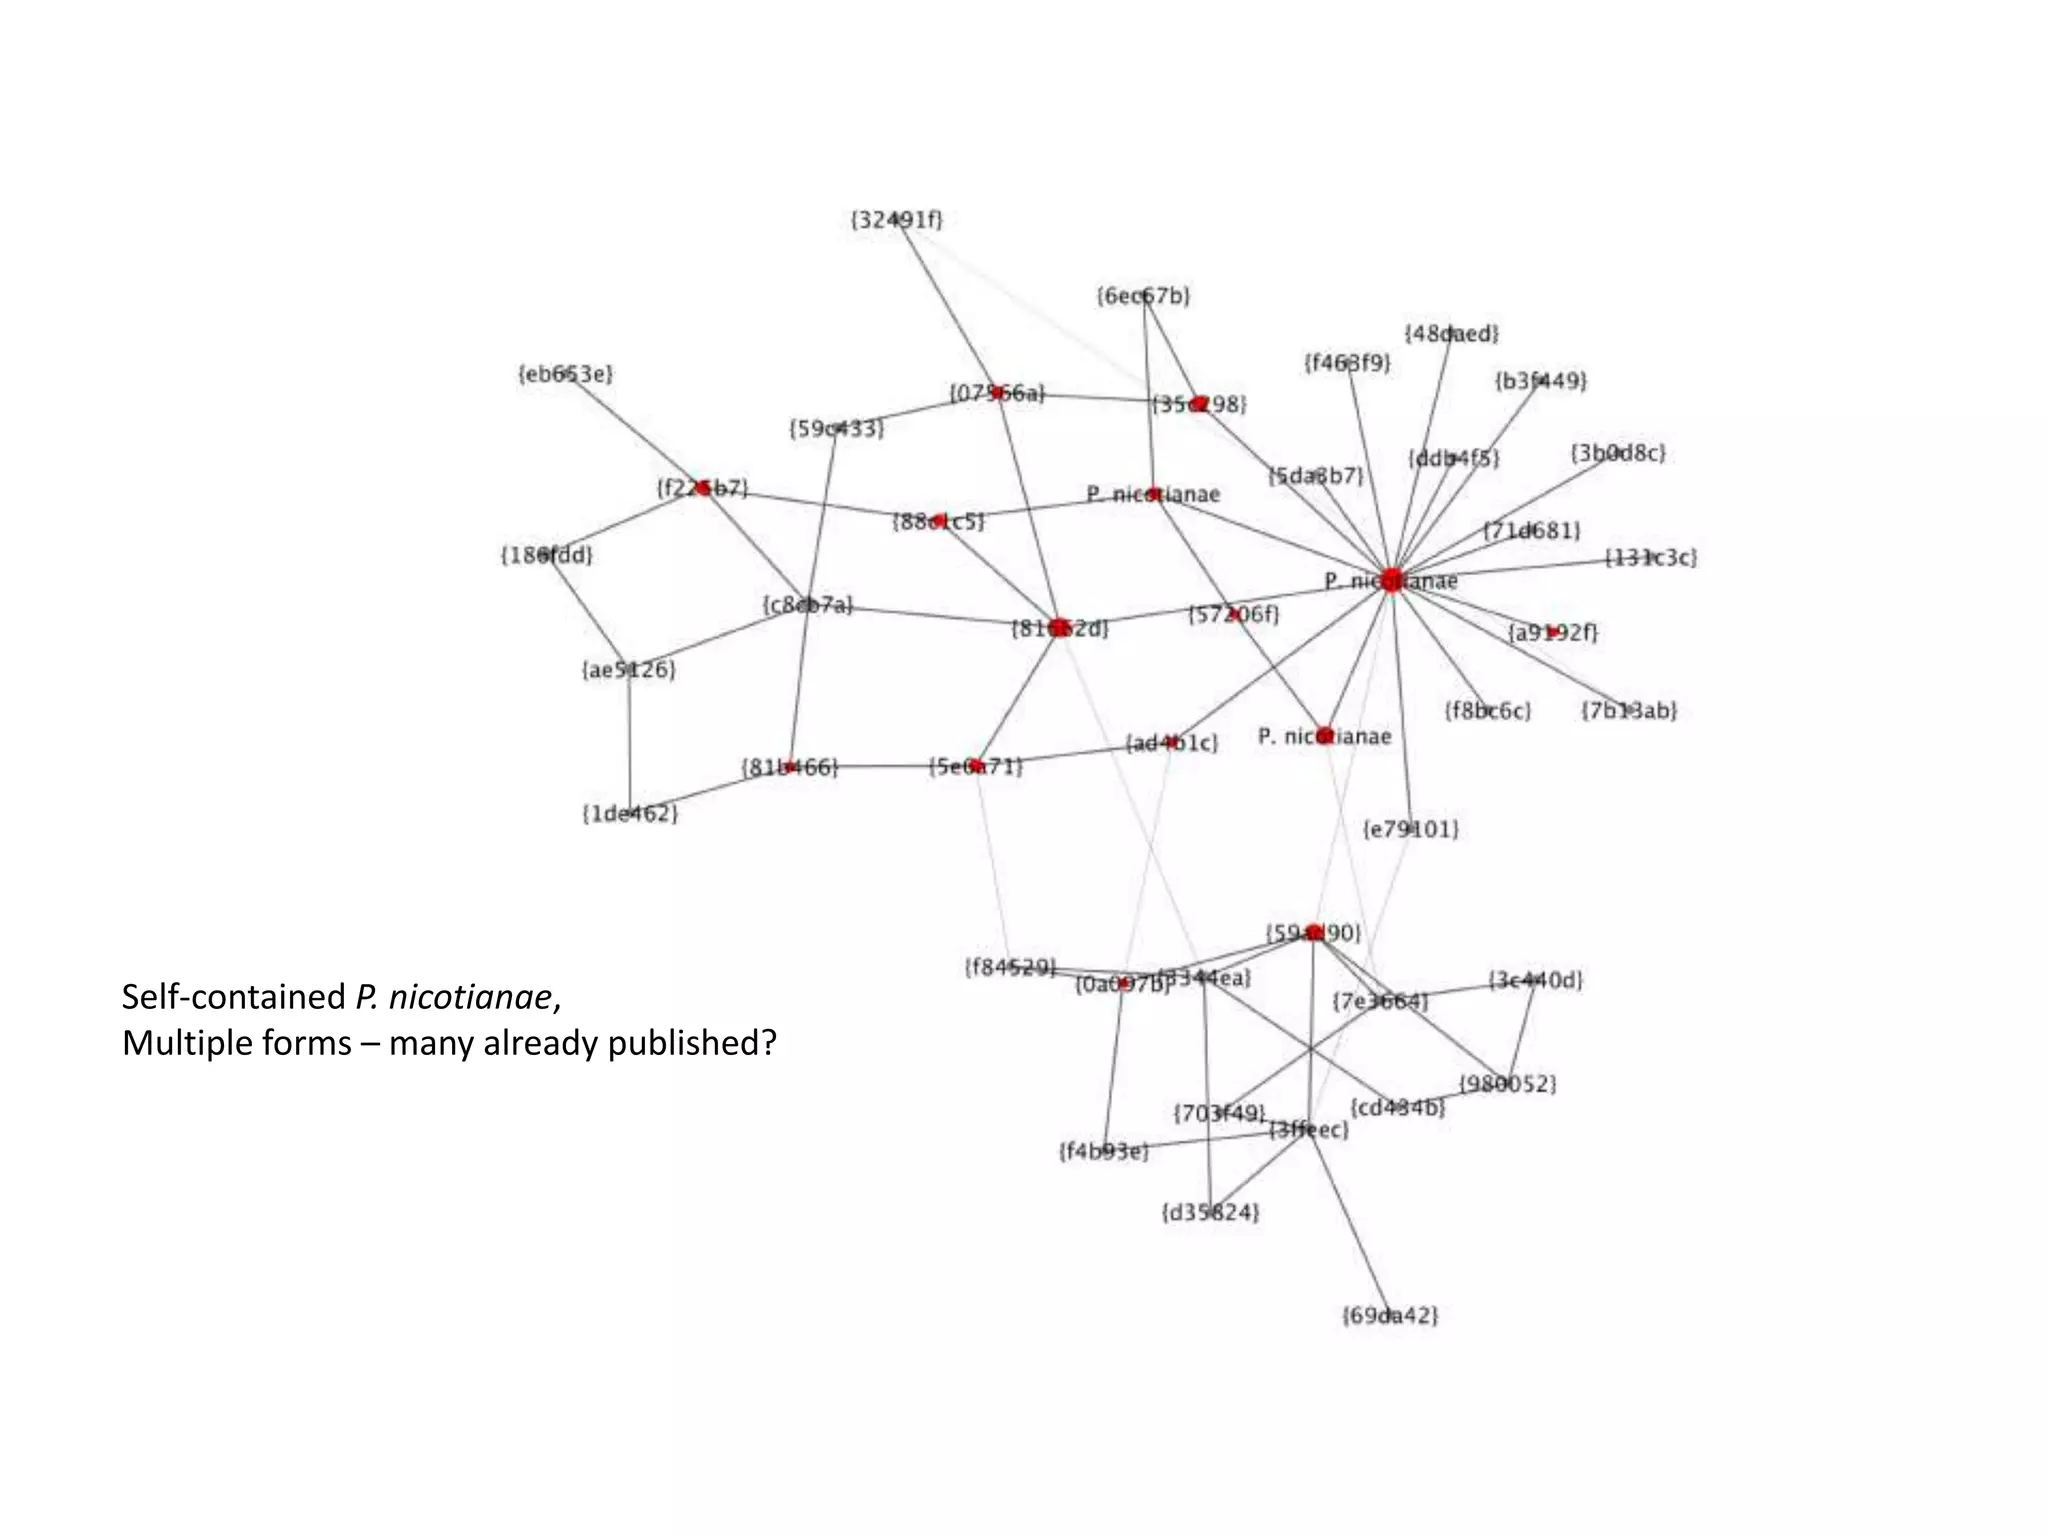


This document summarizes research on the distribution, diversity, and management of Phytophthora species in UK plant nurseries. The objectives were to manage biosecurity risks, generate data to support protocols, identify currently present and potential new threats, and examine diversity across propagation systems, watercourses, and over time. Samples were collected from nurseries and tested, with 40-50% positive for Phytophthora. Metabarcoding identified 58 Phytophthora species including pathogens of concern. Best practices for managing arrival, spread, and dispersal of pathogens in nurseries were discussed. Ongoing work includes accreditation schemes, computational methods, and controlling for contamination.


