Download to read offline

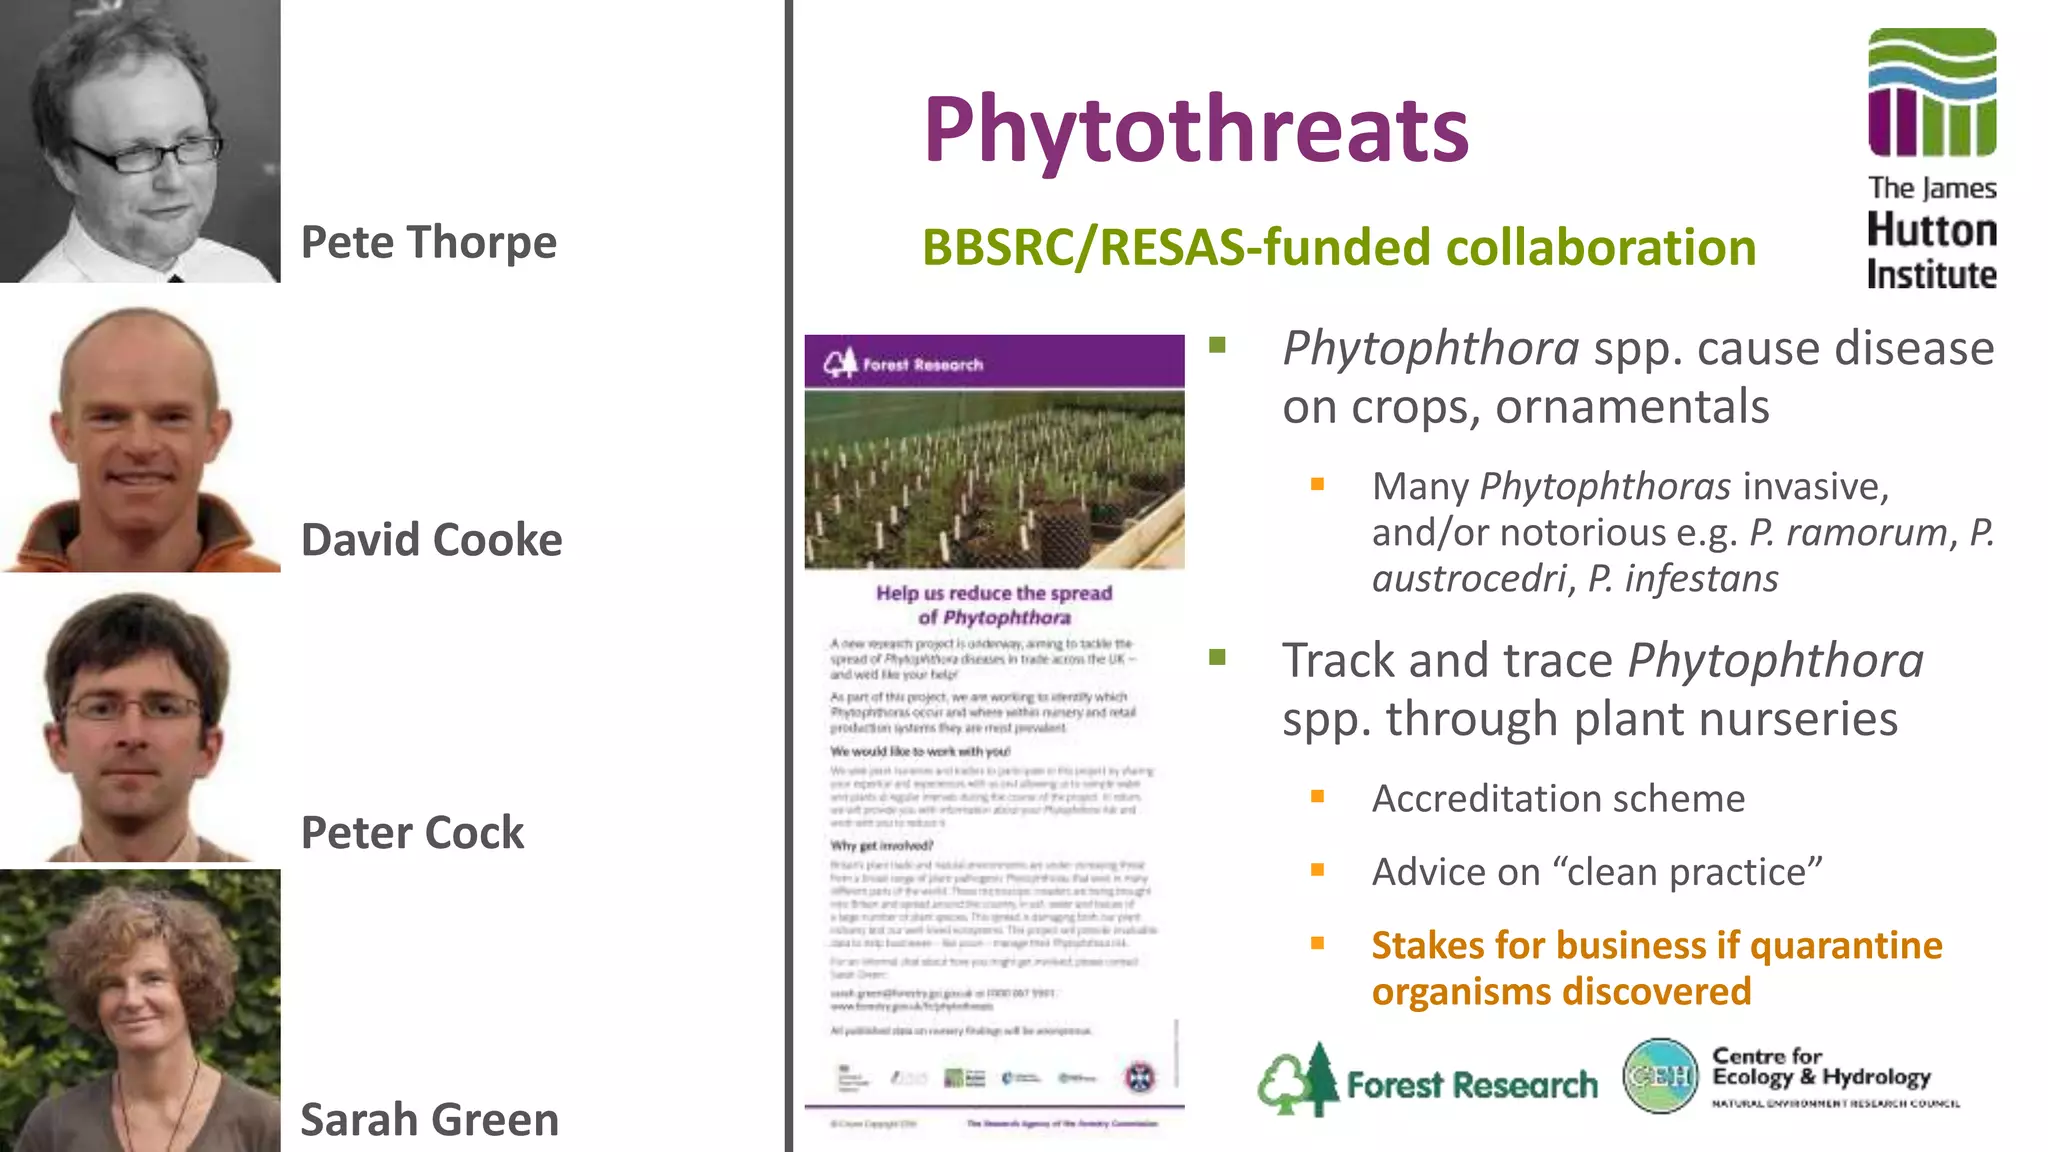

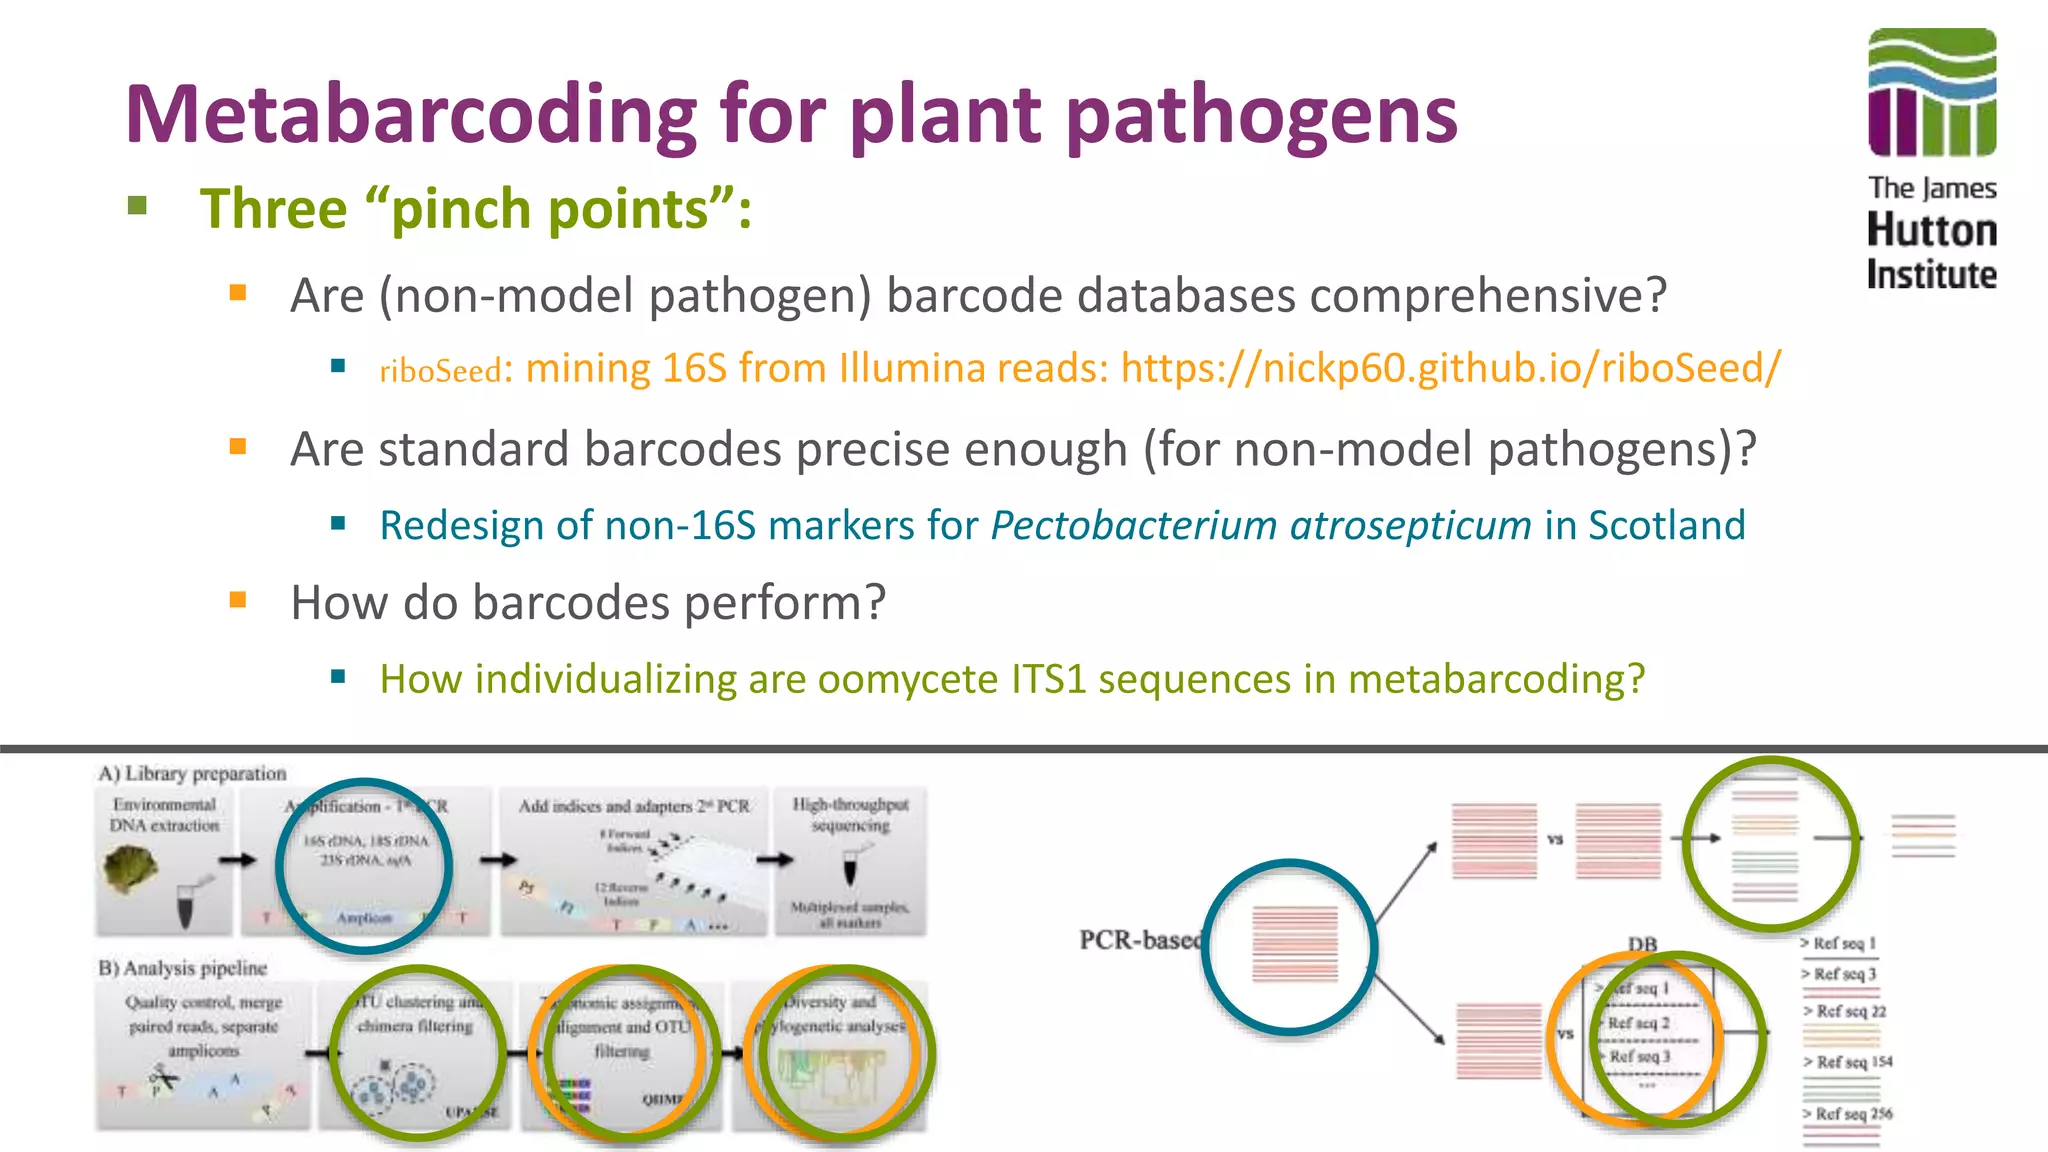

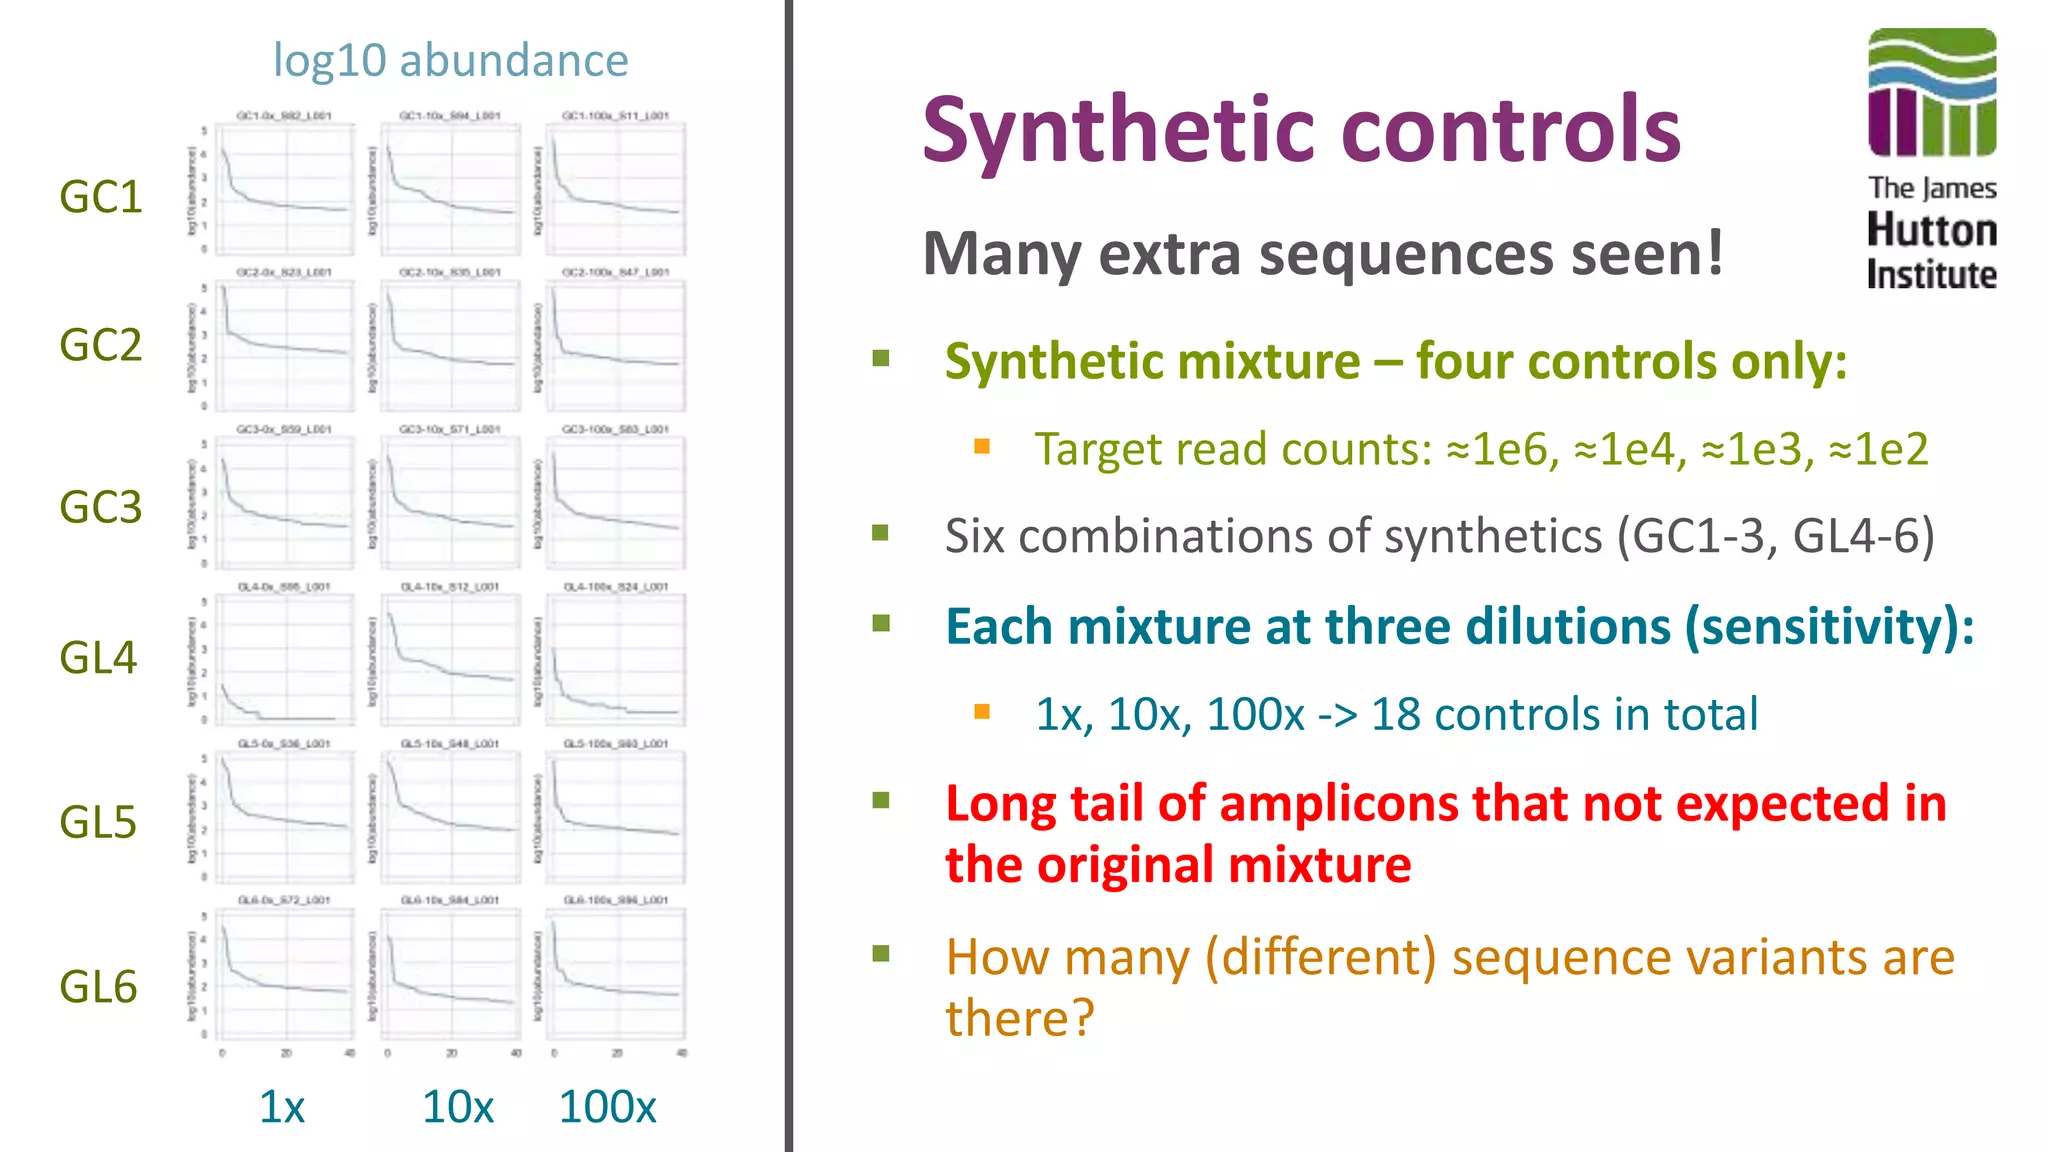

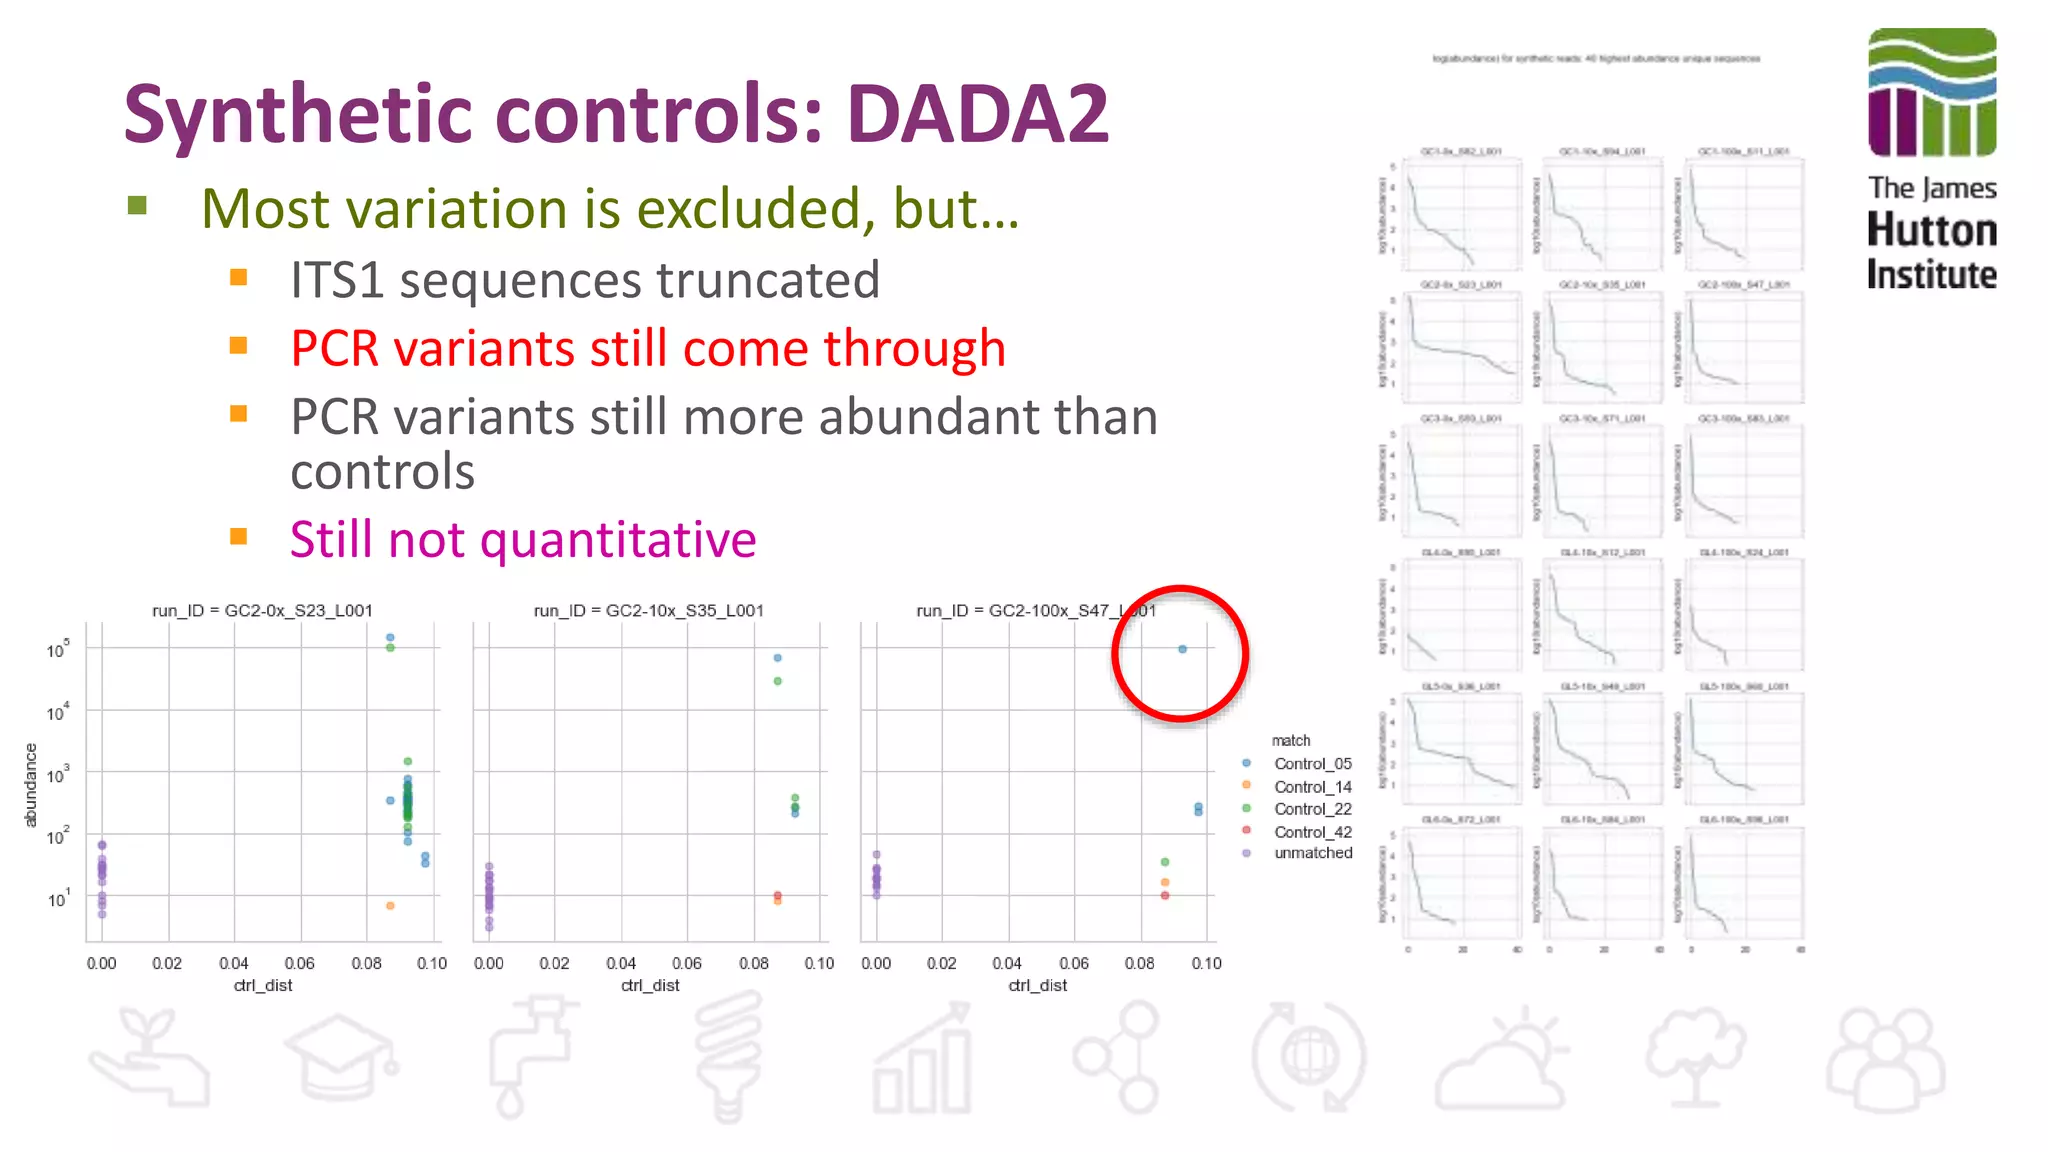

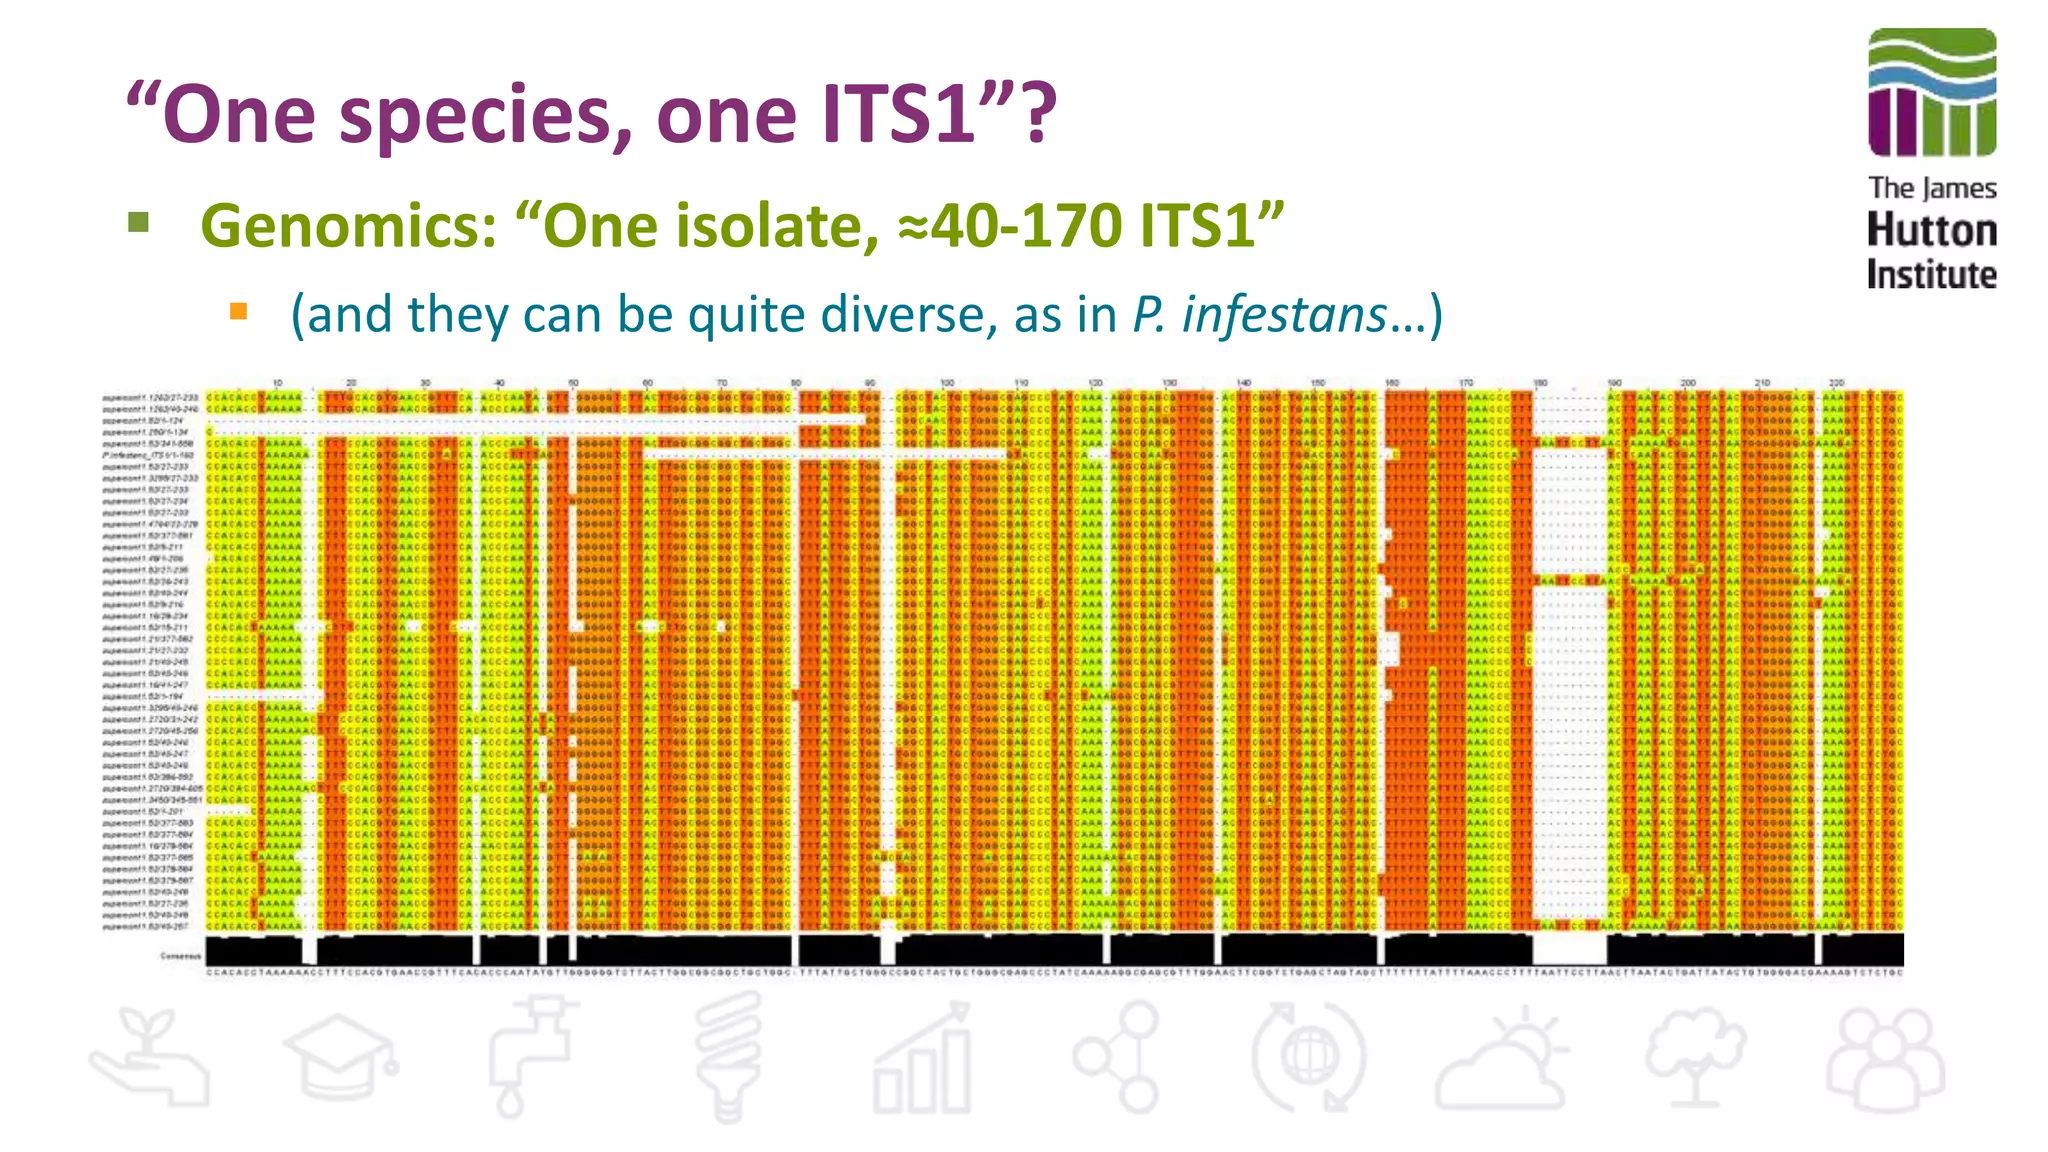
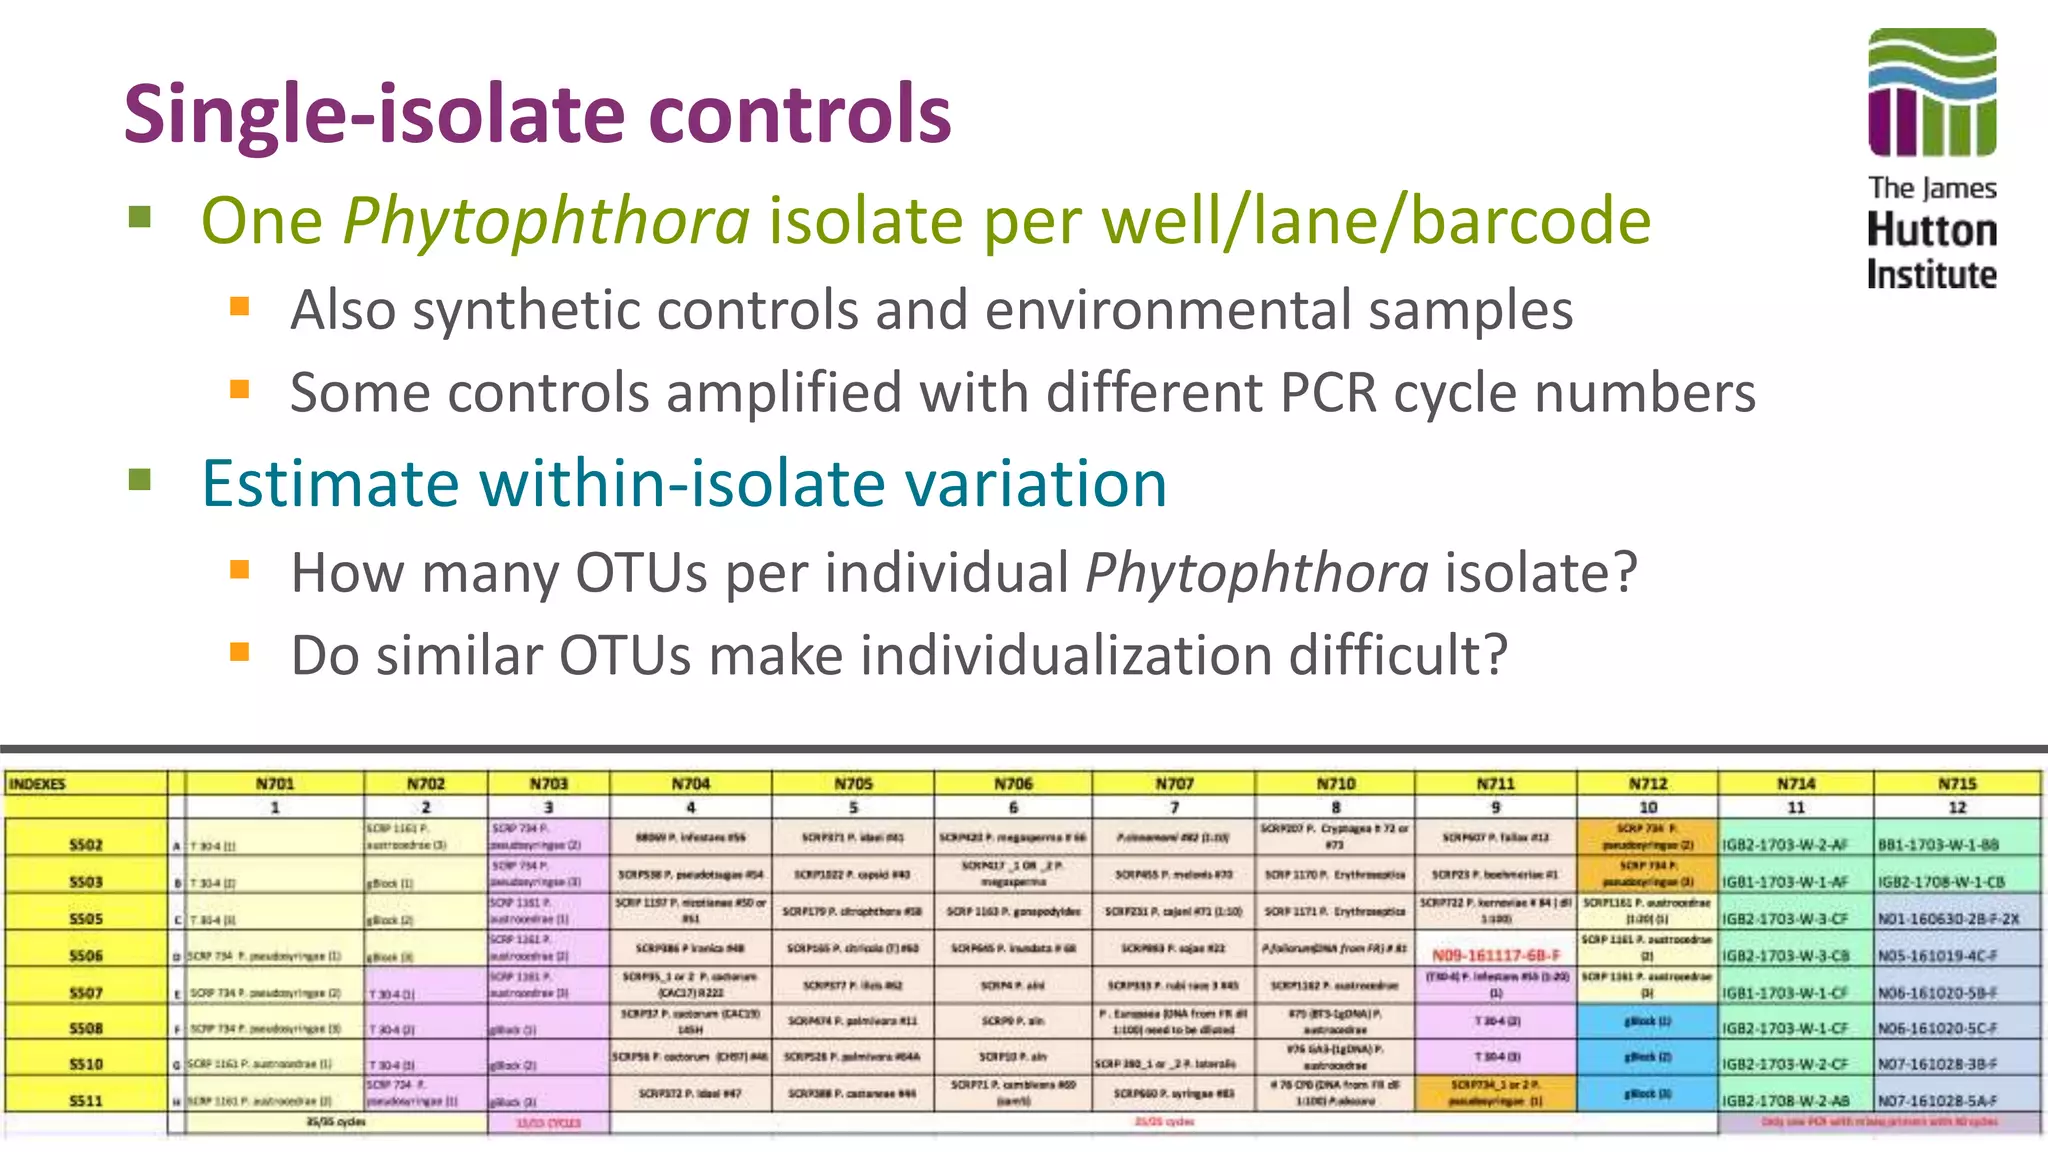


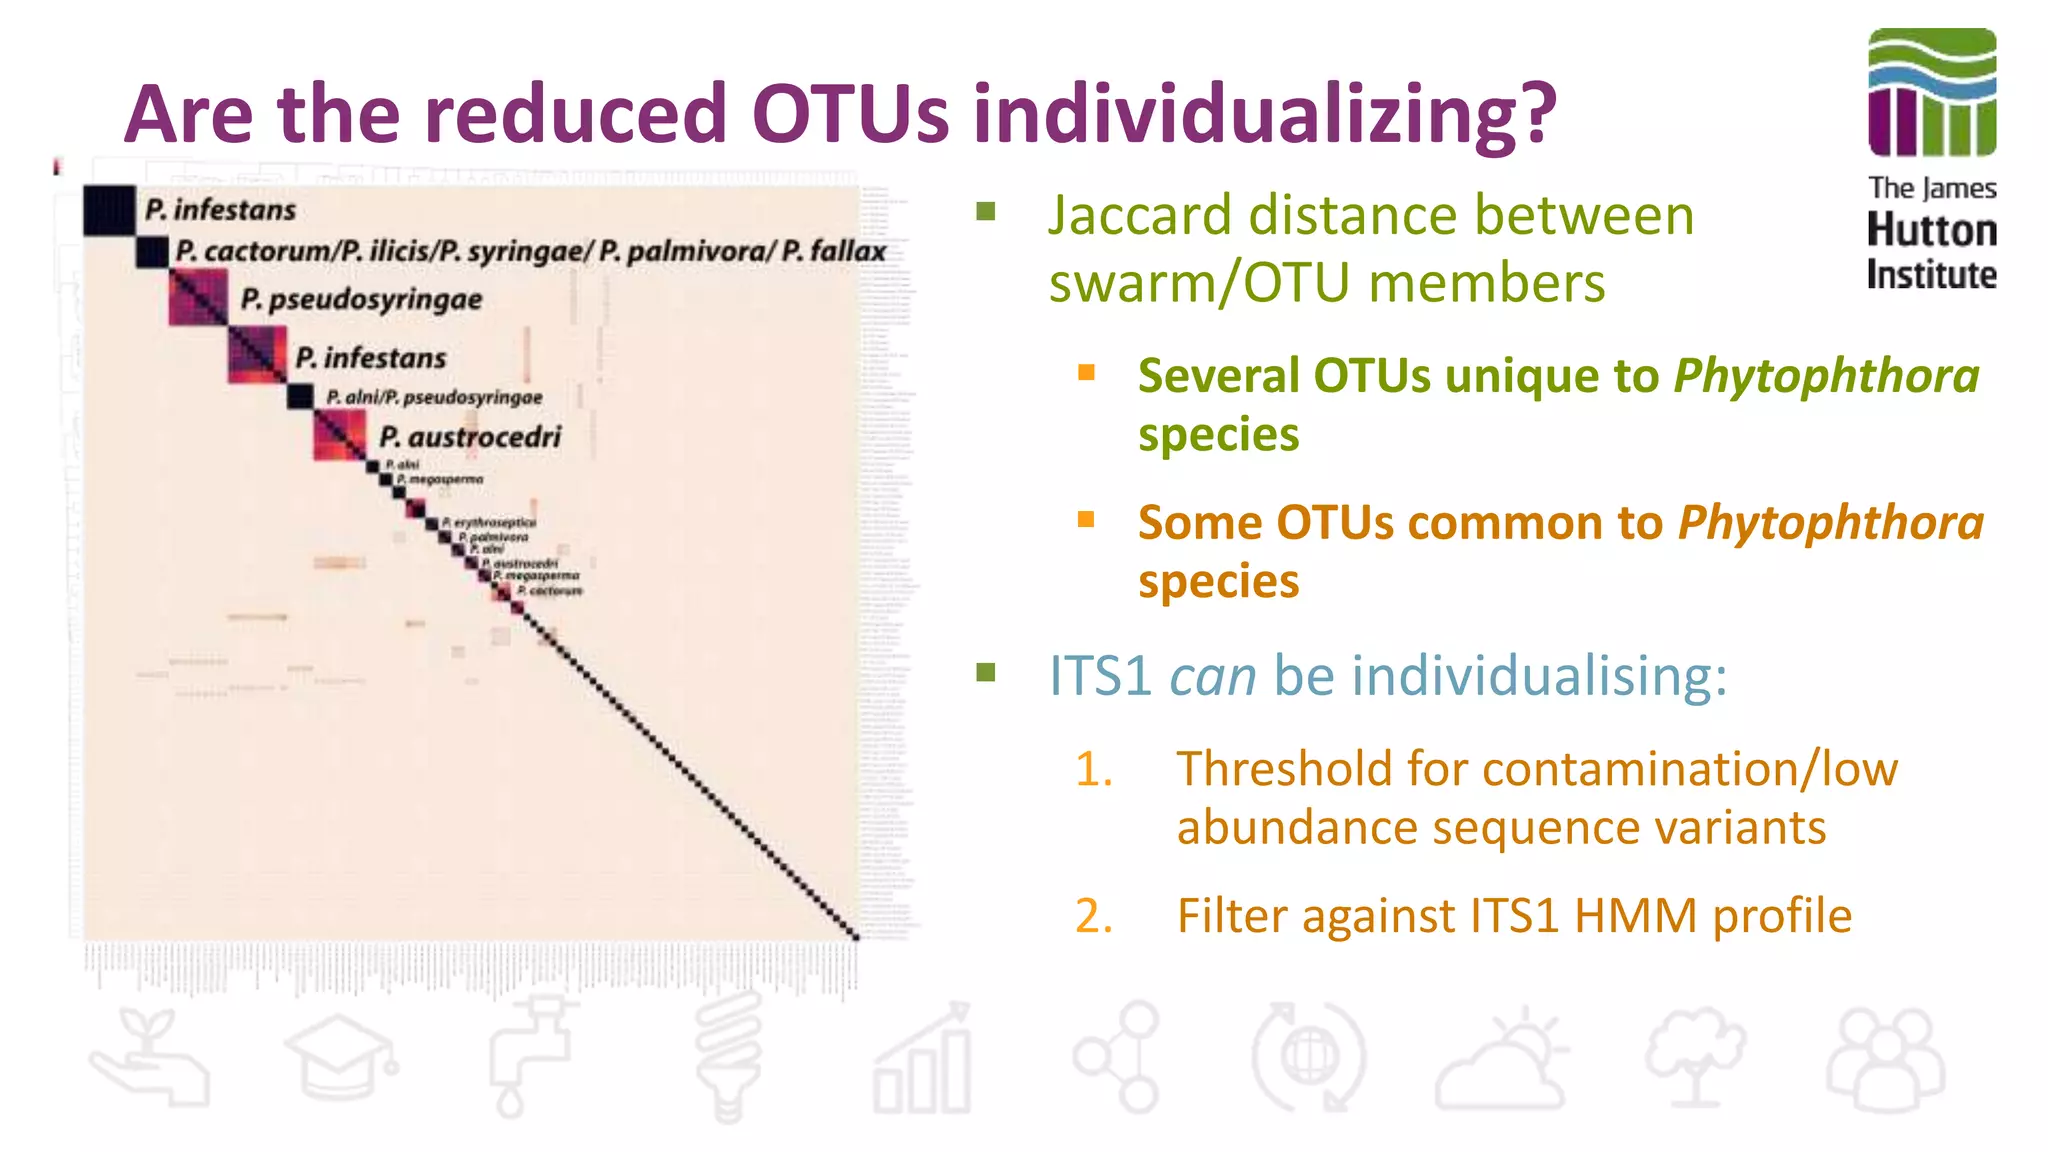


This document discusses using synthetic control sequences to evaluate metabarcoding methods for detecting plant pathogens. Synthetic sequences with the same base composition as Phytophthora ITS1 regions were added to samples in known quantities. Analysis found many more sequences than expected, indicating PCR amplification introduces variation. Even after filtering, multiple OTUs were detected for single isolates, suggesting ITS1 may not reliably individualize species. The document outlines developing a reference database and automated framework to systematically evaluate classification algorithms and databases using synthetic and real controls.


