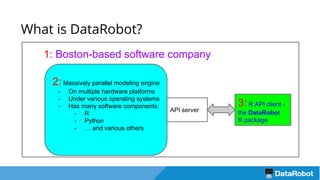
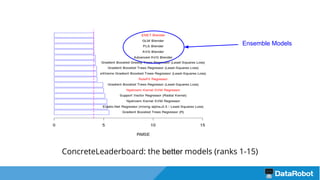
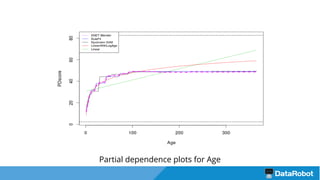
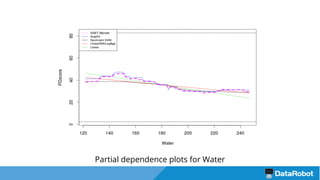
Top contenders in the 2015 KDD cup include the team from DataRobot comprising Owen Zhang, #1 Ranked Kaggler and top Kagglers Xavier Contort and Sergey Yurgenson. Get an in-depth look as Xavier describes their approach. DataRobot allowed the team to focus on feature engineering by automating model training, hyperparameter tuning, and model blending - thus giving the team a firm advantage.
Feature Importance Analysis with XGBoost in Tax auditMichael BENESTY
Presentation of a real use case at TAJ law firm (Deloitte Paris) of applying Machine learning on accounting to help clients to prepare their tax audit.
Winning Kaggle 101: Introduction to StackingTed Xiao
An Introduction to Stacking by Erin LeDell, from H2O.ai
Presented as part of the "Winning Kaggle 101" event, hosted by Machine Learning at Berkeley and Data Science Society at Berkeley. Special thanks to the Berkeley Institute of Data Science for the venue!
H2O.ai: http://www.h2o.ai/
ML@B: ml.berkeley.edu
DSSB: http://dssberkeley.org
BIDS: http://bids.berkeley.edu/
One of the most important, yet often overlooked, aspects of predictive modeling is the transformation of data to create model inputs, better known as feature engineering (FE). This talk will go into the theoretical background behind FE, showing how it leverages existing data to produce better modeling results. It will then detail some important FE techniques that should be in every data scientist’s tool kit.
Scikit-Learn is a powerful machine learning library implemented in Python with numeric and scientific computing powerhouses Numpy, Scipy, and matplotlib for extremely fast analysis of small to medium sized data sets. It is open source, commercially usable and contains many modern machine learning algorithms for classification, regression, clustering, feature extraction, and optimization. For this reason Scikit-Learn is often the first tool in a Data Scientists toolkit for machine learning of incoming data sets.
The purpose of this one day course is to serve as an introduction to Machine Learning with Scikit-Learn. We will explore several clustering, classification, and regression algorithms for a variety of machine learning tasks and learn how to implement these tasks with our data using Scikit-Learn and Python. In particular, we will structure our machine learning models as though we were producing a data product, an actionable model that can be used in larger programs or algorithms; rather than as simply a research or investigation methodology.
VSSML16 LR1. Summary Day 1
Valencian Summer School in Machine Learning 2016
Day 1
Summary Day 1
Mercè Martin (BigML)
https://bigml.com/events/valencian-summer-school-in-machine-learning-2016
Kaggle Otto Challenge: How we achieved 85th out of 3,514 and what we learntEugene Yan Ziyou
Our team achieved 85th position out of 3,514 at the very popular Kaggle Otto Product Classification Challenge. Here's an overview of how we did it, as well as some techniques we learnt from fellow Kagglers during and after the competition.
by Szilard Pafka
Chief Scientist at Epoch
Szilard studied Physics in the 90s in Budapest and has obtained a PhD by using statistical methods to analyze the risk of financial portfolios. Next he has worked in finance quantifying and managing market risk. A decade ago he moved to California to become the Chief Scientist of a credit card processing company doing what now is called data science (data munging, analysis, modeling, visualization, machine learning etc). He is the founder/organizer of several data science meetups in Santa Monica, and he is also a visiting professor at CEU in Budapest, where he teaches data science in the Masters in Business Analytics program.
While extracting business value from data has been performed by practitioners for decades, the last several years have seen an unprecedented amount of hype in this field. This hype has created not only unrealistic expectations in results, but also glamour in the usage of the newest tools assumably capable of extraordinary feats. In this talk I will apply the much needed methods of critical thinking and quantitative measurements (that data scientists are supposed to use daily in solving problems for their companies) to assess the capabilities of the most widely used software tools for data science. I will discuss in details two such analyses, one concerning the size of datasets used for analytics and the other one regarding the performance of machine learning software used for supervised learning.
Open innovation is a powerful strategy to accelerate innovation. This is a case study of how the fastest growing start-up of Indonesia leveraged open innovation.
Need to spark some killer innovation into your product line? Thinking about holding a brainstorming session? Brainstorming sessions are for wusses and wusses don’t get the corner office. Instead, you’ll learn some more productive techniques that can help you to release your inner-Hulk and become that guy that everyone wants on their next-generation product.
Note that there are a lot of build slides and formatting that slideshare has rendered poorly. Feel free to download the deck for best results or connect with me and I'll send you a copy.
HackerEarth provides a comprehensive talent sourcing solution to source the best technical candidates in the industry. HackerEarth has a thriving community of developers who participate in online challenges and Hackathons.
Doing your first Kaggle (Python for Big Data sets)Domino Data Lab
You love python. You love Data Science. But the size of your data set keeps crashing your code. Is it time to bring in big data tools or simply code smarter? Lee is going to show you efficiency hacks, drawn from top Kaggle competitors, to get python to work on large data sets. Skip the hassle of creating a Big Data infrastructure. Let’s find out how far we can push our home laptop first.
Presented by Ted Xiao at RobotXSpace on 4/18/2017. This workshop covers the fundamentals of Natural Language Processing, crucial NLP approaches, and an overview of NLP in industry.
How hackathons can drive top line revenue growthHackerEarth
Innovation management overview
What is a hackathon?
Why hackathons?
Role of Hackathon in enterprise innovation
Leveraging hackathon-based innovation campaign for growth
Keys to conducting a successful hackathon
HackerEarth helping a startup hire developers - The Practo Case StudyHackerEarth
A startup's hiring requirement are probably the hardest ones to satisfy. Find out how Practo, a health case startup based out of India filled it's tech hiring requirement in record time using HackerEarth
Nick day, JGA Recruitment Payroll, Managing Director collaborated with HackerEarth and discussed actionable tips for recruiting & retaining best candidates in your talent pipeline.
How to assess & hire Java developers accurately?HackerEarth
The problem arises when you want to hire developers who have proven Java skills. How do you assess them with accuracy when you have no clue how Java works or have never worked in it?
The workshop will present how to combine tools to quickly query, transform and model data using command line tools.
The goal is to show that command line tools are efficient at handling reasonable sizes of data and can accelerate the data science
process. We will show that in many instances, command line processing ends up being much faster than ‘big-data’ solutions. The content
of the workshop is derived from the book of the same name (http://datascienceatthecommandline.com/). In addition, we will cover
vowpal-wabbit (https://github.com/JohnLangford/vowpal_wabbit) as a versatile command line tool for modeling large datasets.
Fairly Measuring Fairness In Machine LearningHJ van Veen
We look at a case and two research papers on measuring discrimination in machine learning models for extending credit. Presentation given as part of the Sao Paulo Machine Learning Meetup, theme "Ethics in Data Science".
this presentation is an introduction to R programming language.we will talk about usage, history, data structure and feathers of R programming language.
Many Machine Learning inference workloads compute predictions based on a limited number of models that are deployed together in the system. These models often share common structure and state. This scenario provides large rooms for optimizations of runtime and memory, which current systems fall short in exploring because they employ a black-box model of ML models and tasks, thus being unaware of optimization and sharing opportunities.
On the opposite side, Pretzel adopts a white-box description of ML models, which allows the framework to perform optimizations over deployed models and running tasks, saving memory and increasing the overall system performance. In this talk we will show the motivations behind Pretzel, its current design and possible future developments.
Surrogate modeling for industrial designShinwoo Jang
We describe GTApprox | a new tool for medium-scale surrogate modeling in industrial design. Compared to existing software, GTApprox brings several innovations: a few novel approximation algorithms, several advanced methods of automated model selection, novel options in the form of hints. We demonstrate the efficiency of GTApprox on a large collection of test problems. In addition, we describe several applications of GTApprox to real engineering problems.
With commits and releases, hundreds of tests are run on varying conditions (e.g., over different hardware and workloads) that can help to understand evolution and ensure non-regression of software
performance. We hypothesize that performance is not only sensitive to evolution of software, but also to different variability layers
of its execution environment, spanning the hardware, the operating system, the build, or the workload processed by the software.
Leveraging the MongoDB dataset, our results show that changes in
hardware and workload can drastically impact performance evolution and thus should be taken into account when reasoning about evolution. An open problem resulting from this study is how to manage the variability layers in order to efficiently test the performance
evolution of a software.
Sampling-Based Planning Algorithms for Multi-Objective MissionsMd Mahbubur Rahman
multiobjective path planning has Increasing demand in military missions, rescue operations, construction job-sites.
There is Lack of robotic path planning algorithm that compromises multiple
objectives. Commonly no solution that optimizes all the objective functions. Here we modify RRT, RRT* sampling based algorithm.
Week-3 – System RSupplemental material1Recap •.docxhelzerpatrina
Week-3 – System R
Supplemental material
1
Recap
• R - workhorse data structures
• Data frame
• List
• Matrix / Array
• Vector
• System-R – Input and output
• read() function
• read.table and read.csv
• scan() function
• typeof() function
• Setwd() function
• print()
• Factor variables
• Used in category analysis and statistical modelling
• Contains predefined set value called levels
• Descriptive statistics
• ls() – list of named objects
• str() – structure of the data and not the data itself
• summary() – provides a summary of data
• Plot() – Simple plot
2
Descriptive statistics - continued
• Summary of commands with single-value result. These commands will work on variables
containing numeric value.
• max() ---- It shows the maximum value in the vector
• min() ----- It shows the minimum value in the vector
• sum() ----- It shows the sum of all the vector elements.
• mean() ---- It shows the arithmetic mean for the entire vector
• median() – It shows the median value of the vector
• sd() – It shows the standard deviation
• var() – It show the variance
3
Descriptive statistics - single value results -
example
temp is the name of the vector
containing all numeric values
4
• log(dataset) – Shows log value for each
element.
• summary(dataset) –shows the summary
of values
• quantile() - Shows the quantiles by
default—the 0%, 25%, 50%, 75%, and
100% quantiles. It is possible to select
other quantiles also.
Descriptive statistics - multiple value results -
example
5
Descriptive Statistics in R for Data Frames
• Max(frame) – Returns the largest value in the entire data frame.
• Min(frame) – Returns the smallest value in the entire data frame.
• Sum(frame) – Returns the sum of the entire data frame.
• Fivenum(frame) – Returns the Tukey summary values for the entire
data frame.
• Length(frame)- Returns the number of columns in the data frame.
• Summary(frame) – Returns the summary for each column.
6
Descriptive Statistics in R for Data Frames -
Example
7
Descriptive Statistics in R for Data Frames –
RowMeans example
8
Descriptive Statistics in R for Data Frames –
ColMeans example
9
Graphical analysis - simple linear regression model
in R
• Logistic regression is implemented to understand if the dependent
variable is a linear function of the independent variable.
• Logistic regression is used for fitting the regression curve.
• Pre-requisite for implementing linear regression:
• Dependent variable should conform to normal distribution
• Cars dataset that is part of the R-Studio will be used as an example to
explain linear regression model.
10
Creating a simple linear model
• cars is a dataset preloaded into
System-R studio.
• head() function prints the first
few rows of the list/df
• cars dataset contains two major
columns
• X = speed (cars$speed)
• Y = dist (cars$dist)
• data() function is used to list all
the active datasets in the
environment.
• ...
Data Science at Scale on MPP databases - Use Cases & Open Source ToolsEsther Vasiete
Pivotal workshop slide deck for Structure Data 2016 held in San Francisco.
Abstract:
Learn how data scientists at Pivotal build machine learning models at massive scale on open source MPP databases like Greenplum and HAWQ (under Apache incubation) using in-database machine learning libraries like MADlib (under Apache incubation) and procedural languages like PL/Python and PL/R to take full advantage of the rich set of libraries in the open source community. This workshop will walk you through use cases in text analytics and image processing on MPP.
Automatic Task-based Code Generation for High Performance DSELJoel Falcou
Providing high level tools for parallel programming while sustaining a high level of performance has been a challenge that techniques like Domain Specific Embedded Languages try to solve. In previous works, we investigated the design of such a DSEL – NT2 – providing a Matlab -like syntax for parallel numerical computations inside a C++ library.
Main issues addressed here is how liimtaions of classical DSEL generation and multithreaded code generation can be overcome.
Accelerate your Kubernetes clusters with Varnish CachingThijs Feryn
A presentation about the usage and availability of Varnish on Kubernetes. This talk explores the capabilities of Varnish caching and shows how to use the Varnish Helm chart to deploy it to Kubernetes.
This presentation was delivered at K8SUG Singapore. See https://feryn.eu/presentations/accelerate-your-kubernetes-clusters-with-varnish-caching-k8sug-singapore-28-2024 for more details.
GDG Cloud Southlake #33: Boule & Rebala: Effective AppSec in SDLC using Deplo...James Anderson
Effective Application Security in Software Delivery lifecycle using Deployment Firewall and DBOM
The modern software delivery process (or the CI/CD process) includes many tools, distributed teams, open-source code, and cloud platforms. Constant focus on speed to release software to market, along with the traditional slow and manual security checks has caused gaps in continuous security as an important piece in the software supply chain. Today organizations feel more susceptible to external and internal cyber threats due to the vast attack surface in their applications supply chain and the lack of end-to-end governance and risk management.
The software team must secure its software delivery process to avoid vulnerability and security breaches. This needs to be achieved with existing tool chains and without extensive rework of the delivery processes. This talk will present strategies and techniques for providing visibility into the true risk of the existing vulnerabilities, preventing the introduction of security issues in the software, resolving vulnerabilities in production environments quickly, and capturing the deployment bill of materials (DBOM).
Speakers:
Bob Boule
Robert Boule is a technology enthusiast with PASSION for technology and making things work along with a knack for helping others understand how things work. He comes with around 20 years of solution engineering experience in application security, software continuous delivery, and SaaS platforms. He is known for his dynamic presentations in CI/CD and application security integrated in software delivery lifecycle.
Gopinath Rebala
Gopinath Rebala is the CTO of OpsMx, where he has overall responsibility for the machine learning and data processing architectures for Secure Software Delivery. Gopi also has a strong connection with our customers, leading design and architecture for strategic implementations. Gopi is a frequent speaker and well-known leader in continuous delivery and integrating security into software delivery.
UiPath Test Automation using UiPath Test Suite series, part 3DianaGray10
Welcome to UiPath Test Automation using UiPath Test Suite series part 3. In this session, we will cover desktop automation along with UI automation.
Topics covered:
UI automation Introduction,
UI automation Sample
Desktop automation flow
Pradeep Chinnala, Senior Consultant Automation Developer @WonderBotz and UiPath MVP
Deepak Rai, Automation Practice Lead, Boundaryless Group and UiPath MVP
Builder.ai Founder Sachin Dev Duggal's Strategic Approach to Create an Innova...Ramesh Iyer
In today's fast-changing business world, Companies that adapt and embrace new ideas often need help to keep up with the competition. However, fostering a culture of innovation takes much work. It takes vision, leadership and willingness to take risks in the right proportion. Sachin Dev Duggal, co-founder of Builder.ai, has perfected the art of this balance, creating a company culture where creativity and growth are nurtured at each stage.
JMeter webinar - integration with InfluxDB and GrafanaRTTS
Watch this recorded webinar about real-time monitoring of application performance. See how to integrate Apache JMeter, the open-source leader in performance testing, with InfluxDB, the open-source time-series database, and Grafana, the open-source analytics and visualization application.
In this webinar, we will review the benefits of leveraging InfluxDB and Grafana when executing load tests and demonstrate how these tools are used to visualize performance metrics.
Length: 30 minutes
Session Overview
-------------------------------------------
During this webinar, we will cover the following topics while demonstrating the integrations of JMeter, InfluxDB and Grafana:
- What out-of-the-box solutions are available for real-time monitoring JMeter tests?
- What are the benefits of integrating InfluxDB and Grafana into the load testing stack?
- Which features are provided by Grafana?
- Demonstration of InfluxDB and Grafana using a practice web application
To view the webinar recording, go to:
https://www.rttsweb.com/jmeter-integration-webinar
Transcript: Selling digital books in 2024: Insights from industry leaders - T...BookNet Canada
The publishing industry has been selling digital audiobooks and ebooks for over a decade and has found its groove. What’s changed? What has stayed the same? Where do we go from here? Join a group of leading sales peers from across the industry for a conversation about the lessons learned since the popularization of digital books, best practices, digital book supply chain management, and more.
Link to video recording: https://bnctechforum.ca/sessions/selling-digital-books-in-2024-insights-from-industry-leaders/
Presented by BookNet Canada on May 28, 2024, with support from the Department of Canadian Heritage.
Epistemic Interaction - tuning interfaces to provide information for AI supportAlan Dix
Paper presented at SYNERGY workshop at AVI 2024, Genoa, Italy. 3rd June 2024
https://alandix.com/academic/papers/synergy2024-epistemic/
As machine learning integrates deeper into human-computer interactions, the concept of epistemic interaction emerges, aiming to refine these interactions to enhance system adaptability. This approach encourages minor, intentional adjustments in user behaviour to enrich the data available for system learning. This paper introduces epistemic interaction within the context of human-system communication, illustrating how deliberate interaction design can improve system understanding and adaptation. Through concrete examples, we demonstrate the potential of epistemic interaction to significantly advance human-computer interaction by leveraging intuitive human communication strategies to inform system design and functionality, offering a novel pathway for enriching user-system engagements.
Key Trends Shaping the Future of Infrastructure.pdfCheryl Hung
Keynote at DIGIT West Expo, Glasgow on 29 May 2024.
Cheryl Hung, ochery.com
Sr Director, Infrastructure Ecosystem, Arm.
The key trends across hardware, cloud and open-source; exploring how these areas are likely to mature and develop over the short and long-term, and then considering how organisations can position themselves to adapt and thrive.
Kubernetes & AI - Beauty and the Beast !?! @KCD Istanbul 2024Tobias Schneck
As AI technology is pushing into IT I was wondering myself, as an “infrastructure container kubernetes guy”, how get this fancy AI technology get managed from an infrastructure operational view? Is it possible to apply our lovely cloud native principals as well? What benefit’s both technologies could bring to each other?
Let me take this questions and provide you a short journey through existing deployment models and use cases for AI software. On practical examples, we discuss what cloud/on-premise strategy we may need for applying it to our own infrastructure to get it to work from an enterprise perspective. I want to give an overview about infrastructure requirements and technologies, what could be beneficial or limiting your AI use cases in an enterprise environment. An interactive Demo will give you some insides, what approaches I got already working for real.
Software Delivery At the Speed of AI: Inflectra Invests In AI-Powered QualityInflectra
In this insightful webinar, Inflectra explores how artificial intelligence (AI) is transforming software development and testing. Discover how AI-powered tools are revolutionizing every stage of the software development lifecycle (SDLC), from design and prototyping to testing, deployment, and monitoring.
Learn about:
• The Future of Testing: How AI is shifting testing towards verification, analysis, and higher-level skills, while reducing repetitive tasks.
• Test Automation: How AI-powered test case generation, optimization, and self-healing tests are making testing more efficient and effective.
• Visual Testing: Explore the emerging capabilities of AI in visual testing and how it's set to revolutionize UI verification.
• Inflectra's AI Solutions: See demonstrations of Inflectra's cutting-edge AI tools like the ChatGPT plugin and Azure Open AI platform, designed to streamline your testing process.
Whether you're a developer, tester, or QA professional, this webinar will give you valuable insights into how AI is shaping the future of software delivery.
Smart TV Buyer Insights Survey 2024 by 91mobiles.pdf91mobiles
91mobiles recently conducted a Smart TV Buyer Insights Survey in which we asked over 3,000 respondents about the TV they own, aspects they look at on a new TV, and their TV buying preferences.
Neuro-symbolic is not enough, we need neuro-*semantic*Frank van Harmelen
Neuro-symbolic (NeSy) AI is on the rise. However, simply machine learning on just any symbolic structure is not sufficient to really harvest the gains of NeSy. These will only be gained when the symbolic structures have an actual semantics. I give an operational definition of semantics as “predictable inference”.
All of this illustrated with link prediction over knowledge graphs, but the argument is general.
2. Today’s agenda:
1. What is DataRobot?
a. A Boston-based software company
b. A massively parallel modeling engine
c. An R package (today’s focus)
2. An example to demonstrate the R package:
a. Predicting compressive strength of concrete
b. Shows typical DataRobot modeling project
c. Demonstrates partial dependence plots
3. What is DataRobot?
1: Boston-based software company
2: Massively parallel modeling engine
- On multiple hardware platforms
- Under various operating systems
- Has many software components:
- R
- Python
- … and various others
API server
3: R API client -
the DataRobot
R package
4.
5. A few key details:
➢ Package in the final stages of internal testing
➢ Will be released via R-Forge under the MIT license
➢ Two vignettes are available with the package:
■ “Introduction to the DataRobot R package”
■ “Interpreting Predictive Models, from Linear Regression to
Machine Learning Ensembles”
6. Today’s predictive modeling example:
● Objective: predict the compressive strength of concrete
● Data source: ConcreteFrame
● Each record describes one laboratory concrete sample
● Target variable: Strength
● Prediction variables: Age + 7 composition variables
7. Creating the DataRobot modeling project
1. Upload the modeling dataframe:
> MyDRProject <- SetupProject(ConcreteFrame,"ConcreteProject")
2. Specify the target variable to be predicted and start building models:
> StartAutopilot(Target="Strength", Project = MyDRProject)
3. Add a custom R model to the project:
> CreateCustomModel(MyDRProject, LogAgeFit, LogAgePredict, “R:LinearWithLogAge”)
4. Retrieve the leaderboard summarizing all project models:
> ConcreteLeaderboard <- GetAllModels(MyDRProject)
8. Function arguments for CreateCustomModel
LogAgeFit <- function(response, data, extras=NULL){
#
DF <- cbind.data.frame(data,
CustomModelResponseY = response)
model <- lm(CustomModelResponseY ~ . - Age +
log(Age), data = DF)
return(model)
}
LogAgePredict <- function(model,data){
predictions <- predict(model, newdata = data)
return(predictions)
}
Model fitting function
Prediction function
11. Understanding complicated models
● Linear regression models - easily explained via coefficients
● Not true for random forests, boosted trees, SVMs, etc.
● Alternative: partial dependence plots (Friedman 2001)
○ To assess dependence on xj
, average the predictions over all other covariates
○ Compute this average for a representative range of xj
values and plot
○ Linear model: plot is straight line with slope equal to coefficient of xj
14. Importance from permutations: large RMSE increase => important variable
Large average Age shift
Even larger Age shift for ENET Blender
15. Summary of the concrete strength example
● Best model = ENET Blender
○ Age dependence shows nonlinear hard saturation behavior
○ Water dependence is nonlinear and non-monotonic
● Combining with variable importance results:
○ Average measures: Age > Cement > Blast Furnace Slag > Water
○ ENET Blender measures: Age > Water > Cement > Blast Furnace Slag
● Best model captures Age saturation behavior and nonmonotonic
Water dependence that other models can’t
18. Ronald K. Pearson | Data Scientist @DataRobot | ron@datarobot.com
Slides available at: bit.ly/UseR2015
Vignette - Intro to DataRobot: bit.ly/1dzgppC
Vignette - Two Applications: bit.ly/1KtWCGI
Want to use the DataRobot
R package?
Email us at:
useR2015@datarobot.com