Download as PDF, PPTX
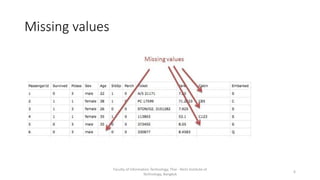
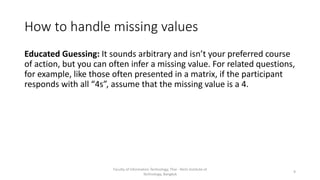
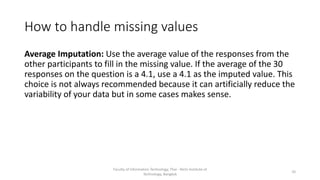
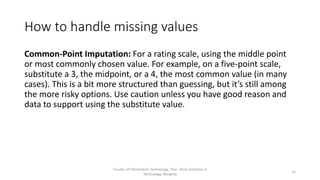
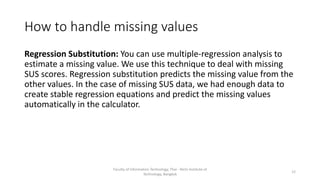
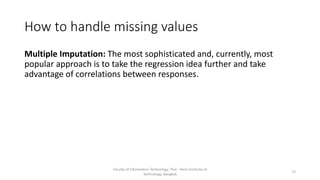

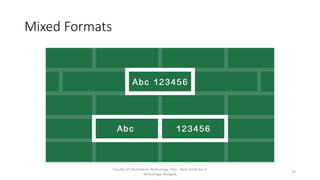
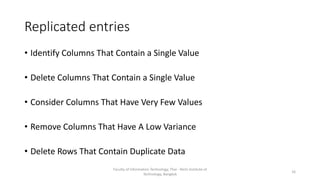
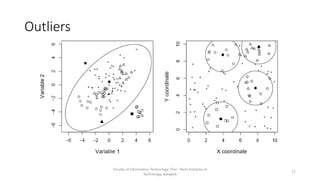
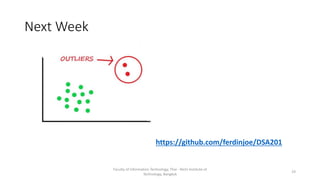

This document discusses data cleaning and handling dirty data. It introduces common data issues like missing values, typos, mixed formats, replicated entries, outliers, and violations of business rules. It then focuses on handling missing values and describes several techniques: listwise deletion, recovering values, educated guessing, average imputation, common-point imputation, regression substitution, and multiple imputation. The document also briefly mentions addressing typos, mixed formats, and replicated entries before assigning an activity to use pandas on CSV files to perform data cleaning.


![[DSC Europe 25] Ekaterina Bubenko - Behind the Curtain: How Data Roles Collab...](https://cdn.slidesharecdn.com/ss_thumbnails/anmv6x8dstqbbzchoklr-ekaterina-bubenko-behind-the-curtain-how-data-roles-collaborate-in-the-ai-era-a-260123083019-4b252ec7-thumbnail.jpg?width=640&height=640&fit=bounds)


![[DSC Europe 25] Predrag Maletic - Scaling AI in Banking – Our Strategic Journ...](https://cdn.slidesharecdn.com/ss_thumbnails/qu2onv0aruwlvqtygmxx-predrag-maletic-scaling-ai-in-banking-260123083019-6cf1da1d-thumbnail.jpg?width=640&height=640&fit=bounds)


