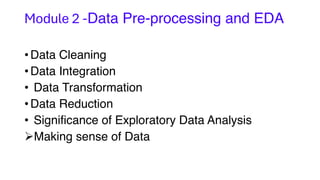
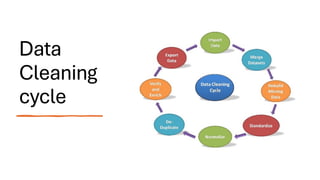
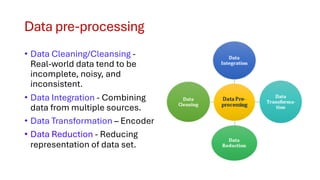
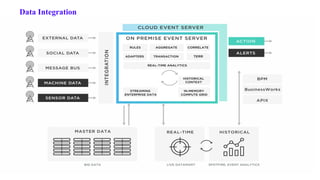
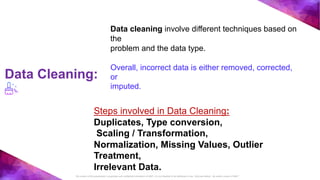
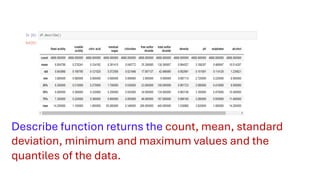
The document covers module 2 on data pre-processing and exploratory data analysis (EDA), emphasizing data cleaning, integration, transformation, and reduction. It details techniques for handling real-world data issues such as incompleteness and inconsistency, with specific steps for cleaning data and managing missing values using Python and pandas. The content is proprietary and confidential, intended for internal use with restrictions on distribution.
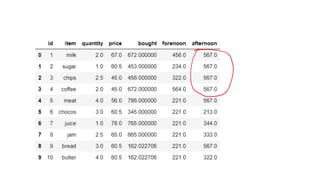
![# replacing missing values in quantity
# column with mean of that column
data['quantity'] = data['quantity'].fillna(data['quantity'].mean())
# replacing missing values in price column
# with median of that column
data['price'] = data['price'].fillna(data['price'].median())
# replacing missing values in bought column with
# standard deviation of that column
data['bought'] = data['bought'].fillna(data['bought'].std())
# replacing missing values in forenoon column with
# minimum number of that column
data['forenoon'] = data['forenoon'].fillna(data['forenoon'].min())
# replacing missing values in afternoon column with
# maximum number of that column
data['afternoon'] = data['afternoon'].fillna(data['afternoon'].max())
print(Data)](https://image.slidesharecdn.com/4-module2datacleaningreductionandtransformation-01-02-2024-240226070338-2c2825f2/85/Data-cleaning-reduction-and-transformation-pdf-20-320.jpg)