This document provides information on data screening, including checking for incorrectly entered data, missing values, outliers, and normality. It discusses the purpose of screening data and outlines steps to identify issues like out-of-range values or missing data using SPSS frequencies analysis. Common challenges with missing data like reduced sample size are described. Options for handling missing values including listwise deletion, pairwise deletion, case deletion, and imputation methods are presented. The document also briefly defines outliers and questions whether they should be checked for due to concerns about arbitrarily removing valid data points.
SPSS GuideAssessing Normality, Handling Missing Data, and Calculating Scores...ahmedragab433449
"This comprehensive SPSS guide covers essential topics in data analysis and statistical research. Key contents include:
Missing Data: Understanding and handling data gaps (Page 2)
Assessing Normality: Why and how to check normality in data sets (Page 6)
Interpretation of Output: A guide to exploring and interpreting SPSS outputs (Page 8)
Skewness and Kurtosis: Insights into data distribution (Page 11)
Kolmogorov-Smirnov and Shapiro-Wilk Tests: Testing for normality (Page 14)
Manipulating Data: Techniques and strategies for data manipulation (Page 25)
Calculating Total Scores and Reversing Negative Worded Items: SPSS guidance (Page 26)
Ideal for students, educators, researchers, and professionals in data analysis and statistics."
SPSS GuideAssessing Normality, Handling Missing Data, and Calculating Total S...ahmedragab433449
"This comprehensive SPSS guide covers essential topics in data analysis and statistical research. Key contents include:
Missing Data: Understanding and handling data gaps (Page 2)
Assessing Normality: Why and how to check normality in data sets (Page 6)
Interpretation of Output: A guide to exploring and interpreting SPSS outputs (Page 8)
Skewness and Kurtosis: Insights into data distribution (Page 11)
Kolmogorov-Smirnov and Shapiro-Wilk Tests: Testing for normality (Page 14)
Manipulating Data: Techniques and strategies for data manipulation (Page 25)
Calculating Total Scores and Reversing Negative Worded Items: SPSS guidance (Page 26)
Ideal for students, educators, researchers, and professionals in data analysis and statistics."
This document provides guidance on analyzing data using SPSS. It covers topics such as different data types, structuring data for analysis in SPSS, descriptive statistics, graphs, inferential statistics, and specific tests like t-tests, ANOVA, and correlation. The document is intended as a practical guide for researchers who need to analyze their data using SPSS. It defines key terms and provides examples to illustrate different statistical concepts and analysis procedures.
This document provides guidance on analysing data using SPSS. It discusses key considerations for determining the appropriate analysis method, including the type of data (nominal, ordinal, interval, ratio), whether the data is paired, whether it is parametric, and what is being examined (differences, correlations, etc.). It covers descriptive statistics, inferential statistics, and specific tests like t-tests, ANOVA, correlation, and chi-square. Examples are provided to illustrate different analysis techniques for various research study designs.
This document discusses several methods for preparing data before analysis, including handling outliers, missing data, duplicated data, and heterogeneous data formats. For outliers, it describes techniques like trimming, winsorizing, and changing regression models. For missing data, it covers identifying patterns, assessing causes, and handling techniques like listwise deletion, imputation, and multiple imputations. It also addresses detecting and removing duplicate records based on field similarities, as well as standardizing heterogeneous data formats.
The document describes conducting a factor analysis on SPSS to measure different aspects of student anxiety towards learning SPSS. A 23-item questionnaire was administered to over 2,500 students. Initial analysis of the correlation matrix found no issues with multicollinearity. The document then provides instructions for running the factor analysis in SPSS, including extracting factors, rotating the factors, and interpreting the output.
1. F A Using S P S S1 (Saq.Sav) Q Ti AZoha Qureshi
The document describes conducting a factor analysis on SPSS to measure different aspects of student anxiety towards learning SPSS. A 23-item questionnaire was administered to over 2,500 students. Initial analysis of the correlation matrix found no issues with multicollinearity. The document then provides instructions for running the factor analysis in SPSS, including extracting factors, rotating the factors, and interpreting the output.
This document provides instructions for conducting a factor analysis in SPSS. It describes screening the data by examining correlations between variables to identify any that do not correlate well. It recommends having a sample size over 300 and communalities above 0.5. The analysis is run using principal component analysis. Factors are extracted based on eigenvalues over 1 or a fixed number. An orthogonal rotation like varimax is typically used to improve interpretability of the factors. Factor scores can optionally be saved.
This document discusses various methods for handling missing data in longitudinal studies, including complete case analysis, last observation carried forward, mean imputation, hot-deck imputation, estimation maximization, and multiple imputation. It notes the advantages and disadvantages of each method, such as how they preserve or don't preserve relationships between variables and can introduce bias. Multiple imputation is presented as the preferred approach as it accounts for uncertainty in imputed values.
The document provides an overview of steps for analyzing survey data, including editing and coding data, inputting data into software, conducting basic analyses like frequency distributions and cross-tabulations, testing hypotheses, and higher-order analyses like correlation and regression if needed. It outlines learning objectives related to writing code sheets, interpreting frequency distributions, computing means and proportions, performing statistical tests, analyzing cross-tabulations, and conducting correlation and regression. It also lists readings to complete on topics like data editing, frequency distributions, means, proportions, cross-tabulations, correlation, and regression.
A Two-Step Self-Evaluation Algorithm On Imputation Approaches For Missing Cat...CSCJournals
Missing data are often encountered in data sets and a common problem for researchers in different fields of research. There are many reasons why observations may have missing values. For instance, some respondents may not report some of the items for some reason. The existence of missing data brings difficulties to the conduct of statistical analyses, especially when there is a large fraction of data which are missing. Many methods have been developed for dealing with missing data, numeric or categorical. The performances of imputation methods on missing data are key in choosing which imputation method to use. They are usually evaluated on how the missing data method performs for inference about target parameters based on a statistical model. One important parameter is the expected imputation accuracy rate, which, however, relies heavily on the assumptions of missing data type and the imputation methods. For instance, it may require that the missing data is missing completely at random. The goal of the current study was to develop a two-step algorithm to evaluate the performances of imputation methods for missing categorical data. The evaluation is based on the re-imputation accuracy rate (RIAR) introduced in the current work. A simulation study based on real data is conducted to demonstrate how the evaluation algorithm works.
2016 Symposium Poster - statistics - FinalBrian Lin
This document discusses common pitfalls in statistical analysis and provides examples to illustrate typical mistakes. It notes that statistical significance does not always imply practical significance. Even with the same means and variances, different datasets can have very different distributions. Correlation does not necessarily indicate causation. Qualitative scales should not always be treated as quantitative variables. Choosing the appropriate statistical test is important to get the right results. Sample size calculations depend on study details and objectives. Involving statisticians early in the research process helps ensure proper experimental design and analysis.
This document summarizes key concepts from an introduction to statistics textbook. It covers types of data (quantitative, qualitative, levels of measurement), sampling (population, sample, randomization), experimental design (observational studies, experiments, controlling variables), and potential misuses of statistics (bad samples, misleading graphs, distorted percentages). The goal is to illustrate how common sense is needed to properly interpret data and statistics.
This document discusses analyzing data collected from an action research study. It begins by noting that data collection is optional and the researcher may be satisfied without further analysis. If analysis is desired, the document recommends breaking it into manageable pieces to produce robust results. It then discusses different types of quantitative data like numerical, ordinal, and nominal data and the appropriate statistical analyses for each. The rest of the document provides an example of analyzing survey data from a study on classroom culture using SPSS, including checking reliability and exploring factor analysis.
Data science notes for ASDS calicut 2.pptxswapnaraghav
Data science involves both statistics and practical hacking skills. It is the engineering of data - applying tools and theoretical understanding to data in a practical way. Statistical modeling is the process of using mathematical models to analyze and understand data in order to make general predictions. There are several statistical modeling techniques including linear regression, classification, resampling, non-linear models, tree-based methods, and neural networks. Unsupervised learning identifies patterns in data without pre-existing categories by techniques like clustering. Time series forecasting predicts future values based on patterns in historical time series data.
Statistics What you Need to KnowIntroductionOften, when peop.docxdessiechisomjj4
Statistics: What you Need to Know
Introduction
Often, when people begin a statistics course, they worry about doing advanced mathematics or their math phobias kick in. Understanding that statistics as addressed in this course is not a math course at all is important. The only math you will do is addition, subtraction, multiplication, and division. In these days of computer capability, you generally don't even have to do that much, since Excel is set up to do basic statistics for you. The key elements for the student in this course is to understand the various types of statistics, what their requirements are, what they do, and how you can use and interpret the results. Referring back to the basic components of a valid research study, which statistic a researcher uses depends on several things:
The research question itself
The sample size
The type of data you have collected
The type of statistic called for by the design
All quantitative studies require a data set. Qualitative studies may use a data set or may use observations with no numerical data at all. For the purposes of the next modules, our focus will be on quantitative studies.
Types of Statistics
There are several types of statistics available to the researcher. Descriptive statistics provide a basic description of the data set. This includes the measures of central tendency: means, medians, and modes, and the measures of dispersion, including variances and standard deviations. Descriptive statistics also include the sample size, or "N", and the frequency with which each data point occurs in the data set.
Inferential statistics allow the researcher to make predictions, estimations, and generalizations about the data set, the sample, and the population from which the sample was drawn. They allow you to draw inferences, generalizations, and possibilities regarding the relationship between the independent variable and the dependent variable to indicate how those inferences answer the research question. Researchers can make predictions and estimations about how the results will fit the overall population. Statistics can also be described in terms of the types of data they can analyze. Non-parametric statistics can be used with nominal or ordinal data, while parametric statistics can be used with interval and ratio data types.
Types of Data
There are four types of data that a researcher may collect.
Nominal Data Sets
The Nominal data set includes simple classifications of data into categories which are all of equal weight and value. Examples of categories that are equal to each other include gender (male, female), state of birth (Arizona, Wyoming, etc.), membership in a group (yes, no). Each of these categories is equivalent to the other, without value judgments.
Ordinal Data Sets
Ordinal data sets also have data classified into categories, but these categories have some form or order or ranking attached, often of some sort of value / val.
This document provides instructions for answering questions about a dataset examining differences in client functioning (GAF) and satisfaction (Satisfaction) between public and private mental health agencies. The researcher wants to know if type of agency (independent variable) is related to GAF and Satisfaction scores (dependent variables). The assistant screened the data, found some missing values and outliers, and determined one variable violated the normality assumption.
This document defines and provides examples of different types of data:
- Discrete and categorical data can be counted and sorted into categories.
- Nominal data involves assigning codes to values. Ordinal data allows values to be ranked.
- Interval and continuous data can be measured and ordered on a scale.
- Frequency tables, pie charts, bar charts, dot plots and histograms are used to summarize different types of data. Outliers, symmetry, skewness and scatter plots are also discussed.
This document provides information on using SPSS for educational research. It discusses descriptive statistics, common statistical issues in research, procedures for creating a SPSS data file and conducting descriptive analyses. It also explains how to perform t-tests, analysis of variance (ANOVA), frequencies analysis and other statistical tests in SPSS. The document is intended as a guide for researchers on applying various statistical analyses in SPSS.
Research Method for Business chapter 11-12-14Mazhar Poohlah
This document provides guidance on determining appropriate sample sizes based on population size. It states that for populations under 100, the entire population should be surveyed. For populations around 500, a sample size of 50% is recommended, while for populations around 1,500, a sample size of 20% is recommended. Beyond a population of 5,000, a sample size of 400 may be adequate regardless of total population size. The document also provides a table comparing strengths and weaknesses of different sampling techniques, including probability and non-probability methods.
This document discusses various statistical concepts including outliers, transforming data, normalizing data, weighting data, robustness, and homoscedasticity and heteroscedasticity. Outliers are values far from other data points and should be carefully examined before removing. Data can be transformed using logarithms, square roots, or other functions to better fit a normal distribution or equalize variances between groups. Normalizing data puts variables on comparable scales. Weighting data adjusts for under- or over-representation in samples. Robust tests are resistant to violations of assumptions. Homoscedasticity refers to equal variances between groups while heteroscedasticity refers to unequal variances.
The document summarizes key concepts from Chapter 1 of the textbook "Elementary Statistics" including:
- The difference between a population and a sample, and how statistics uses samples to make inferences about populations.
- The different types of data: quantitative, categorical, discrete vs. continuous data.
- The different levels of measurement for data: nominal, ordinal, interval, and ratio.
- The importance of critical thinking when analyzing data and statistics, including considering context, sources, sampling methods, and avoiding misleading graphs, samples, conclusions, or survey questions.
This document provides an overview of key concepts from Chapter 1 of the textbook "Elementary Statistics". It defines important statistical terms like population, sample, parameter, and statistic. It also distinguishes between different types of data and levels of measurement. Additionally, it discusses the importance of collecting sample data through appropriate random sampling methods. Critical thinking in statistics is emphasized, highlighting factors like the context, source, and sampling method of data when evaluating statistical claims. Different ways of collecting data through studies and experiments are also introduced.
Data Science - Part III - EDA & Model SelectionDerek Kane
This lecture introduces the concept of EDA, understanding, and working with data for machine learning and predictive analysis. The lecture is designed for anyone who wants to understand how to work with data and does not get into the mathematics. We will discuss how to utilize summary statistics, diagnostic plots, data transformations, variable selection techniques including principal component analysis, and finally get into the concept of model selection.
This document provides an overview of key concepts related to data in biology including:
1. Qualitative and quantitative data types. Qualitative data relates to characteristics or descriptions while quantitative data uses numerical scales.
2. Methods for displaying and analyzing data including graphs, measures of central tendency (mean, median, mode), and standard deviation.
3. Statistical hypothesis testing using t-tests to compare two samples and determine if differences are statistically significant.
4. Correlation and scatter plots which show the relationship between two variables but do not prove causation.
The document discusses descriptive statistics which are used to describe basic features of data through simple summaries. It covers univariate analysis which examines one variable at a time through its distribution, measures of central tendency (mean, median, mode), and measures of dispersion (range, standard deviation). Frequency distributions and histograms are presented as ways to describe a variable's distribution.
Leveraging Generative AI to Drive Nonprofit InnovationTechSoup
In this webinar, participants learned how to utilize Generative AI to streamline operations and elevate member engagement. Amazon Web Service experts provided a customer specific use cases and dived into low/no-code tools that are quick and easy to deploy through Amazon Web Service (AWS.)
How to Manage Your Lost Opportunities in Odoo 17 CRMCeline George
Odoo 17 CRM allows us to track why we lose sales opportunities with "Lost Reasons." This helps analyze our sales process and identify areas for improvement. Here's how to configure lost reasons in Odoo 17 CRM
Strategies for Effective Upskilling is a presentation by Chinwendu Peace in a Your Skill Boost Masterclass organisation by the Excellence Foundation for South Sudan on 08th and 09th June 2024 from 1 PM to 3 PM on each day.
ISO/IEC 27001, ISO/IEC 42001, and GDPR: Best Practices for Implementation and...PECB
Denis is a dynamic and results-driven Chief Information Officer (CIO) with a distinguished career spanning information systems analysis and technical project management. With a proven track record of spearheading the design and delivery of cutting-edge Information Management solutions, he has consistently elevated business operations, streamlined reporting functions, and maximized process efficiency.
Certified as an ISO/IEC 27001: Information Security Management Systems (ISMS) Lead Implementer, Data Protection Officer, and Cyber Risks Analyst, Denis brings a heightened focus on data security, privacy, and cyber resilience to every endeavor.
His expertise extends across a diverse spectrum of reporting, database, and web development applications, underpinned by an exceptional grasp of data storage and virtualization technologies. His proficiency in application testing, database administration, and data cleansing ensures seamless execution of complex projects.
What sets Denis apart is his comprehensive understanding of Business and Systems Analysis technologies, honed through involvement in all phases of the Software Development Lifecycle (SDLC). From meticulous requirements gathering to precise analysis, innovative design, rigorous development, thorough testing, and successful implementation, he has consistently delivered exceptional results.
Throughout his career, he has taken on multifaceted roles, from leading technical project management teams to owning solutions that drive operational excellence. His conscientious and proactive approach is unwavering, whether he is working independently or collaboratively within a team. His ability to connect with colleagues on a personal level underscores his commitment to fostering a harmonious and productive workplace environment.
Date: May 29, 2024
Tags: Information Security, ISO/IEC 27001, ISO/IEC 42001, Artificial Intelligence, GDPR
-------------------------------------------------------------------------------
Find out more about ISO training and certification services
Training: ISO/IEC 27001 Information Security Management System - EN | PECB
ISO/IEC 42001 Artificial Intelligence Management System - EN | PECB
General Data Protection Regulation (GDPR) - Training Courses - EN | PECB
Webinars: https://pecb.com/webinars
Article: https://pecb.com/article
-------------------------------------------------------------------------------
For more information about PECB:
Website: https://pecb.com/
LinkedIn: https://www.linkedin.com/company/pecb/
Facebook: https://www.facebook.com/PECBInternational/
Slideshare: http://www.slideshare.net/PECBCERTIFICATION
Walmart Business+ and Spark Good for Nonprofits.pdfTechSoup
"Learn about all the ways Walmart supports nonprofit organizations.
You will hear from Liz Willett, the Head of Nonprofits, and hear about what Walmart is doing to help nonprofits, including Walmart Business and Spark Good. Walmart Business+ is a new offer for nonprofits that offers discounts and also streamlines nonprofits order and expense tracking, saving time and money.
The webinar may also give some examples on how nonprofits can best leverage Walmart Business+.
The event will cover the following::
Walmart Business + (https://business.walmart.com/plus) is a new shopping experience for nonprofits, schools, and local business customers that connects an exclusive online shopping experience to stores. Benefits include free delivery and shipping, a 'Spend Analytics” feature, special discounts, deals and tax-exempt shopping.
Special TechSoup offer for a free 180 days membership, and up to $150 in discounts on eligible orders.
Spark Good (walmart.com/sparkgood) is a charitable platform that enables nonprofits to receive donations directly from customers and associates.
Answers about how you can do more with Walmart!"
A workshop hosted by the South African Journal of Science aimed at postgraduate students and early career researchers with little or no experience in writing and publishing journal articles.
This presentation includes basic of PCOS their pathology and treatment and also Ayurveda correlation of PCOS and Ayurvedic line of treatment mentioned in classics.
Beyond Degrees - Empowering the Workforce in the Context of Skills-First.pptxEduSkills OECD
Iván Bornacelly, Policy Analyst at the OECD Centre for Skills, OECD, presents at the webinar 'Tackling job market gaps with a skills-first approach' on 12 June 2024
Main Java[All of the Base Concepts}.docxadhitya5119
This is part 1 of my Java Learning Journey. This Contains Custom methods, classes, constructors, packages, multithreading , try- catch block, finally block and more.
How to Fix the Import Error in the Odoo 17Celine George
An import error occurs when a program fails to import a module or library, disrupting its execution. In languages like Python, this issue arises when the specified module cannot be found or accessed, hindering the program's functionality. Resolving import errors is crucial for maintaining smooth software operation and uninterrupted development processes.
This presentation was provided by Steph Pollock of The American Psychological Association’s Journals Program, and Damita Snow, of The American Society of Civil Engineers (ASCE), for the initial session of NISO's 2024 Training Series "DEIA in the Scholarly Landscape." Session One: 'Setting Expectations: a DEIA Primer,' was held June 6, 2024.
Pollock and Snow "DEIA in the Scholarly Landscape, Session One: Setting Expec...
data Sreening.doc
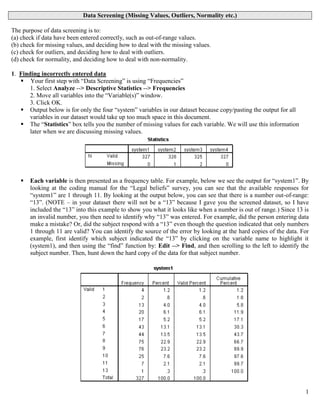
1. 1
Data Screening (Missing Values, Outliers, Normality etc.)
The purpose of data screening is to:
(a) check if data have been entered correctly, such as out-of-range values.
(b) check for missing values, and deciding how to deal with the missing values.
(c) check for outliers, and deciding how to deal with outliers.
(d) check for normality, and deciding how to deal with non-normality.
1. Finding incorrectly entered data
Your first step with “Data Screening” is using “Frequencies”
1. Select Analyze --> Descriptive Statistics --> Frequencies
2. Move all variables into the “Variable(s)” window.
3. Click OK.
Output below is for only the four “system” variables in our dataset because copy/pasting the output for all
variables in our dataset would take up too much space in this document.
The “Statistics” box tells you the number of missing values for each variable. We will use this information
later when we are discussing missing values.
Each variable is then presented as a frequency table. For example, below we see the output for “system1”. By
looking at the coding manual for the “Legal beliefs” survey, you can see that the available responses for
“system1” are 1 through 11. By looking at the output below, you can see that there is a number out-of-range:
“13”. (NOTE – in your dataset there will not be a “13” because I gave you the screened dataset, so I have
included the “13” into this example to show you what it looks like when a number is out of range.) Since 13 is
an invalid number, you then need to identify why “13” was entered. For example, did the person entering data
make a mistake? Or, did the subject respond with a “13” even though the question indicated that only numbers
1 through 11 are valid? You can identify the source of the error by looking at the hard copies of the data. For
example, first identify which subject indicated the “13” by clicking on the variable name to highlight it
(system1), and then using the “find” function by: Edit --> Find, and then scrolling to the left to identify the
subject number. Then, hunt down the hard copy of the data for that subject number.
2. 2
2. Missing Values
Why do missing values occur? Missing values are either random or non-random. Random missing values may
occur because the subject inadvertently did not answer some questions. For example, the study may be overly
complex and/or long, or the subject may be tired and/or not paying attention, and miss the question. Random
missing values may also occur through data entry mistakes. Non-random missing values may occur because
the subject purposefully did not answer some questions. For example, the question may be confusing, so many
subjects do not answer the question. Also, the question may not provide appropriate answer choices, such as
“no opinion” or “not applicable”, so the subject chooses not to answer the question. Also, subjects may be
reluctant to answer some questions because of social desirability concerns about the content of the question,
such as questions about sensitive topics like past crimes, sexual history, prejudice or bias toward certain
groups, and etc.
Why is missing data a problem? Missing values means reduced sample size and loss of data. You conduct
research to measure empirical reality so missing values thwart the purpose of research. Missing values may
also indicate bias in the data. If the missing values are non-random, then the study is not accurately measuring
the intended constructs. The results of your study may have been different if the missing data was not missing.
How do I identify missing values?
1. Select Analyze --> Descriptive Statistics --> Frequencies
2. Move all variables into the “Variable(s)” window.
3. Click OK.
Output below is for only the four “system” variables in our dataset because copy/pasting the output for all
variables in our dataset would take up too much space in this document.
The “Statistics” box tells you the number of missing values for each variable.
How do I deal with missing values? Irrespective of whether the missing values are random or non-random,
you have three options when dealing with missing values.
Option 1 is to do nothing. Leave the data as is, with the missing values in place. This is the most frequent
approach, for a few reasons. First, missing values are typically small. Second, missing values are typically
non-random. Third, even if there are a few missing values on individual items, you typically create composites
of the items by averaging them together into one new variable, and this composite variable will not have
missing values because it is an average of the existing data. However, if you chose this option, you must keep
in mind how SPSS will treat the missing values. SPSS will either use “listwise deletion” or “pairwise deletion”
of the missing values. You can elect either one when conducting each test in SPSS.
a. Listwise deletion – SPSS will not include cases (subjects) that have missing values on the variable(s)
under analysis. If you are only analyzing one variable, then listwise deletion is simply analyzing the
existing data. If you are analyzing multiple variables, then listwise deletion removes cases (subjects) if
there is a missing value on any of the variables. The disadvantage is a loss of data because you are
removing all data from subjects who may have answered some of the questions, but not others (e.g.,
the missing data).
b. Pairwise deletion – SPSS will include all available data. Unlike listwise deletion which removes cases
(subjects) that have missing values on any of the variables under analysis, pairwise deletion only
removes the specific missing values from the analysis (not the entire case). In other words, all available
data is included. For example, if you are conducting a correlation on multiple variables, then SPSS will
conduct the bivariate correlation between all available data point, and ignore only those missing values
if they exist on some variables. In this case, pairwise deletion will result in different sample sizes for
each correlation. Pairwise deletion is useful when sample size is small or missing values are large
because there are not many values to begin with, so why omit even more with listwise deletion.
3. 3
c. In other to better understand how listwise deletion versus pairwise deletion influences your results, try
conducting the same test using both deletion methods. Does the outcome change?
.
Option 2 is to delete cases with missing values. For example, for every missing value in the dataset, you can
delete the subjects with the missing values. Thus, you are left with complete data for all subjects. The
disadvantage to this approach is you reduce the sample size of your data. If you have a large dataset, then it
may not be a big disadvantage because you have enough subjects even after you delete the cases with missing
values. Another disadvantage to this approach is that the subjects with missing values may be different than
the subjects without missing values (e.g., missing values that are non-random), so you have a non-
representative sample after removing the cases with missing values. Once situation in which I use Option 2 is
when particular subjects have not answered an entire scale or page of the study.
Option 3 is to replace the missing values, called imputation. There is little agreement about whether or not to
conduct imputation. There is some agreement, however, in which type of imputation to conduct. For example,
you typically do NOT conduct Mean substitution or Regression substitution. Mean substitution is replacing
the missing value with the mean of the variable. Regression substitution uses regression analysis to replace the
missing value. Regression analysis is designed to predict one variable based upon another variable, so it can
be used to predict the missing value based upon the subject’s answer to another variable. Both Mean
substitution and Regression substitution can be found using: Transform --> Replace Missing Cases. The
favored type of imputation is replacing the missing values using different estimation methods. The “Missing
Values Analysis” add-on contains the estimation methods, but versions of SPSS without the add-on module do
not. The estimation methods be found by using: Transform --> Replace Missing Cases.
3. Outliers –
What are outliers? Outliers are extreme values as compared to the rest of the data. The determination of values
as “outliers” is subjective. While there are a few benchmarks for determining whether a value is an “outlier”,
those benchmarks are arbitrarily chosen, similar to how “p<.05” is also arbitrarily chosen.
Should I check for outliers? Outliers can render your data non-normal. Since normality is one of the
assumptions for many of the statistical tests you will conduct, finding and eliminating the influence of outliers
may render your data normal, and thus render your data appropriate for analysis using those statistical tests.
However, I know no one who checks for outliers. For example, just because a value is extreme compared to
the rest of the data does not necessarily mean it is somehow an anomaly, or invalid, or should be removed.
The subject chose to respond with that value, so removing that value is arbitrarily throwing away data simply
because it does not fit this “assumption” that data should be “normal”. Conducting research is about
discovering empirical reality. If the subject chose to respond with that value, then that data is a reflection of
reality, so removing the “outlier” is the antithesis of why you conduct research.
There is one more (less theoretical, and more practical) reason why I know no one who conducts outlier
analysis. It is common practice to use multiple questions to measure constructs because it increases the power
of your statistical analysis. You typically create a “composite” score (average of all the questions) when
analyzing your data. For example, in a study about happiness, you may use an established happiness scale, or
create your own happiness questions that measure all the facets of the happiness construct. When analyzing
your data, you average together all the happiness questions into 1 happiness composite measure. While there
may be some outliers in each individual question, averaged the items together reduces the probability of
outliers due to the increased amount of data composited into the variable.
Checking outliers:
1. Select Analyze --> Descriptive Statistics --> Explore
2. Move all variables into the “Variable(s)” window.
3. Click “Statistics”, and click “Outliers”
4. Click “Plots”, and unclick “Stem-and-leaf”
5. Click OK.
Output on next page is for “system1”
4. 4
“Descriptives” box tells you descriptive statistics about the variable, including the value of Skewness and
Kurtosis, with accompanying standard error for each. This information will be useful later when we talk about
“normality”. The “5% Trimmed Mean” indicates the mean value after removing the top and bottom 5% of
scores. By comparing this “5% Trimmed Mean” to the “mean”, you can identify if extreme scores (such as
outliers that would be removed when trimming the top and bottom 5%) are having an influence on the
variable.
“Extreme Values” and the Boxplot relate to each other. The boxplot is a graphical display of the data that
shows: (1) median, which is the middle black line, (2) middle 50% of scores, which is the shaded region, (3)
top and bottom 25% of scores, which are the lines extending out of the shaded region, (4) the smallest and
largest (non-outlier) scores, which are the horizontal lines at the top/bottom of the boxplot, and (5) outliers.
The boxplot shows both “mild” outliers and “extreme” outliers. Mild outliers are any score more than 1.5*IQR
from the rest of the scores, and are indicated by open dots. IQR stands for “Interquartile range”, and is the
middle 50% of the scores. Extreme outliers are any score more than 3*IQR from the rest of the scores, and are
indicated by stars. However, keep in mind that these benchmarks are arbitrarily chosen, similar to how p<.05
is arbitrarily chosen. For “system1”, there is an open dot. Notice that the dot says “42”, but, by looking at
“Extreme Values box”, there are actually FOUR lowest scores of “1”, one of which is case 42. Since all four
scores of “1” overlap each other, the boxplot can only display one case. In summary, this output tells us there
are four outliers, each with a value of “1”.
5. 5
4. Outliers
Another way to look for univariate outliers is to do outlier analysis within different groups in your study. For
example, imagine a study that manipulated the presence or absence of a weapon during a crime, and the
Dependent Variable was measuring the level of emotional reaction to the crime. In addition to looking for
univariate outliers for your DV, you may want to also look for univariate outliers within each condition.
In our dataset about “Legal Beliefs”, let’s treat gender as the grouping variable.
1. Select Analyze --> Descriptive Statistics --> Explore
2. Move all variables into the “Variable(s)” window.
Move “sex” into the “Factor List”
3. Click “Statistics”, and click “Outliers”
4. Click “Plots”, and unclick “Stem-and-leaf”
5. Click OK.
Output below is for “system1”
“Descriptives” box tells you descriptive statistics about the variable. Notice that information for “males” and
“females” is displayed separately.
“Extreme Values” and the Boxplot relate to each other. Notice the difference between males and females.
6. 6
5. Outliers – dealing with outliers
First, we need to identify why the outlier(s) exist. It is possible the outlier is due to a data entry mistake, so
you should first conduct the test described above as “1. Finding incorrectly entered data” to ensure that any
outlier you find is not due to data entry errors. It is also possible that the subjects responded with the “outlier”
value for a reason. For example, maybe the question is poorly worded or constructed. Or, maybe the question
is adequately constructed but the subjects who responded with the outlier values are different than the subjects
who did not respond with the extreme scores. You can create a new variable that categorizes all the subjects as
either “outlier subjects” or “non-outlier subjects”, and then re-examine the data to see if there is a difference
between these two types of subjects. Also, you may find the same subjects are responsible for outliers in many
questions in the survey by looking at the subject numbers for the outliers displayed in all the boxplots.
Remember, however, that just because a value is extreme compared to the rest of the data does not necessarily
mean it is somehow an anomaly, or invalid, or should be removed.
Second, if you want to reduce the influence of the outliers, you have four options.
Option 1 is to delete the value. If you have only a few outliers, you may simply delete those values, so they
become blank or missing values.
Option 2 is to delete the variable. If you feel the question was poorly constructed, or if there are too many
outliers in that variable, or if you do not need that variable, you can simply delete the variable. Also, if
transforming the value or variable (e.g., Options #3 and #4) does not eliminate the problem, you may want to
simply delete the variable.
Option 3 is to transform the value. You have a few options for transforming the value. You can change the
value to the next highest/lowest (non-outlier) number. For example, if you have a 100 point scale, and you
have two outliers (95 and 96), and the next highest (non-outlier) number is 89, then you could simply change
the 95 and 96 to 89s. Alternatively, if the two outliers were 5 and 6, and the next lowest (non-outlier) number
was 11, then the 5 and 6 would change to 11s. Another option is to change the value to the next highest/lowest
(non-outlier) number PLUS one unit increment higher/lower. For example, the 95 and 96 numbers would
change to 90s (e.g., 89 plus 1 unit higher). The 5 and 6 numbers change to 10s (e.g., 11 minus 1 unit lower).
Option 4 is to transform the variable. Instead of changing the individual outliers (as in Option #3), we are now
talking about transforming the entire variable. Transformation creates normal distributions, as described in the
next section below about “Normality”. Since outliers are one cause of non-normality, see the next section to
learn how to transform variables, and thus reduce the influence of outliers.
Third, after dealing with the outlier, you re-run the outlier analysis to determine if any new outliers emerge or
if the data are outlier free. If new outliers emerge, and you want to reduce the influence of the outliers, you
choose one the four options again. Then, re-run the outlier analysis to determine if any new outliers emerge or
if the data are outlier free, and repeat again.
7. Normality
Below, I describe five steps for determining and dealing with normality. However, the bottom line is that
almost no one checks their data for normality; instead they assume normality, and use the statistical tests that
are based upon assumptions of normality that have more power (ability to find significant results in the data).
First, what is normality? A normal distribution is a symmetric bell-shaped curve defined by two things: the
mean (average) and variance (variability).
Second, why is normality important? The central idea behind statistical inference is that as sample size
increases, distributions will approximate normal. Most statistical tests rely upon the assumption that your data
is “normal”. Tests that rely upon the assumption or normality are called parametric tests. If your data is not
normal, then you would use statistical tests that do not rely upon the assumption of normality, call non-
parametric tests. Non-parametric tests are less powerful than parametric tests, which means the non-parametric
tests have less ability to detect real differences or variability in your data. In other words, you want to conduct
parametric tests because you want to increase your chances of finding significant results.
7. 7
Third, how do you determine whether data are “normal”? There are three interrelated approaches to
determine normality, and all three should be conducted.
First, look at a histogram with the normal curve superimposed. A histogram provides useful graphical
representation of the data. SPSS can also superimpose the theoretical “normal” distribution onto the histogram
of your data so that you can compare your data to the normal curve. To obtain a histogram with the
superimposed normal curve:
1. Select Analyze --> Descriptive Statistics --> Frequencies.
2. Move all variables into the “Variable(s)” window.
3. Click “Charts”, and click “Histogram, with normal curve”.
4. Click OK.
Output below is for “system1”. Notice the bell-shaped black line superimposed on the distribution. All
samples deviate somewhat from normal, so the question is how much deviation from the black line indicates
“non-normality”? Unfortunately, graphical representations like histogram provide no hard-and-fast rules. After
you have viewed many (many!) histograms, over time you will get a sense for the normality of data. In my
view, the histogram for “system1” shows a fairly normal distribution.
Second, look at the values of Skewness and Kurtosis. Skewness involves the symmetry of the distribution.
Skewness that is normal involves a perfectly symmetric distribution. A positively skewed distribution has
scores clustered to the left, with the tail extending to the right. A negatively skewed distribution has scores
clustered to the right, with the tail extending to the left. Kurtosis involves the peakedness of the distribution.
Kurtosis that is normal involves a distribution that is bell-shaped and not too peaked or flat. Positive kurtosis
is indicated by a peak. Negative kurtosis is indicated by a flat distribution. Descriptive statistics about
skewness and kurtosis can be found by using either the Frequencies, Descriptives, or Explore commands. I
like to use the “Explore” command because it provides other useful information about normality, so
8. 8
1. Select Analyze --> Descriptive Statistics --> Explore.
2. Move all variables into the “Variable(s)” window.
3. Click “Plots”, and unclick “Stem-and-leaf”
4. Click OK.
Descriptives box tells you descriptive statistics about the variable, including the value of Skewness and
Kurtosis, with accompanying standard error for each. Both Skewness and Kurtosis are 0 in a normal
distribution, so the farther away from 0, the more non-normal the distribution. The question is “how much”
skew or kurtosis render the data non-normal? This is an arbitrary determination, and sometimes difficult to
interpret using the values of Skewness and Kurtosis. Luckily, there are more objective tests of normality,
described next.
Third, the descriptive statistics for Skewness and Kurtosis are not as informative as established tests for
normality that take into account both Skewness and Kurtosis simultaneously. The Kolmogorov-Smirnov test
(K-S) and Shapiro-Wilk (S-W) test are designed to test normality by comparing your data to a normal
distribution with the same mean and standard deviation of your sample:
1. Select Analyze --> Descriptive Statistics --> Explore.
2. Move all variables into the “Variable(s)” window.
3. Click “Plots”, and unclick “Stem-and-leaf”, and click “Normality plots with tests”.
4. Click OK.
“Test of Normality” box gives the K-S and S-W test results. If the test is NOT significant, then the data are
normal, so any value above .05 indicates normality. If the test is significant (less than .05), then the data are
non-normal. In this case, both tests indicate the data are non-normal. However, one limitation of the normality
tests is that the larger the sample size, the more likely to get significant results. Thus, you may get significant
results with only slight deviations from normality. In this case, our sample size is large (n=327) so the
significance of the K-S and S-W tests may only indicate slight deviations from normality. You need to eyeball
your data (using histograms) to determine for yourself if the data rise to the level of non-normal.
“Normal Q-Q Plot” provides a graphical way to determine the level of normality. The black line indicates the
values your sample should adhere to if the distribution was normal. The dots are your actual data. If the dots
fall exactly on the black line, then your data are normal. If they deviate from the black line, your data are non-
normal. In this case, you can see substantial deviation from the straight black line.
9. 9
Fourth, if your data are non-normal, what are your options to deal with non-normality? You have four basic
options.
a. Option 1 is to leave your data non-normal, and conduct the parametric tests that rely upon the
assumptions of normality. Just because your data are non-normal, does not instantly invalidate the
parametric tests. Normality (versus non-normality) is a matter of degrees, not a strict cut-off point.
Slight deviations from normality may render the parametric tests only slightly inaccurate. The issue is
the degree to which the data are non-normal.
b. Option 2 is to leave your data non-normal, and conduct the non-parametric tests designed for non-
normal data.
c. Option 4 is to transform the data. Transforming your data involving using mathematical formulas to
modify the data into normality.